. 2024 Jun 11;149(24):1885-1898.
doi: 10.1161/CIRCULATIONAHA.123.067587. Epub 2024 Apr 30.

Atherosclerosis Is a Smooth Muscle Cell-Driven Tumor-Like Disease

Affiliations

Atherosclerosis Is a Smooth Muscle Cell-Driven Tumor-Like Disease

Huize Pan et al. Circulation. .

Abstract

Background: Atherosclerosis, a leading cause of cardiovascular disease, involves the pathological activation of various cell types, including immunocytes (eg, macrophages and T cells), smooth muscle cells (SMCs), and endothelial cells. Accumulating evidence suggests that transition of SMCs to other cell types, known as phenotypic switching, plays a central role in atherosclerosis development and complications. However, the characteristics of SMC-derived cells and the underlying mechanisms of SMC transition in disease pathogenesis remain poorly understood. Our objective is to characterize tumor cell-like behaviors of SMC-derived cells in atherosclerosis, with the ultimate goal of developing interventions targeting SMC transition for the prevention and treatment of atherosclerosis.

Methods: We used SMC lineage tracing mice and human tissues and applied a range of methods, including molecular, cellular, histological, computational, human genetics, and pharmacological approaches, to investigate the features of SMC-derived cells in atherosclerosis.

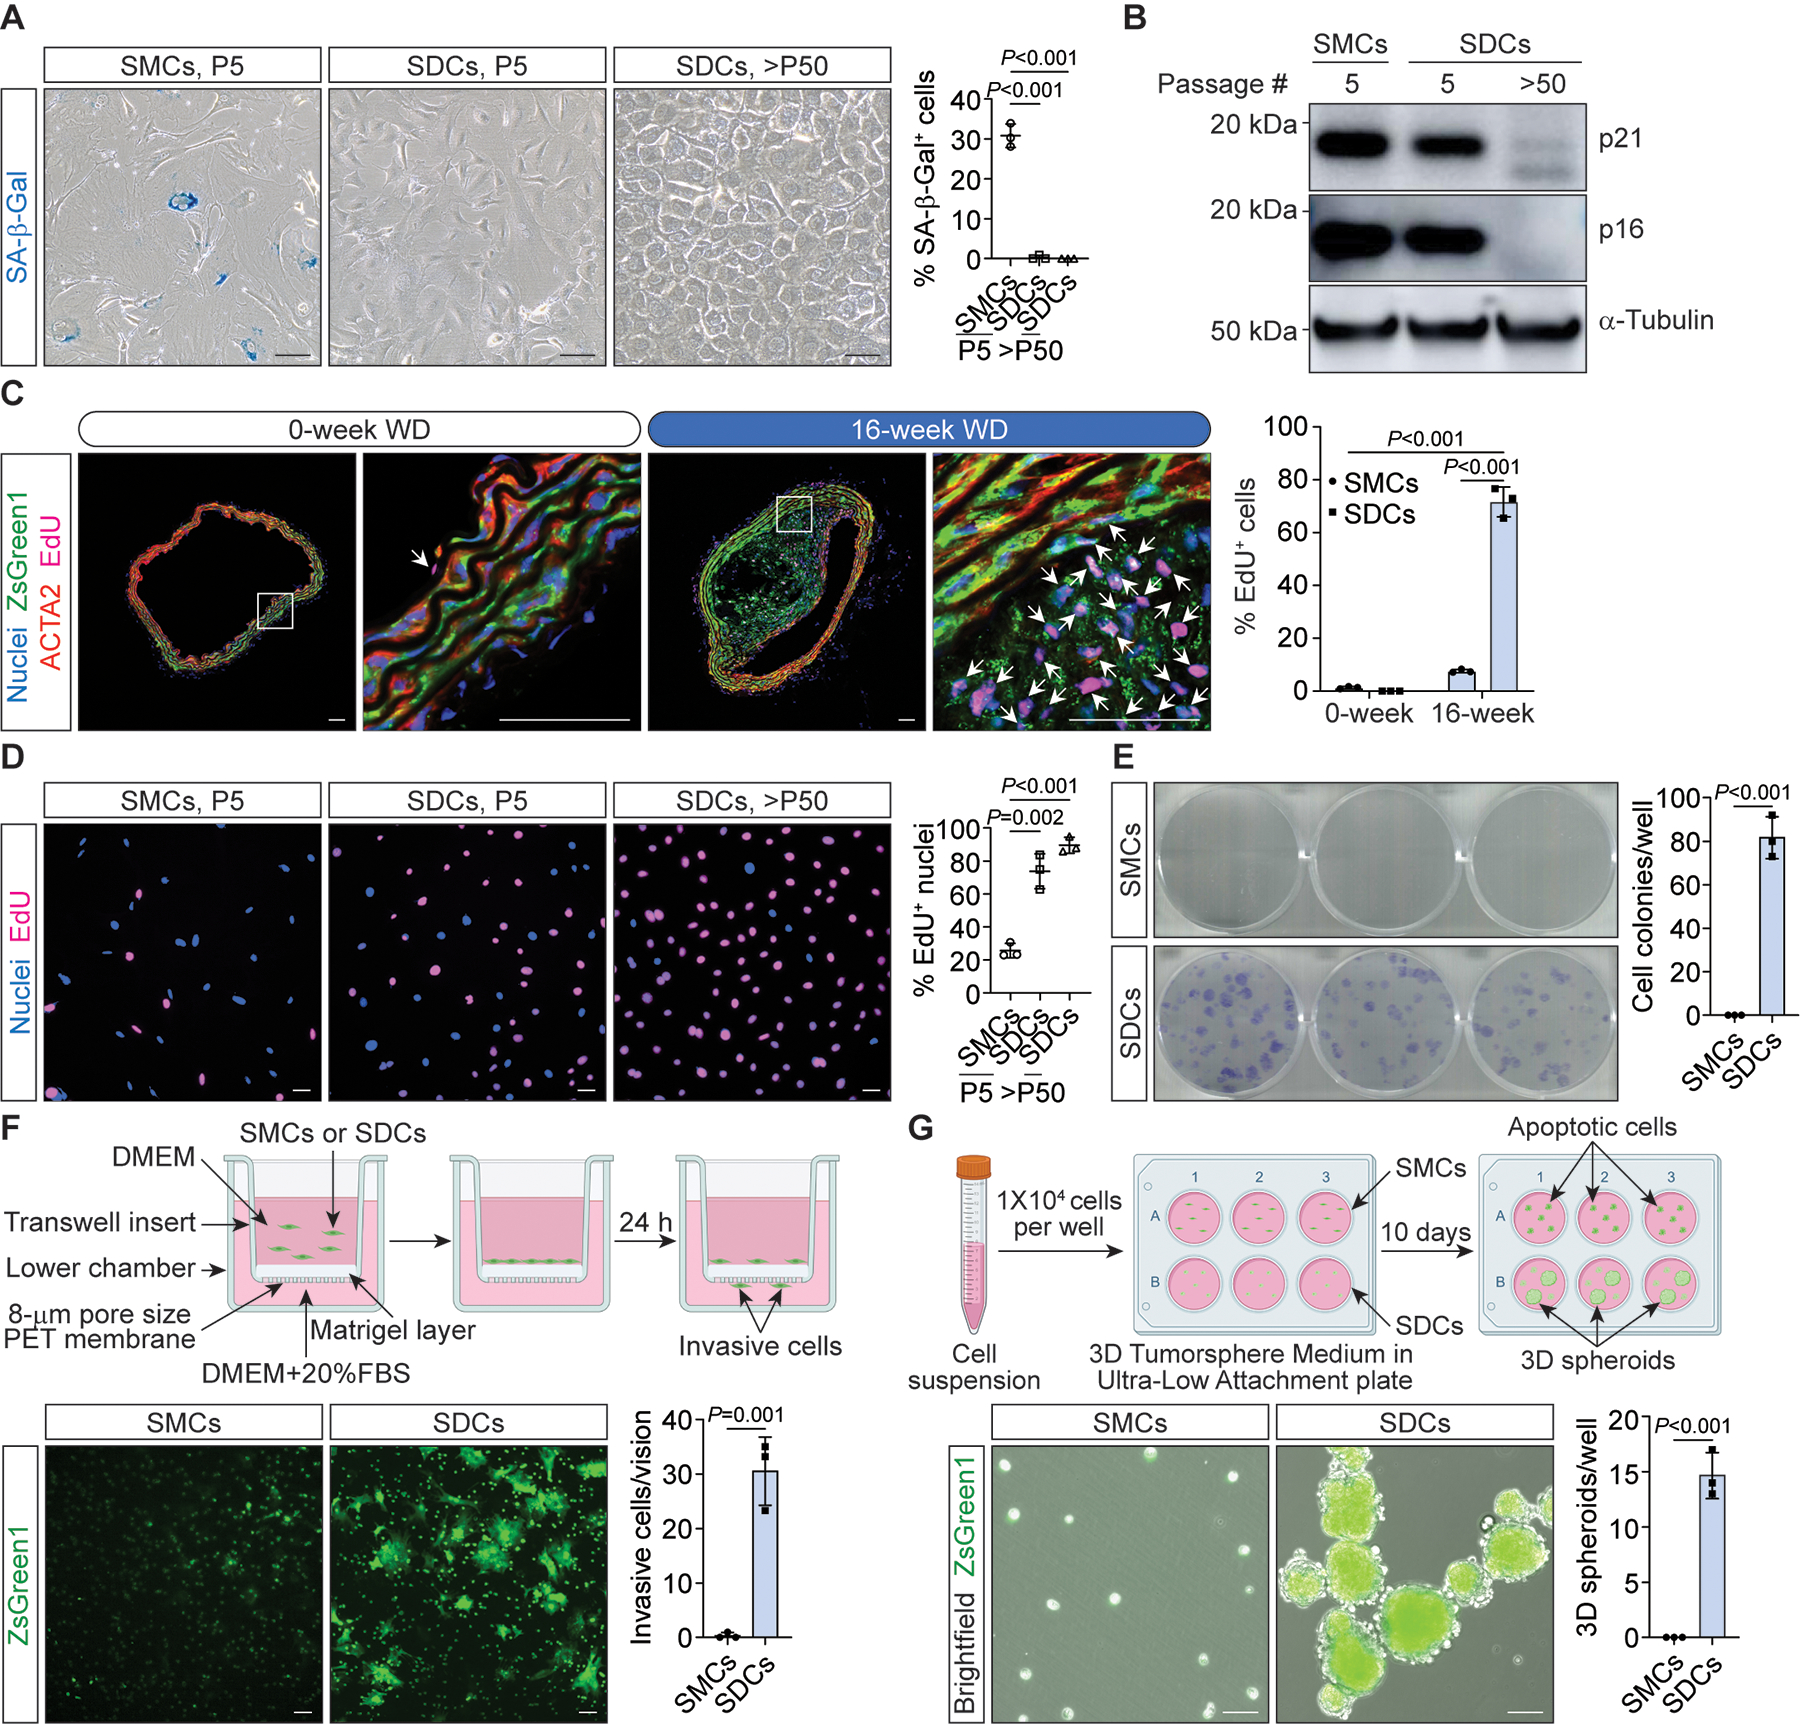
Results: SMC-derived cells in mouse and human atherosclerosis exhibit multiple tumor cell-like characteristics, including genomic instability, evasion of senescence, hyperproliferation, resistance to cell death, invasiveness, and activation of comprehensive cancer-associated gene regulatory networks. Specific expression of the oncogenic mutant KrasG12D in SMCs accelerates phenotypic switching and exacerbates atherosclerosis. Furthermore, we provide proof of concept that niraparib, an anticancer drug targeting DNA damage repair, attenuates atherosclerosis progression and induces regression of lesions in advanced disease in mouse models.

Conclusions: Our findings demonstrate that atherosclerosis is an SMC-driven tumor-like disease, advancing our understanding of its pathogenesis and opening prospects for innovative precision molecular strategies aimed at preventing and treating atherosclerotic cardiovascular disease.

Keywords: atherosclerosis; cardiovascular disease; smooth muscle cell.


Conflict of interest statement

Disclosures None.

Figures

Figure 1.
Figure 1.. Extensive genomic instability exists in SMC lineage cells in atherosclerosis.
A, Immunostaining of oxidative DNA damage marker, 8-hydroxy-2’-deoxyguanosine (8-OHdG), in brachiocephalic artery (BCA) sections during progression of atherosclerosis. ROSA26LSL-ZsGreen1/+; Ldlr−/−; Myh11-CreERT2 mice were sacrificed at 0, 8, 10, 12, or 16 weeks on Western diet (WD). Scale bars, 50 μm. B and C, Analysis of 8-OHdG+ZsGreen1+ area in BCA sections (B) and ZsGreen1+ area in intima (C). N=6 mice at each time point. D, Comet assay detects single/double-strand DNA breaks, indicated by tailed nuclei, in freshly isolated SMCs and SMC lineage cells (SLCs) from aortas of ROSA26LSL-ZsGreen1/+; Ldlr−/−; Myh11-CreERT2 mice on 0-week (SMCs, Young mice (8 weeks old) and SMCs, Old mice (34 weeks old)) and 26-week WD (SLCs, Old mice (34 weeks old)), respectively. Tailed nuclei are indicated by arrows. Scale bars, 50 μm. N=3. Significance was determined by unpaired two-tailed t test. P value is indicated. E, Heatmap shows copy number profiles estimated by CopyKAT in ZsGreen1+ SMC lineage cells (including SMC, SEM cell, and FC) from scRNA-seq of 16-week WD fed mice. SMCs from 0-week WD fed mice were used as reference (SMC-ref.). F, Line plot indicates the consensus of mouse scRNA-seq copy number profiles of each cell cluster estimated by CopyKAT in (E). G, Images show nucleus staining of ex vivo cultured SMCs and SDCs. Micronuclei (MN) are indicated by arrows. Scale bars, 50 μm. N=3. Significance was determined by unpaired two-tailed t test. P value is indicated.
Figure 2.
Figure 2.. SMC-derived cells formed in atherosclerosis show multiple tumor cell-like characteristics.
A, Detection of senescence-associated beta-galactosidase (SA-β-Gal) activity, a biomarker of cellular senescence, in ex vivo SMCs (at P5) and SDCs (at P5 and >P50). Proportions of SA-β-Gal+ SMCs and SDCs were analyzed. Scale bars, 50 μm. N=3. Significance was determined by unpaired two-tailed t test. P values are indicated. B, Immunoblotting of cellular senescence markers, p21 and p16, shows reduction in the proteins in SDCs at early passage (P5) and advanced passage (>P50) compared with SMCs at P5. C, In vivo 5-ethynyl-2’-deoxyuridine (EdU) incorporation assay shows percentage of EdU+ cells in SMCs (ACTA2+ZsGreen1+) and SDCs (ACTA2ZsGreen1+) within healthy arteries (from 0-week WD fed mice) and atherosclerotic lesions (from 16-week WD fed mice). Scale bars, 50 μm. N=3 mice/group. Significance was determined by unpaired two-tailed t test. P values are indicated. D, SMCs at P5 and SDCs at P5 and >P50 were incubated with EdU for 24 hours. Proliferative rates, marked by proportions of EdU+ nuclei, were detected by the Click-iT EdU assay. Scale bars, 50 μm. N=3. Significance was determined by unpaired two-tailed t test. P values are indicated. E, Ex vivo SDCs formed colonies at low seeding density. Cell colonies per well were counted. N=3. Significance was determined by unpaired two-tailed t test. P value is indicated. F, Schematic and representative images of cell invasion assay with SMCs and SDCs. Number of cells invading through Matrigel layer were analyzed. Scale bars, 50 μm. N=3. Significance was determined by unpaired two-tailed t test. P value is indicated. G, Schematic and representative images of 3-dimensional (3D) spheroid formation assay with SMCs and SDCs. SMCs and SDCs were seeded into ultra-low attachment plate and cultured with 3D Tumorsphere Medium for 10 days. 3D spheroids were counted. Scale bars, 50 μm. N=3. Significance was determined by unpaired two-tailed t test. P value is indicated.
Figure 3.
Figure 3.. Analysis of cancer-associated signaling pathways activated in SDCs versus SMCs in atherosclerosis.
A, Heatmap shows median scores of 12 cancer-associated signaling pathways in SMCs, SEM cells, and FCs estimated by Pathway RespOnsive GENes (PROGENy). B, Violin plot shows PROGENy score for NFκB pathway. C, Immunoblotting results indicate that phospho-NFκB p65 (S536) was increased in SDCs versus SMCs. D, Violin plot shows PROGENy score for PI3K pathway. E, Immunoblotting results indicate that phospho-AKT (S473) was increased in SDCs versus SMCs. F, Violin plot shows PROGENy score for MAPK pathway. G, Immunoblotting results indicate that phospho-ERK1/2 (T202/Y204) was elevated in SDCs versus SMCs. H and I, Immunostaining of phospho-AKT (S473) (H) and phospho-ERK1/2 (T202/Y204) (I) in human carotid atherosclerotic lesions. Media and intima regions are indicated. Scale bars, 50 μm. J, Summary of cancer-associated signaling pathways that were activated in SDCs. Key transducers of each activated signaling pathway that were validated via immunoblotting are marked by red dots. Cancer-related functions of these signaling pathways are indicated. FDR-adjusted P values from Dunn’s test are shown on violin plots.
Figure 4.
Figure 4.. SMC-specific expression of KrasG12D accelerates SMC phenotypic switching during atherosclerosis progression.
A, Kras+/+; ROSA26LSL-ZsGreen1/+; Ldlr−/−; Myh11-CreERT2 (SMC-Kras+/+) and KrasLSL-G12D/+; ROSA26LSL-ZsGreen1/+; Ldlr−/−; Myh11-CreERT2 (SMC-KrasG12D/+) mice were sacrificed at time points of 0, 8, 10, or 12 weeks of WD. Representative images of mouse BCA sections stained with oxidative DNA damage marker, 8-OHdG, at each time point are shown. Scale bars, 50 μm. B through D, Statistical analyses of 8-OHdG+ZsGreen1+ area (B) and ZsGreen1+ area (C) in neointima and total atherosclerotic lesion area (D) within BCA sections. N=8 mice/group. Significance was determined by unpaired two-tailed t test. Bonferroni-corrected P values are indicated. P values are indicated. E, SMC phenotypic switching process is divided into four stages: stage 1, contractile SMC; stage 2, early remodeled SMC/SDC; stage 3, fibrous cap SMC/SDC; and stage 4, neointimal SDC. Proportion and number of SMC-Kras+/+ and SMC-KrasG12D/+ mice at each stage of SMC phenotypic switching at each time point are indicated. N=8 mice/group. F, RT-qPCR of macrophage marker genes, Cd68 and Lgals3, in Kras+/+ and KrasG12D/+ SMCs treated with or without cholesterol (40 μg/ml) for 3 days. N=3. Significance was determined by unpaired two-tailed t test. P values are indicated.
Figure 5.
Figure 5.. Niraparib shows both preventive and therapeutic effects on atherosclerosis in mouse models.
A, Schematic of administration of niraparib to ROSA26LSL-ZsGreen1/+; Ldlr−/−; Myh11-CreERT2 mice during progression of atherosclerosis. Representative images of hematoxylin and eosin (H&E)-stained aortic sinus sections from vehicle (Veh) and niraparib (Nira)-treated mice are shown. Lesion areas and necrotic core areas are indicated with black and grey dotted lines, respectively. Scale bars, 200 μm. B through D, Statistical analyses of lesion area (B), necrotic core area (C), and ratio of fibrous cap/lesion area (D) in H&E-stained sections from Veh and Nira-treated mice in (A). N=8 mice/group. Significance was determined by unpaired two-tailed t test. P values are indicated. E, Schematic of niraparib treatment to SMC lineage tracing mice with established atherosclerosis. Representative images of Oil Red O-stained en face aortas from mice of two groups are shown. F, Proportions of plaque area in aortas from Veh and Nira-treated mice in (E). N=8 mice/group. Significance was determined by unpaired two-tailed t test. P value is indicated. G, Representative images of H&E-stained aortic sinus sections from Veh and Nira-treated mice with established atherosclerosis. Scale bars, 200 μm. H through J, Statistical analyses of lesion area (H), necrotic core area (I), and ratio of fibrous cap/lesion area (J) in H&E-stained sections from Veh and Nira-treated mice in (G). N=8 mice/group. Significance was determined by unpaired two-tailed t test. P values are indicated.
Figure 6.
Figure 6.. A conceptual model of “athero-oncology”.
A, SMC-derived cells (SDCs) in atherosclerosis exhibit multiple tumor cell-like characteristics, including genomic instability, sustained proliferative capacity, resisting cell death, invasiveness, and cancer stem cell-like features. Comprehensive cancer-associated gene regulatory networks are activated in SDCs. Oncogenic mutations (e.g., KrasG12D in this study) can accelerate SMC phenotypic switching and exacerbate atherosclerosis. Some cancer chemotherapies (e.g., niraparib) may also be useful for the prevention and treatment of atherosclerotic cardiovascular disease. B, A broad “athero-oncology” model proposing that somatic gene mutations in myeloid cells (clonal hematopoiesis of indeterminate potential, CHIP) and vascular SMCs with DNA damage/somatic gene mutations may account for cell expansion and synergistically drive progression of atherosclerosis.

Update of

Comment in

References

    1. Herrington W, Lacey B, Sherliker P, Armitage J and Lewington S. Epidemiology of Atherosclerosis and the Potential to Reduce the Global Burden of Atherothrombotic Disease. Circ Res. 2016;118:535–46. - PubMed
    1. Stary HC, Chandler AB, Dinsmore RE, Fuster V, Glagov S, Insull W Jr., Rosenfeld ME, Schwartz CJ, Wagner WD and Wissler RW. A definition of advanced types of atherosclerotic lesions and a histological classification of atherosclerosis. A report from the Committee on Vascular Lesions of the Council on Arteriosclerosis, American Heart Association. Arterioscler Thromb Vasc Biol. 1995;15:1512–31. - PubMed
    1. Basatemur GL, Jorgensen HF, Clarke MCH, Bennett MR and Mallat Z. Vascular smooth muscle cells in atherosclerosis. Nat Rev Cardiol. 2019;16:727–744. - PubMed
    1. Gomez D and Owens GK. Smooth muscle cell phenotypic switching in atherosclerosis. Cardiovasc Res. 2012;95:156–64. - PMC - PubMed
    1. Wirka RC, Wagh D, Paik DT, Pjanic M, Nguyen T, Miller CL, Kundu R, Nagao M, Coller J, Koyano TK, Fong R, Woo YJ, Liu B, Montgomery SB, Wu JC, Zhu K, Chang R, Alamprese M, Tallquist MD, Kim JB and Quertermous T. Atheroprotective roles of smooth muscle cell phenotypic modulation and the TCF21 disease gene as revealed by single-cell analysis. Nat Med. 2019;25:1280–1289. - PMC - PubMed