. 2024 Jul 8;52(12):7188-7210.
doi: 10.1093/nar/gkae291.

The RBPome of influenza A virus NP-mRNA reveals a role for TDP-43 in viral replication

Affiliations

The RBPome of influenza A virus NP-mRNA reveals a role for TDP-43 in viral replication

Maud Dupont et al. Nucleic Acids Res. .

Abstract

Genome-wide approaches have significantly advanced our knowledge of the repertoire of RNA-binding proteins (RBPs) that associate with cellular polyadenylated mRNAs within eukaryotic cells. Recent studies focusing on the RBP interactomes of viral mRNAs, notably SARS-Cov-2, have revealed both similarities and differences between the RBP profiles of viral and cellular mRNAs. However, the RBPome of influenza virus mRNAs remains unexplored. Herein, we identify RBPs that associate with the viral mRNA encoding the nucleoprotein (NP) of an influenza A virus. Focusing on TDP-43, we show that it binds several influenza mRNAs beyond the NP-mRNA, and that its depletion results in lower levels of viral mRNAs and proteins within infected cells, and a decreased yield of infectious viral particles. We provide evidence that the viral polymerase recruits TDP-43 onto viral mRNAs through a direct interaction with the disordered C-terminal domain of TDP-43. Notably, other RBPs found to be associated with influenza virus mRNAs also interact with the viral polymerase, which points to a role of the polymerase in orchestrating the assembly of viral messenger ribonucleoproteins.


Figures

Graphical Abstract
Graphical Abstract
Figure 1.
Figure 1.
Identification of cellular proteins bound to influenza virus NP-mRNA in human infected cells. (A) Schematic representation of the eRIC approach. Created with Biorender.com. (B) Volcano plots showing the log2 fold change (x axis) and its significance (–log10(P-value)) associated to a False Discovery Rate < 1%, y axis) of each protein (dots) in the eRIC experiments. Left plot: the log2 fold change refers to the enrichment in infected crosslinked (IAV + XL, n = 3) versus non-infected crosslinked (noIAV + XL, n = 3) samples. Right plot: the log2 fold change refers to the enrichment in infected crosslinked (IAV + XL, n = 3) versus infected non-crosslinked (IAV + noXL, n = 2) samples. Orange and blue dots represent proteins enriched in IAV + XL versus noIAV + XL samples, and proteins enriched in IAV + XL versus IAV + noXL samples, respectively. The set of 16 cellular proteins found to be enriched in both comparisons is referred to as the core interactome of the viral NP-mRNA. The viral NP and NS1 proteins are indicated in bold.
Figure 2.
Figure 2.
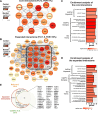
Characterisation of the NP-mRNA interactome. (A, B) Interaction network among the 16 proteins of the core interactome (A) and the 51 proteins of the expanded interactome (B), according to the STRING database (39). Predicted protein–protein interactions are indicated by grey lines, and line thickness represents the prediction confidence score. The color scales represent the log2 fold changes characteristic of each protein and refer to the enrichment in the infected crosslinked versus non-infected crosslinked condition (border color) or to the enrichment in infected crosslinked versus infected non-crosslinked (center color) samples. A yellow colour in the center corresponds to the minimal positive enrichment value recorded in the [IAV + XL versus noIAV + XL] comparison (21 = 2-fold and 20.59 = 1.505-fold enrichment for the core and expanded interactome, respectively). A yellow colour in the border corresponds to the minimal positive enrichment value recorded in the [IAV + XL versus IAV + noXL] comparison (21 = 2-fold for both the core and expanded interactome). (C, D) Gene Ontology (GO) term, InterPro Domains and UniProt Keywords enrichment analysis on the core (C) and expanded (D) interactome. The graph represents the number of genes corresponding to each indicated category (x axis) and the enrichment P-value (color scale). (E) Venn diagram representing the overlap between the expanded interactome of the viral NP-mRNA and the cellular poly(A)-mRNA interactomes published by Castello et al. (10) and Baltz et al. (11). Proteins are ranked in alphabetical order and are indicated in bold when they belong to the core interactome. Created with Biorender.com.
Figure 3.
Figure 3.
Functional analysis of the NP-mRNA core interactome. (A) Secondary screening of the proteomics hits by siRNA-mediated silencing. A549 cells were treated with control non-target siRNAs (NT, black bar), NUP62 siRNAs (white bar) or siRNAs targeting the indicated RBPs (grey bars) and infected at 48 hpt with the WSN-PB2-2A-Nanoluc virus (0.001 PFU/cell). Luciferase activities were measured in cell lysates prepared at 24 hpi. The data shown (RLU: Relative Light Units) are expressed as percentages (100%: non-target siRNA) and are the mean ± SD of three independent experiments performed in triplicates. *P < 0.05; **P < 0.01; ***P < 0.001 (one-way ANOVA and Dunnett's multiple comparisons test, reference: NT). (B) Validation of viral mRNA-binding proteins. CLIP-qPCR was performed on HEK-293T cells overexpressing one of the candidate RBPs fused to the 3xFlag tag at its C-terminal end (hnRNPA2B1-, TDP-43-, hnRNPH1-, SF3B4-3xFlag) or N-terminal end (3xFlag-SF3A3). The mCherry-3xFlag protein was used as a negative control. At 48 hpt, HEK-293T cells were infected with WSN at a MOI of 5 PFU/cell for 6 h before UV crosslinking, lysis and pulldowns were performed. After the pulldown, RNAs cross-linked to RBPs were eluted from the beads by proteinase K digestion, followed by precipitation of the RNA, cDNA conversion and qPCR. The levels of NP-mRNA, -cRNA, -vRNA, NA-mRNA and actin-mRNA were determined, and the enrichment-folds with the RPBs over the mCherry control (dotted line) were plotted. The X-axis is broken to indicate that the pulldown of 3xFlag-SF3A3 was carried out in a distinct series of experiments. The data shown are the mean ± SD of three independent experiments in triplicates. *P < 0.05; **P < 0.01; ***P < 0.001 (two-way ANOVA after log10-transformation of the data and Dunnett's multiple comparisons test, reference: mCherry). Created with Biorender.com.
Figure 4.
Figure 4.
Viral growth is impaired in TDP-43 knock-out cells. (A) Effect of TDP-43 knock-out on the steady-state levels of viral proteins. A549-derived control cells (Cas9) or TDP-43 knock-out cells (KO1 and KO2) were infected with the WSN virus at a MOI of 5 PFU/cell. Total extracts were prepared at 4 and 6 hpi and were analysed by immunoblots using antibodies directed against the indicated proteins. Cropped blots are shown. The measured abundances for TDP-43 and the indicated viral proteins are normalized over the tubulin signal and expressed as percentages (100% : WSN-infected Cas9 cells at 6 hpi). The data shown are the mean ± SD of four independent experiments. **P < 0.01; ***P < 0.001 (two-way ANOVA and Dunnett's multiple comparisons test, reference: Cas9). (B, C) Effect of TDP-43 knock-out on viral growth. Cas9 (black curve), KO1 (yellow curve) and KO2 cells (blue curve) were seeded on 96-well plates, infected with the WSN-PB2-2A-mCherry (B) of RSV-GFP (C) virus at a MOI of 0.01 and 0.1 PFU/cell, respectively, and placed in the Incucyte S3 instrument for real-time monitoring of the fluorescence levels. The data shown (RCU or GCU: Red or Green Calibrated Units) are expressed as percentages of the signal measured on Cas9 cells at the latest time point and are the mean ± SD of three independent experiments performed in triplicates. *P < 0.05; **P < 0.01 (two-way ANOVA with a Dunnett's multiple comparisons test, reference: Cas9). (D, E) Effect of TDP-43 knock-out on the production of infectious influenza viral particles. Cas9 (black curve) or KO2 cells (blue curve) were infected with the WSN (D) or a seasonal H1N1pdm09 (E) virus at a low MOI (0.0003 and 0.003 PFU/cell, respectively). The supernatants were collected at the indicated time-points and viral titers were determined by plaque assay. The data shown are the mean ± SD of three independent experiments in triplicates. Triplicate samples were pooled before titration. Dotted line: viral input. *P < 0.05; **P < 0.01, two-way ANOVA after log10 transformation of the data and Sidak's multiple comparisons test). (F) Effect of TDP-43 knock-out and rescue on the accumulation of influenza virus NP-RNAs. Cas9, KO2 or KO2 cells rescued with the wild-type TDP-43 (KO2-TDP) were infected with the WSN virus at a MOI of 3 PFU/cell. Total RNAs were extracted at 5 hpi and subjected to strand-specific RT-qPCR as described in (45). RNA steady-state levels were normalised to GAPDH and analysed using the 2−ΔΔCT method. The data shown are expressed as percentages (100%: Cas9 cells) and are the mean ± SD of four independent experiments performed in triplicates. *P < 0.05; **P < 0.01; ***P < 0.001 (one-way ANOVA and Tukey's multiple comparisons test). (G) Effect of TDP-43 gene rescue on influenza virus growth. Cas9 (black curve), KO2 (blue curve) and KO2-TDP cells (green curve) were seeded on 96-well plates, infected with the WSN-PB2-2A-mCherry virus at a MOI of 0.01 PFU/cell and placed in the Incucyte S3 instrument for real-time monitoring of the fluorescence levels. The data shown (RCU) are expressed in percentages (100%: KO2-TDP cells at 36 hpi) and are the mean ± SD of five independent experiments performed in triplicates. *P < 0.05; **P < 0.01, ***P < 0.001 (two-way ANOVA and Dunnett's multiple comparisons test, reference: KO2 cells).
Figure 5.
Figure 5.
TDP-43 binds to the viral polymerase (FluPol). (A) TDP-43 binding to influenza virus mRNAs beyond the NP- and NA-mRNAs. The RNAs co-purified with TDP-43 in the experiments shown in Figure 3B were analysed by RT-qPCR using primers specific for the PB2-, PB1-, PA- and HA-mRNAs. For each mRNA, the enrichment-fold with TDP-43 over the mCherry control (dotted line) was plotted. The data shown are the mean ± SD of three independent experiments in triplicates. The data shown for NP-, NA- and actin-mRNAs are the same as in Figure 3B. *P < 0.05; **P < 0.01; ***P < 0.001 (two-way ANOVA after log10-transformation of the data and Dunnett's multiple comparisons test, reference: mCherry). (B) Schematic representation of the conditions used for RNAPII-driven or vRNP-driven synthesis of the NA-mRNA. HEK-293T cells were co-transfected with the RPB-Flag expression plasmid and a pcDNA-NA expression plasmid (top), to get NA-mRNA transcribed by the cellular RNAPII. Alternatively, HEK-293T were co-transfected with the RPB-Flag expression plasmid, pcDNA-PB1, PB2, PA and -NP plasmids, and a pPolI-NA plasmid that expresses the NA viral genomic RNA (bottom), to get NA mRNA transcribed by the viral polymerase. At 24 hpt, cell lysates were prepared, and CLIP-qPCR was performed as described above (Figure 3B). Created with Biorender.com. (C) Binding of TDP-43 to the influenza NA-mRNA in the two experimental conditions described in (B). HEK-293T cells were transfected with an mCherry-, PABPC1- or TDP-43- 3xFlag expression plasmid, alongside with plasmids allowing the transcription of the NA-mRNA by the cellular RNAPII or the viral polymerase. At 48 hpt, cell lysates were prepared, CLIP-qPCR was performed, and the levels of NA-mRNA, NA-vRNA and actin-mRNA were determined in the lysates and the eluates (Supplementary Figure S7A). The NA mRNA enrichment-folds in the eluates over the lysates were plotted (dashed line: elutate to lysate ratio of 1). The data shown are the mean ± SD of three independent experiments in triplicates. ns: non significant; *P < 0.05; ***P < 0.001 (two-way ANOVA after log10-transformation of the data and Tukey's multiple comparisons test, only the most relevant statistics are shown). (D, E) Cell-based RBP-FluPol binding assays. Schematic representation of the protein complementation assays (iPCA and PCA) based on two subdomains of the Gaussia luciferase, Gluc1/Gluc2 or G1/G2, are shown. HEK-293T cells were transfected with a plasmid encoding the RBP of interest fused to Gluc2 (RBP-Gluc2), and either infected with a recombinant WSN influenza virus expressing a Gluc1-tagged polymerase for iPCA (D) or co-transfected with expression plasmids for a WSN-derived, Gluc1-tagged viral polymerase for PCA (E). An active Gaussia luciferase is reconstituted when a direct RBP-FluPol interaction occurs. Luciferase activities were measured in iPCA cell lysates at 6 hpi (D) or in PCA cell lysates at 24 hpt (E). Normalised Luminescence Ratios (NLRs) were calculated as described in the Methods section. The dotted line represents the NLR measured for the TOP3B protein, which was selected as a stringent negative control based on previously published data (19). The RPB1 and chANP32A proteins were used as positive controls. The data shown are the mean ± SD of four independent experiments performed in triplicates. *P < 0.05, ***P < 0.001 (one-way ANOVA and Dunnett's multiple comparisons test, reference: TOP3B). Created with Biorender.com.
Figure 6.
Figure 6.
TDP-43 is recruited to viral mRNA via an interaction with the viral polymerase (FluPol). (A) Schematic representation of TDP-43 subdomains and deletion mutants. Nter: N-terminal domain; RBD: RNA-binding domain; Cter: C-terminal domain; NLS: Nuclear Localization Domain; RRM1 and RRM2: RNA Recognition Motifs 1 and 2; Q/N: Glutamine/Asparagine-rich region; Gly-rich: Glycine-rich region. Amino-acid substitutions are indicated. ΔCter: deletion of Cter; ΔNter: deletion of Nter. Created with Biorender.com. (B–D) Effect of gene rescue with wild-type or mutant TDP-43 proteins on viral growth. TDP-43 knock-out (KO2, blue curve) and wild-type (TDP, green curve) or mutant (ΔCter, RBD, ΔNter, E17R, M337V, F147L-F149L, black curves, open symbols) gene rescued cells were seeded on 96-well plates, infected with the WSN-PB2-2A-mCherry virus at a MOI of 0.01 PFU/cell and placed in the Incucyte S3 instrument for real-time monitoring of the fluorescence levels. The data (RCU) are expressed in percentages (100%: KO2-TDP cells at 36 hpi) and are shown as the mean ± SD of five (B, C) or three (D) independent experiments performed in triplicates. The data in (B, C) and in Figure 4G were generated in parallel, however for increased readability they were represented in three separate graphs, with the KO2 (blue curve) and wild-type gene rescue cells (green curve) being used as a common reference in all graphs. *P < 0.05; **P < 0.01 (two-way ANOVA and Dunnett's multiple comparisons test, reference : KO2 cells). (E) RNase sensitivity of the interaction between TDP-43 and FluPol. Split-luciferase-based PCA was performed in HEK-293T cells transiently expressing the indicated wild-type (wt) or mutant TDP-43 proteins fused to Gluc2 and WSN-PB2-Gluc1, PB1 and PA. As an RNase-dependent interaction control, the cellular ANP32A protein (fused to Gluc2) and viral NP protein (fused to Gluc1) were co-expressed. After 24 hpt, cell lysates were split in two halves which were supplemented with RNase A (hatched bars) or not (solid bars) and incubated for 30 min at 37°C prior to luciferase activity measurement. The data shown are expressed as NLR and are the mean ± SD of four independent experiments performed in triplicates. ***P < 0.001; ns: non significant (two-way ANOVA and Tukey's multiple comparisons test, only the most relevant statistics are shown). (F) Mapping of TDP-43 binding domain to the FluPol. Split-luciferase-based PCA was performed as in Figure 5E. The indicated wt or mutant TDP-43 proteins tagged with Gluc2 were transiently co-expressed with WSN-PB2-Gluc1, -PB1 and -PA. The data shown are the mean ± SD of nine independent experiments performed in triplicates. ***P < 0.001 (one-way ANOVA and Tukey's multiple comparisons test, only the most relevant statistics are shown). (G) Proximity labelling of TDP-43 in WSN-infected cells. KO2 cells were rescued with TurboID-fused TDP-43, either wt or ΔCter. KO2 cells rescued with untagged wt TDP-43 were used as a control. Proximity labelling based assays were performed on cells infected with the WSN virus at a MOI of 5 PFU/cell (+) or mock-infected (–). At 5 hpi, cells were treated with 50 μM biotin for 10 min. Cell lysates were prepared and biotinylated proteins were purified on Streptavidin-beads. Lysates and eluates were analysed by western blot. The measured abundances of PB2, PA and HA proteins are expressed as eluate to lysate ratios and as the mean ± SD of three independent experiments. *P< 0.05; **P < 0.01 (two-way ANOVA with a Tukey's multiple comparisons test). (H) Binding of TDP-43 mutants to the influenza NP-mRNA. HEK-293T cells transiently expressing the indicated wt or mutant TDP-43 proteins fused to 3xFlag, or the mCherry-3xFlag protein, were infected with the WSN virus at a MOI of 5 PFU/cell. At 5 hpi cell lysates were prepared and CLIP-qPCR was performed. The Flag-tagged proteins were detected by western blot (Supplementary Figure S11C), and the levels of NP-mRNA and LRPPRC-mRNA were determined in the lysates (Supplementary Figure S11D) and in the eluates (this figure). The mRNA enrichment-folds over the mCherry control (dotted line) were plotted. The data shown are the mean ± SD of three independent experiments in triplicates. ns: non significant; ***P < 0.001 (two-way ANOVA after log10-transformation of the data and Tukey's multiple comparisons test, only the most relevant statistics are shown).
Figure 7.
Figure 7.
Model for the recruitment of host RNA binding proteins to viral mRNAs by the transcribing viral polymerase in the nucleus of influenza virus-infected cells. RNP: ribonucleoprotein. mRNP: messenger ribonucleoprotein. RBPs: RNA binding proteins. RNPAII: host RNA polymerase II. Created with Biorender.com.

References

    1. Krammer F., Smith G.J.D., Fouchier R.A.M., Peiris M., Kedzierska K., Doherty P.C., Palese P., Shaw M.L., Treanor J., Webster R.G.et al.. Influenza. Nat. Rev. Dis. Primers. 2018; 4:3. - PMC - PubMed
    1. Te Velthuis A.J.W., Grimes J.M., Fodor E.. Structural insights into RNA polymerases of negative-sense RNA viruses. Nat. Rev. Micro. 2021; 19:303–318. - PMC - PubMed
    1. Wandzik J.M., Kouba T., Cusack S.. Structure and function of influenza polymerase. Cold Spring Harb. Perspect. Med. 2021; 11:a038372. - PMC - PubMed
    1. Read E.K.C., Digard P.. Individual influenza A virus mRNAs show differential dependence on cellular NXF1/TAP for their nuclear export. J. Gen. Virol. 2010; 91:1290–1301. - PMC - PubMed
    1. Esparza M., Bhat P., Fontoura B.M.. Viral–host interactions during splicing and nuclear export of influenza virus mRNAs. Curr. Opin. Virol. 2022; 55:101254. - PMC - PubMed

MeSH terms

LinkOut - more resources