. 2024 Apr 30:13:e86132.
doi: 10.7554/eLife.86132.

Digital wearable insole-based identification of knee arthropathies and gait signatures using machine learning

Affiliations

Digital wearable insole-based identification of knee arthropathies and gait signatures using machine learning

Matthew F Wipperman et al. Elife. .

Abstract

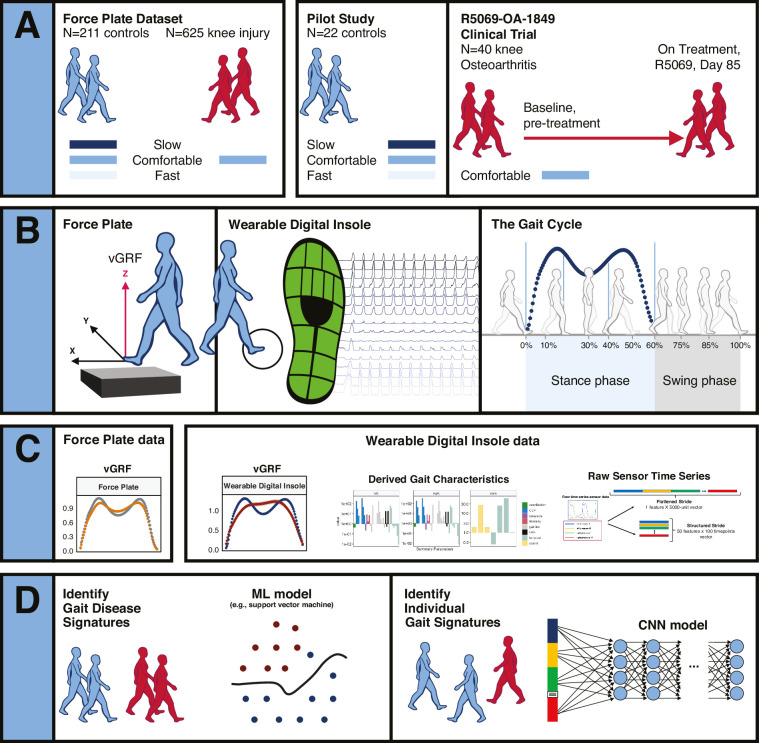
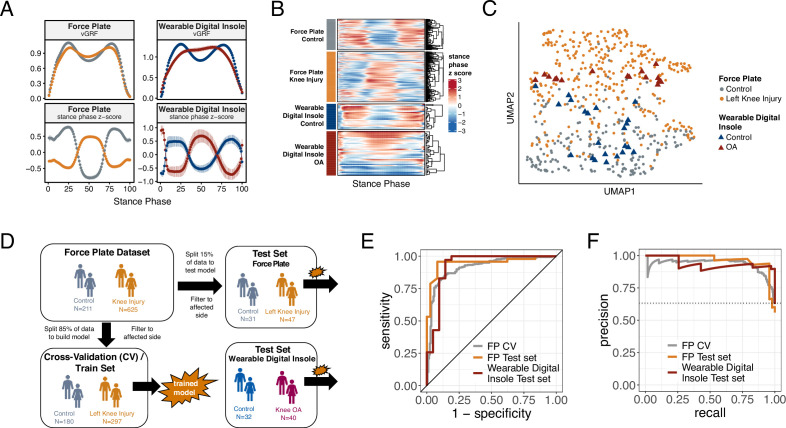
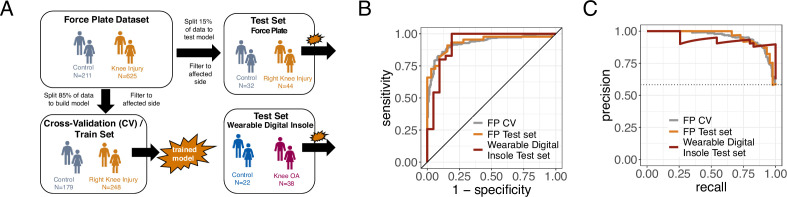
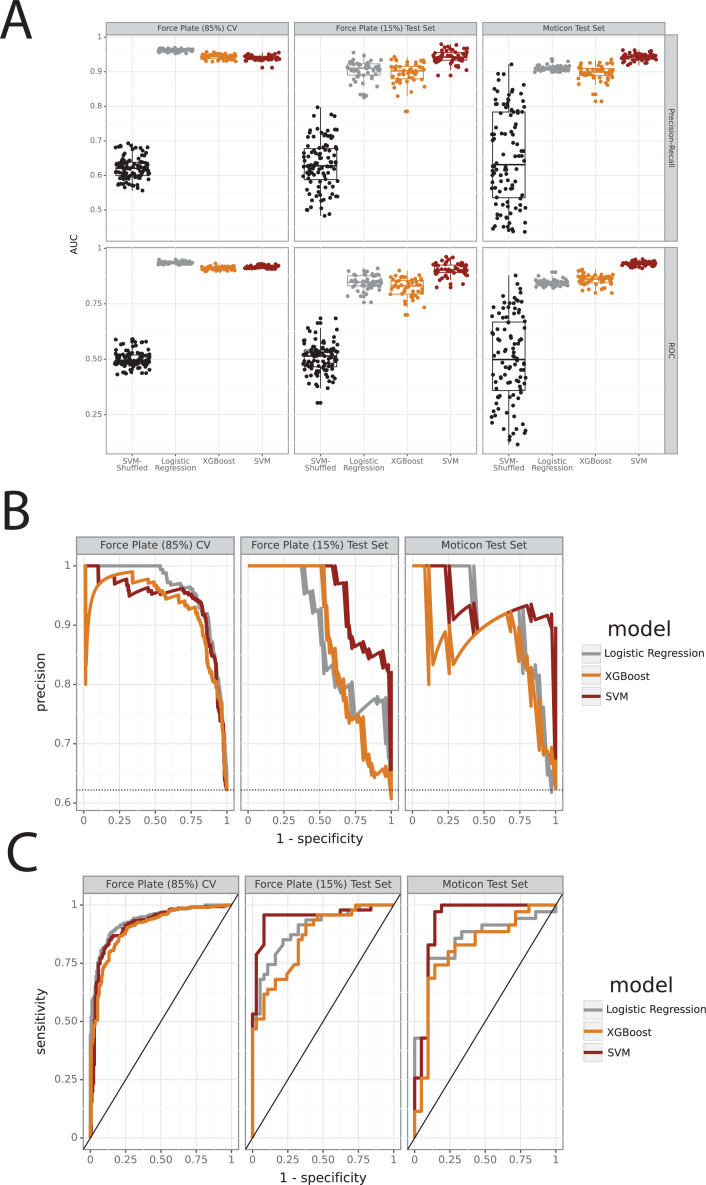
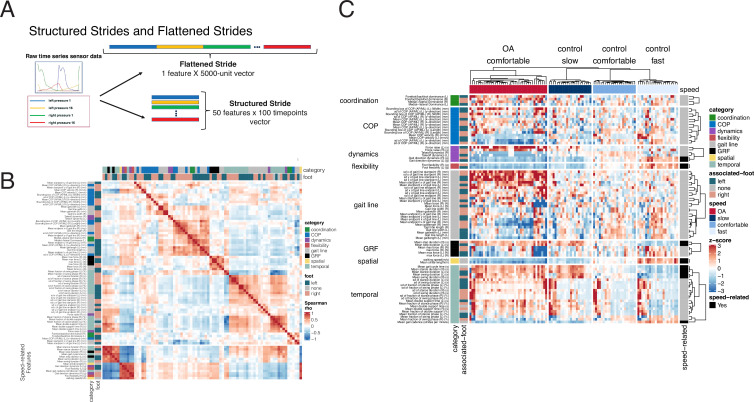
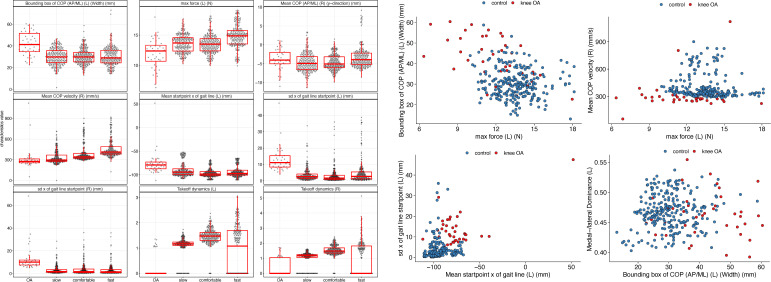
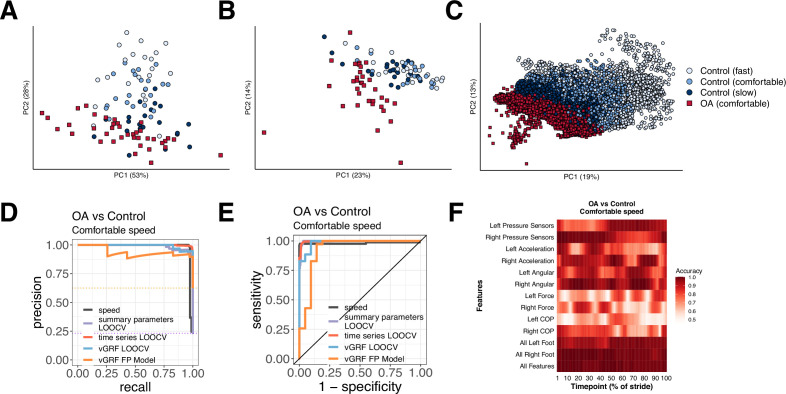
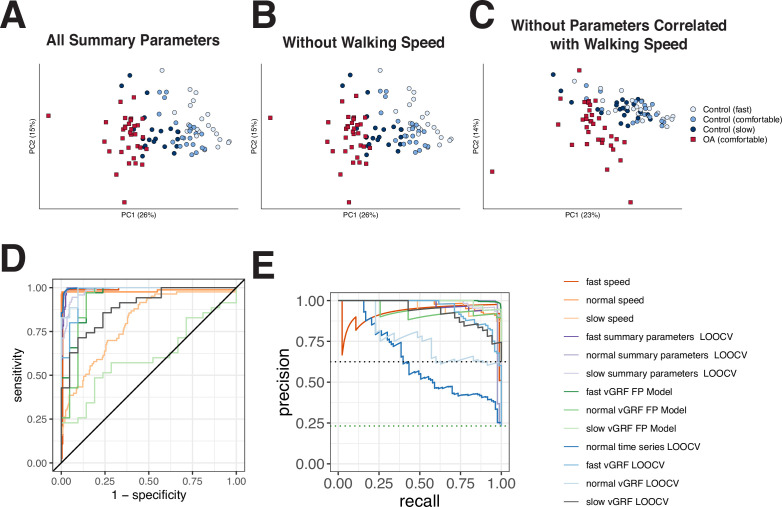
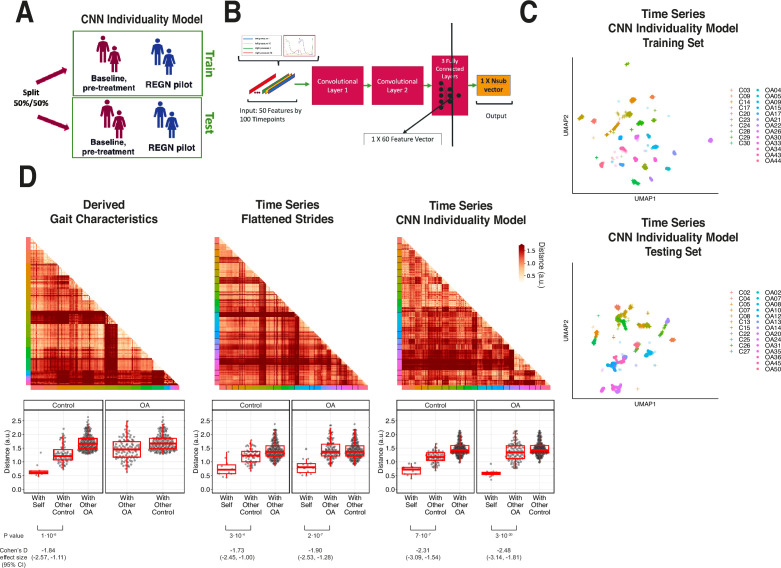
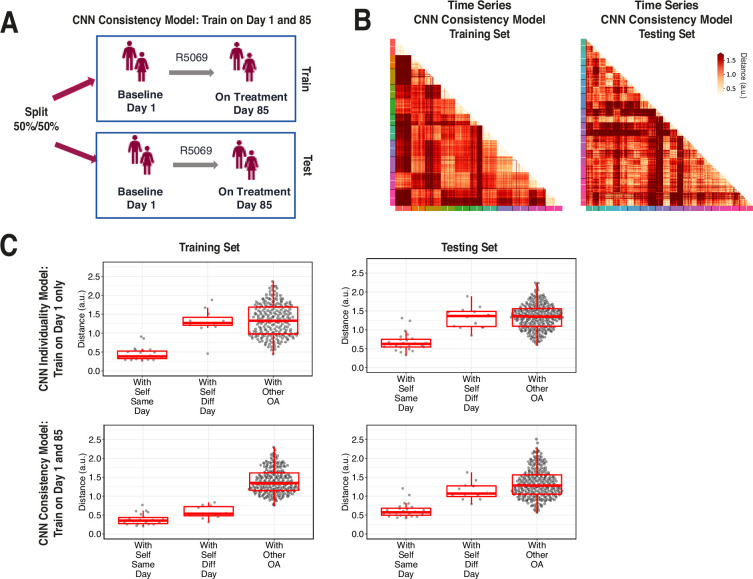
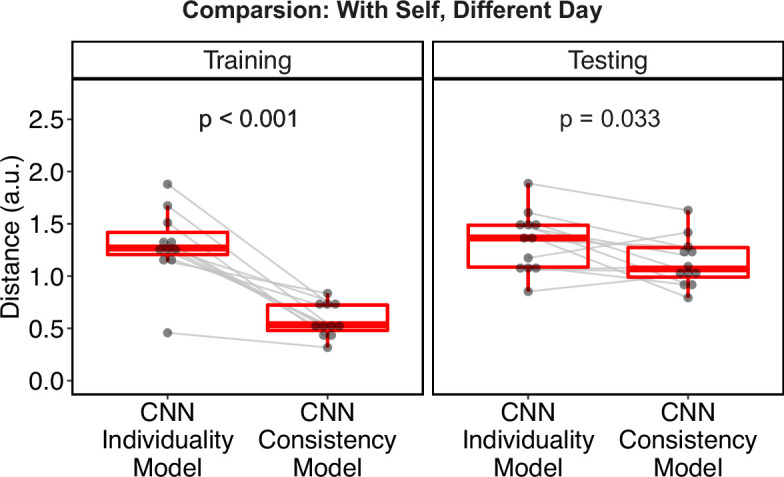
Gait is impaired in musculoskeletal conditions, such as knee arthropathy. Gait analysis is used in clinical practice to inform diagnosis and monitor disease progression or intervention response. However, clinical gait analysis relies on subjective visual observation of walking as objective gait analysis has not been possible within clinical settings due to the expensive equipment, large-scale facilities, and highly trained staff required. Relatively low-cost wearable digital insoles may offer a solution to these challenges. In this work, we demonstrate how a digital insole measuring osteoarthritis-specific gait signatures yields similar results to the clinical gait-lab standard. To achieve this, we constructed a machine learning model, trained on force plate data collected in participants with knee arthropathy and controls. This model was highly predictive of force plate data from a validation set (area under the receiver operating characteristics curve [auROC] = 0.86; area under the precision-recall curve [auPR] = 0.90) and of a separate, independent digital insole dataset containing control and knee osteoarthritis subjects (auROC = 0.83; auPR = 0.86). After showing that digital insole-derived gait characteristics are comparable to traditional gait measurements, we next showed that a single stride of raw sensor time-series data could be accurately assigned to each subject, highlighting that individuals using digital insoles can be identified by their gait characteristics. This work provides a framework for a promising alternative to traditional clinical gait analysis methods, adds to the growing body of knowledge regarding wearable technology analytical pipelines, and supports clinical development of at-home gait assessments, with the potential to improve the ease, frequency, and depth of patient monitoring.

Keywords: clinical AI/ML; data analysis; digital biomarkers; digital health technology; digital medicine; gait; human; medicine; neuroscience; wearables.

Plain language summary

The way we walk – our ‘gait’ – is a key indicator of health. Gait irregularities like limping, shuffling or a slow pace can be signs of muscle or joint problems. Assessing a patient’s gait is therefore an important element in diagnosing these conditions, and in evaluating whether treatments are working. Gait is often assessed via a simple visual inspection, with patients being asked to walk back and forth in a doctor’s office. While quick and easy, this approach is highly subjective and therefore imprecise. ‘Objective gait analysis’ is a more accurate alternative, but it relies on tests being conducted in specialised laboratories with large-scale, expensive equipment operated by highly trained staff. Unfortunately, this means that gait laboratories are not accessible for everyday clinical use. In response, Wipperman et al. aimed to develop a low-cost alternative to the complex equipment used in gait laboratories. To do this, they harnessed wearable sensor technologies – devices that can directly measure physiological data while embedded in clothing or attached to the user. Wearable sensors have the advantage of being cheap, easy to use, and able to provide clinically useful information without specially trained staff. Wipperman et al. analysed data from classic gait laboratory devices, as well as ‘digital insoles’ equipped with sensors that captured foot movements and pressure as participants walked. The analysis first ‘trained’ on data from gait laboratories (called force plates) and then applied the method to gait measurements obtained from digital insoles worn by either healthy participants or patients with knee problems. Analysis of the pressure data from the insoles confirmed that they could accurately predict which measurements were from healthy individuals, and which were from patients. The gait characteristics detected by the insoles were also comparable to lab-based measurements – in other words, the insoles provided similar type and quality of data as a gait laboratory. Further analysis revealed that information from just a single step could reveal additional information about the subject’s walking. These results support the use of wearable devices as a simple and relatively inexpensive way to measure gait in everyday clinical practice, without the need for specialised laboratories and visits to the doctor’s office. Although the digital insoles will require further analytical and clinical study before they can be widely used, Wipperman et al. hope they will eventually make monitoring muscle and joint conditions easier and more affordable.


Conflict of interest statement

MW, AL, KG, BL, SS, XW, JI, ML, BK, IS, MT, DD, AB, FW, WL, GH, JU, YP, GA, JH, SS, OL, AA, RA, SH, OH Employee and shareholder of Regeneron Pharmaceuticals, Inc

Figures

Figure 1.
Figure 1.. Overview of data sources and study participants, device types, data types, and clinical research questions.
(A) Three datasets were used for analyses. The GaitRec force plate dataset (force plate data) contains N = 211 controls, who walked at three different walking speeds (slow, comfortable, and fast), and N = 625 knee injury subjects, who walked at a comfortable walking speed (Horsak et al., 2020). The second dataset is from a digital insole pilot study, where N = 22 controls walked at three different walking speeds (slow, comfortable, and fast). The third dataset is from a digital insole sub-study from a longitudinal clinical trial in knee osteoarthritis (OA), where N = 40 knee OA subjects performed a 3 min walk test (3MWT) at a comfortable walking speed at baseline (pretreatment) and at day 85 (on treatment). (B) Both force plates and digital insoles produce data collected during stance and swing phases of a person’s gait cycle. (C) Types of data produced by these devices include vertical ground reaction force (vGRF), derived gait characteristics, and raw sensor time series. (D) Clinical research questions addressed in this work include the derivation of gait disease signatures of knee OA and investigation of the individuality and consistency of gait patterns. Two analytical methods were used to evaluate these data. Support vector machine (SVM) models were used to analyze vGRF, derived gait characteristics, and raw sensor time-series flattened stride data. A one-dimensional convolutional neural network (CNN) was used to analyze structured stride raw sensor time-series data.
Figure 2.
Figure 2.. Machine learning (ML) model trained on knee injury subjects walking on force plates accurately classifies osteoarthritis (OA) patients wearing digital insoles.
(A) Vertical ground reaction force (vGRF) curves derived from force plate and digital insole data for controls, and knee injury and knee OA patients, respectively. Left foot data are shown as mean of values (top panels) and mean of normalized z-scores (bottom panels) at each percent stance phase within each device and health status. Groups are color-coded as in (B) and (C). (B) vGRF curves for an individual’s left foot shown as heatmap rows, after data was z-transformed at each percent stance phase (as in A). Rows are hierarchically clustered within each group of subjects. (C) Uniform Manifold Approximation and Projection (UMAP) dimensionality reduction of the z-transformed left foot vGRF data. Each point represents a subject, and points are colored by phenotype, and shaped by device. (D) Schematic of machine learning model building of training/validation and testing sets. Two support vector machine (SVM) models were created, one for left knee injury (depicted) and one for right knee injury. The full force plate vGRF dataset with both controls (comfortable walking speed) and left or right knee injury subjects (comfortable walking speed, excluding subjects with knee injury on both joints) were split 85% into training/validation datasets, and 15% into a hold-out testing set. One model predicts control versus knee injury subjects using left foot data (of left knee injury subjects and all controls), and the other predicts using right foot data (of right knee injury subjects and all controls). These models were then applied on a separate, independent testing set of digital insoles vGRF data with N = 22 control subjects and N = 38 patients with knee OA. (E) Receiver operating characteristic curve for SVM classification of force plate (85%) cross-validation (CV, training/validation) set, force plate (15%) hold-out test set, and the digital insole test set. (F) Precision-recall curve for SVM classification of the same groups in (E).
Figure 2—figure supplement 1.
Figure 2—figure supplement 1.. Heatmap representation of vertical ground reaction force (vGRF) data from GaitRec dataset for all joints with injuries and controls (Horsak et al., 2020).
Data are z-scored by each column (% stance phase) across all walks. Heatmaps are separate by injury class (control, knee, calcaneus, hip, and ankle), and vGRF from each walk are unsupervised clustered within each category. The right of the heatmap annotates the joint side with the arthropathy (left joint, right joint, both joints, or no injury in the control group).
Figure 2—figure supplement 2.
Figure 2—figure supplement 2.. Variance explained in vertical ground reaction force (vGRF) with clinical and demographic characteristics of the participants.
Linear models were fit at each % stance phase (timepoint), excluding the edges of the curve which are bounded by 0 (and as such have no variance). We used disease (knee arthropathy or control), age, sex (male or female), and body weight as covariates in the model, with each subsequent vGRF % stance phase timepoint as the dependent variable. Within each linear model, using the sum of squares for each category compared to the total sum of squares, we calculated of the variance each component’s contribution to the total variance, with the residuals indicating the unexplained variance in these models. We observed that the disease state is the major contributor to vGRF for most of the curve, with age, sex, and body weight also explaining a smaller proportion of the variance.
Figure 2—figure supplement 3.
Figure 2—figure supplement 3.. Model results from the right foot only data.
(A) Schematic of machine learning model building of training/validation and testing sets with the right foot data, as in Figure 2. (B) Receiver operating characteristic curve for support vector machine (SVM) classification of force plate (85%) cross-validation (CV, training/validation) set, force plate (15%) hold-out test set, and the digital insole test set for right foot data. (C) Precision-recall curve for SVM classification of the same groups in (B) for right foot data.
Figure 2—figure supplement 4.
Figure 2—figure supplement 4.. Comparison between logistic regression, support vector machine, and XGBoost models.
(A) Force plate repeated cross-validation (CV) set with 85% of the training/validation data, force plate test set with 15% of the observations, and the Moticon digital insole independent test set (see ‘Methods’). We evaluated three models: logistic regression, support vector machine (SVM), and XGBoost modeling approaches, as well as SVM with shuffled labels for comparison. This was repeated 100 times. The top row shows the area under the curve for the precision-recall (top) and ROC (bottom) curves, plotted in a box-and-whisker plot. (B) Precision-recall curves for all three models. (C) ROC curves for all three models.
Figure 3.
Figure 3.. Derived gait characteristics from a digital insole measured across all subjects from the pilot study and knee osteoarthritis patients in the clinical trial.
(A) Schematic of raw sensor time-series data from a digital insole. Data can be processed from the device in three ways: (1) vertical ground reaction forces (Figure 1); (2) derived gait characteristics on force, spatio-temporal, and center of pressure aspects; and (3) raw sensor time-series data from the 50 sensors embedded across both insoles. Each segmented stride of raw sensor time-series data can be analyzed as is (structured strides) or collapsed (flattened strides). (B) The derived gait characteristics (parameters) of the digital insole from all individuals in the pilot study were correlated against each other at the comfortable walking speed. Spearman correlation coefficients were computed and shown in a correlation matrix ranging from –1 (perfect anti-correlation) to +1 (perfectly correlation). Each parameter has a Spearman correlation coefficient of +1 with itself (red diagonal). The parameter, the foot from which it was generated, and its category are labeled on the left of the correlation matrix. (C) Heatmap representation of the average of each of the 82 digital insole parameters (rows) across all walks for each patient (columns) from the pilot study. Parameter values are shown as normalized z-scores (bounded within ± 3), calculated across all participants, and walking speeds. The heatmap is split by the three walking speeds (slow, normal, fast), and columns are clustered within each walking speed using hierarchical clustering with Euclidean distances. The 14 parameters strongly correlated with walking speed are indicated on the right of the heatmap.
Figure 3—figure supplement 1.
Figure 3—figure supplement 1.. Derived gait characteristics that are most discriminative of knee osteoarthritis (OA) versus controls include features shown in Supplementary file 1.
Left: boxplots in knee OA, control slow, comfortable, and fast walking speeds for some parameters predictive of knee OA versus controls. Right: scatter plots of select parameters in control versus knee OA subjects at comfortable walking speed.
Figure 4.
Figure 4.. Different methods to analyze control subject versus knee osteoarthritis (OA) patient data from a digital insole enable refined classification of disease signatures.
(A) Principal component analysis (PCA) dimensionality reduction of vertical ground reaction force (vGRF) data from all walks of pilot study subjects and baseline walks of knee OA clinical trial patients. Each dot represents data from a single subject at a given walking speed. (B) PCA dimensionality reduction of derived gait characteristic data from the digital insole, without the 14 speed-correlated derived gait characteristics. (C) PCA dimensionality reduction of raw sensor time series of each stride from all walks. Each dot represents data from a single stride and repeat strides from the same participant are shown. (D) Receiver operating characteristic curves for knee OA versus control (both at comfortable walking speed) prediction using only walking speed (speed), derived gait characteristics (excluding 14 speed-correlated features), raw sensor time series, and vGRF. Classification metrics were derived using leave-one-out cross-validation (LOOCV). The single derived gait characteristic speed separates out digital insole knee OA patients versus control subjects. (E) Precision-recall curves of the same comparisons in (D). (F) Classification accuracy using raw sensor time-series data from control subjects versus knee OA patients using subsets or all 50 sensors at each timepoint of the stride (0–100% of the stride). Timepoints start with the stance phase of the right foot and swing phase of the left foot, and end with the swing phase of the right foot and the stance phase of the left foot. Classification accuracy of 1.0 indicates perfect knee OA versus control classification using data from that timepoint.
Figure 4—figure supplement 1.
Figure 4—figure supplement 1.. Evaluation of all speed-independent characteristics for OA vs control classification.
(A) Principal component analysis (PCA) of all derived gait characteristics measured using the Moticon insole device, where each point represents the average of all walks from a particular subject, and the dot color indicates the group (control or knee osteoarthritis [OA]) or walking speed of control subjects. (B) PCA as in (A), without the walking speed gait characteristic. (C) PCA as in (A), without the 14 derived gait characteristics correlated to walking speed. (D) Classification performance area under the receiver operating characteristics curve (auROC) using walking speed as a sole predictor, vertical ground reaction force (vGRF) data, derived gait characteristics, and time-series data. (E) Precision-recall curve for classification as in (D).
Figure 5.
Figure 5.. Latent convolutional neural net (CNN) representation of raw sensor time-series data from digital insoles: identifying subject-specific patterns of human gait.
(A) Pilot study subjects and knee osteoarthritis (OA) clinical trial patients were split 50:50 into training and testing sets, stratified by disease status, for the first CNN model investigating the individuality of gait patterns. (B) A CNN was trained on segmented structured strides from the digital insole in the training set, to predict from which subject the stride came. The activation of the last fully connected layer in the CNN consists of 60 features and represents the model’s latent representation of gait. (C) Uniform Manifold Approximation and Projection (UMAP) clustering of these 60 latent features for each stride captures the individuality of participants in both the training and testing sets. Each dot represents a single stride, colors represent each participant, and shapes represent participants’ health status (C = control). Intra- and inter-subject clustering and separation is greater in the training set, as expected, and is present in the testing set as well. (D) Distances (in arbitrary units) between each pair of walks (for derived gait parameters) or strides (for time series) from the testing set shown as heatmaps for each of the three methods (top panels). Subject of the walk/stride are color identified along the edge. Boxplot of mean distance of each walk/stride with other walk/strides from the same individual, and with walk/strides from other individuals separated by disease class (bottom panels). Distances are faceted by the disease class of the individual. A good representation has low distance for ‘with self’, and high distance for ‘with other’ classes.
Figure 5—figure supplement 1.
Figure 5—figure supplement 1.. Example heatmap of a good representation that has low distance between all pairs of walks/strides from the same participant and high distance between all pairs of walks/strides from different participants.
Color along the edge indicates each person.
Figure 6.
Figure 6.. Training across multiple days increases consistency of convolutional neural network (CNN) model latent representation.
(A) Knee osteoarthritis (OA) clinical trial participants were split 50:50 into training and testing sets containing both day 1 (baseline) and day 85 (on treatment) data, for the second CNN model investigating the consistency of gait patterns. (B) Distances (in arbitrary units) between pairs of strides in the latent representation from the consistency CNN model in the training and testing sets, shown as heatmaps. Strides from the same person are arranged next to each other, with strides from day 1 listed first then strides from day 85. Color along the edge indicates each person. (C) Boxplots of mean distance of each stride with other strides from the same person on the same day, from the same person on different days, and from other people, for both the individuality model (Figure 5) and consistency model (A–B). Distances are shown using the different models in both the training and testing sets.
Figure 6—figure supplement 1.
Figure 6—figure supplement 1.. Boxplots of mean distance (in arbitrary units) of each stride with other strides from the same person on different days for both the convolutional neural network (CNN) individuality model (Figure 5) and CNN consistency model (Figure 6A and B) in both the training and testing sets.
Values are replotted from Figure 6C, and lines are drawn between the same participants. Significance of difference in distances between the CNN individuality and consistency models was analyzed with paired t-tests.
Author response image 1.

Update of

  • doi: 10.1101/2022.10.05.22280750

References

    1. Alias M. Walking activity recognition with sEMG sensor array on thigh circumference using Convolutional neural network. International Conference 544 on Intelligent Systems Engineering (ICISE) IEEE.2018.
    1. Arslan YZ, Karabulut D, Ortes F, Popovic MB. In: Biomechatronics. Popovic MB, editor. Academic Press; 2019. 11 - Exoskeletons, Exomusculatures, Exosuits: dynamic modeling and simulation. - DOI
    1. Briouza S, Gritli H, Khraief N, Belghith S, Singh D. A Convolutional Neural Network-Based Architecture for EMG Signal Classification. 2021 International Conference on Data Analytics for Business and Industry (ICDABI; Sakheer, Bahrain. 2021. pp. 107–112. - DOI
    1. Celik Y, Stuart S, Woo WL, Sejdic E, Godfrey A. Multi-modal gait: a wearable, algorithm and data fusion approach for clinical and free-living assessment. Information Fusion. 2022;78:57–70. doi: 10.1016/j.inffus.2021.09.016. - DOI
    1. Chau T. A review of analytical techniques for gait data: part 1: fuzzy, statistical and fractal methods. Gait & Posture. 2001a;13:49–66. doi: 10.1016/s0966-6362(00)00094-1. - DOI - PubMed