The interplay between electron transport chain function and iron regulatory factors influences melanin formation in Cryptococcus neoformans
- PMID: 38687055
- PMCID: PMC11237718
- DOI: 10.1128/msphere.00250-24
The interplay between electron transport chain function and iron regulatory factors influences melanin formation in Cryptococcus neoformans
Abstract
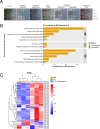
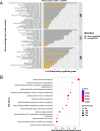
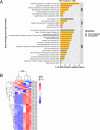
Mitochondrial functions are critical for the ability of the fungal pathogen Cryptococcus neoformans to cause disease. However, mechanistic connections between key functions such as the mitochondrial electron transport chain (ETC) and virulence factor elaboration have yet to be thoroughly characterized. Here, we observed that inhibition of ETC complex III suppressed melanin formation, a major virulence factor. This inhibition was partially overcome by defects in Cir1 or HapX, two transcription factors that regulate iron acquisition and use. In this regard, loss of Cir1 derepresses the expression of laccase genes as a potential mechanism to restore melanin, while HapX may condition melanin formation by controlling oxidative stress. We hypothesize that ETC dysfunction alters redox homeostasis to influence melanin formation. Consistent with this idea, inhibition of growth by hydrogen peroxide was exacerbated in the presence of the melanin substrate L-DOPA. In addition, loss of the mitochondrial chaperone Mrj1, which influences the activity of ETC complex III and reduces ROS accumulation, also partially overcame antimycin A inhibition of melanin. The phenotypic impact of mitochondrial dysfunction was consistent with RNA-Seq analyses of WT cells treated with antimycin A or L-DOPA, or cells lacking Cir1 that revealed influences on transcripts encoding mitochondrial functions (e.g., ETC components and proteins for Fe-S cluster assembly). Overall, these findings reveal mitochondria-nuclear communication via ROS and iron regulators to control virulence factor production in C. neoformans.IMPORTANCEThere is a growing appreciation of the importance of mitochondrial functions and iron homeostasis in the ability of fungal pathogens to sense the vertebrate host environment and cause disease. Many mitochondrial functions such as heme and iron-sulfur cluster biosynthesis, and the electron transport chain (ETC), are dependent on iron. Connections between factors that regulate iron homeostasis and mitochondrial activities are known in model yeasts and are emerging for fungal pathogens. In this study, we identified connections between iron regulatory transcription factors (e.g., Cir1 and HapX) and the activity of complex III of the ETC that influence the formation of melanin, a key virulence factor in the pathogenic fungus Cryptococcus neoformans. This fungus causes meningoencephalitis in immunocompromised people and is a major threat to the HIV/AIDS population. Thus, understanding how mitochondrial functions influence virulence may support new therapeutic approaches to combat diseases caused by C. neoformans and other fungi.
Keywords: RNA-Seq; electron transport chain; fungal pathogenesis; iron regulation; melanin formation; reactive oxygen species.
Conflict of interest statement
The authors declare no conflict of interest.
Figures


Update of
-
The interplay between electron transport chain function and iron regulatory factors influences melanin formation in Cryptococcus neoformans.bioRxiv [Preprint]. 2024 Feb 18:2024.02.15.580540. doi: 10.1101/2024.02.15.580540. bioRxiv. 2024. Update in: mSphere. 2024 May 29;9(5):e0025024. doi: 10.1128/msphere.00250-24. PMID: 38405941 Free PMC article. Updated. Preprint.
Similar articles
-
The interplay between electron transport chain function and iron regulatory factors influences melanin formation in Cryptococcus neoformans.bioRxiv [Preprint]. 2024 Feb 18:2024.02.15.580540. doi: 10.1101/2024.02.15.580540. bioRxiv. 2024. Update in: mSphere. 2024 May 29;9(5):e0025024. doi: 10.1128/msphere.00250-24. PMID: 38405941 Free PMC article. Updated. Preprint.
-
The Monothiol Glutaredoxin Grx4 Regulates Iron Homeostasis and Virulence in Cryptococcus neoformans.mBio. 2018 Dec 4;9(6):e02377-18. doi: 10.1128/mBio.02377-18. mBio. 2018. PMID: 30514787 Free PMC article.
-
A Transcriptional Regulatory Map of Iron Homeostasis Reveals a New Control Circuit for Capsule Formation in Cryptococcus neoformans.Genetics. 2020 Aug;215(4):1171-1189. doi: 10.1534/genetics.120.303270. Epub 2020 Jun 24. Genetics. 2020. PMID: 32580959 Free PMC article.
-
Coordinated regulation of iron metabolism in Cryptococcus neoformans by GATA and CCAAT transcription factors: connections with virulence.Curr Genet. 2021 Aug;67(4):583-593. doi: 10.1007/s00294-021-01172-5. Epub 2021 Mar 24. Curr Genet. 2021. PMID: 33760942 Free PMC article. Review.
-
Iron and fungal pathogenesis: a case study with Cryptococcus neoformans.Cell Microbiol. 2008 Feb;10(2):277-84. doi: 10.1111/j.1462-5822.2007.01077.x. Epub 2007 Nov 27. Cell Microbiol. 2008. PMID: 18042257 Review.
Cited by
-
Transcription Factors Fzc9 and Pdr802 Regulate ATP Levels and Metabolism in Cryptococcus neoformans.Int J Mol Sci. 2025 Feb 20;26(5):1824. doi: 10.3390/ijms26051824. Int J Mol Sci. 2025. PMID: 40076448 Free PMC article.
-
Puf4 -mediated oxidative stress virulence attenuation in Cryptococcus neoformans.Front Cell Infect Microbiol. 2025 Aug 11;15:1628448. doi: 10.3389/fcimb.2025.1628448. eCollection 2025. Front Cell Infect Microbiol. 2025. PMID: 40861481 Free PMC article.
-
Insight into the Mechanisms and Clinical Relevance of Antifungal Heteroresistance.J Fungi (Basel). 2025 Feb 13;11(2):143. doi: 10.3390/jof11020143. J Fungi (Basel). 2025. PMID: 39997437 Free PMC article. Review.
-
Evidence for the role of Irk2 and Irk5 in ATP and metabolism regulation in Cryptococcus neoformans.Front Cell Infect Microbiol. 2025 Jun 18;15:1600041. doi: 10.3389/fcimb.2025.1600041. eCollection 2025. Front Cell Infect Microbiol. 2025. PMID: 40606631 Free PMC article.
References
-
- Ma H, Hagen F, Stekel DJ, Johnston SA, Sionov E, Falk R, Polacheck I, Boekhout T, May RC. 2009. The fatal fungal outbreak on vancouver Island is characterized by enhanced intracellular parasitism driven by mitochondrial regulation. Proc Natl Acad Sci U S A 106:12980–12985. doi:10.1073/pnas.0902963106 - DOI - PMC - PubMed
MeSH terms
Substances
Grants and funding
LinkOut - more resources
Full Text Sources
Miscellaneous

