

Effect of probiotic administration during pregnancy on the functional diversity of the gut microbiota in healthy pregnant women
- PMID: 38687069
- PMCID: PMC11237737
- DOI: 10.1128/spectrum.00413-24
Effect of probiotic administration during pregnancy on the functional diversity of the gut microbiota in healthy pregnant women
Abstract
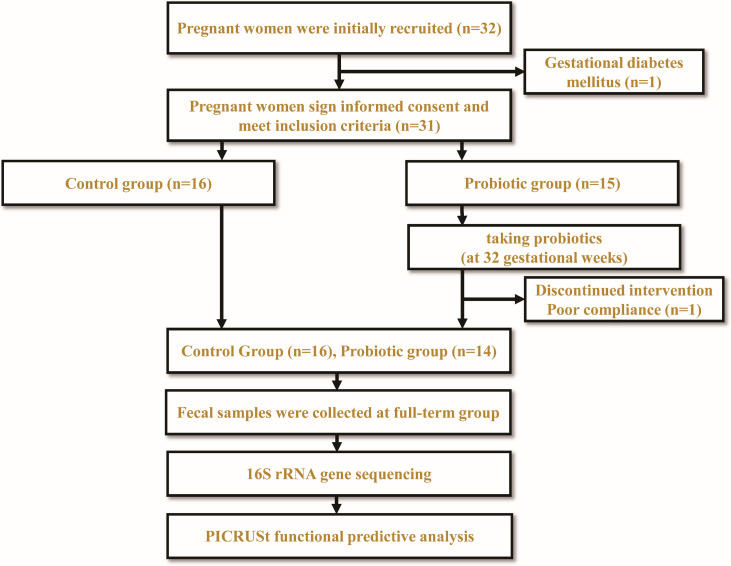
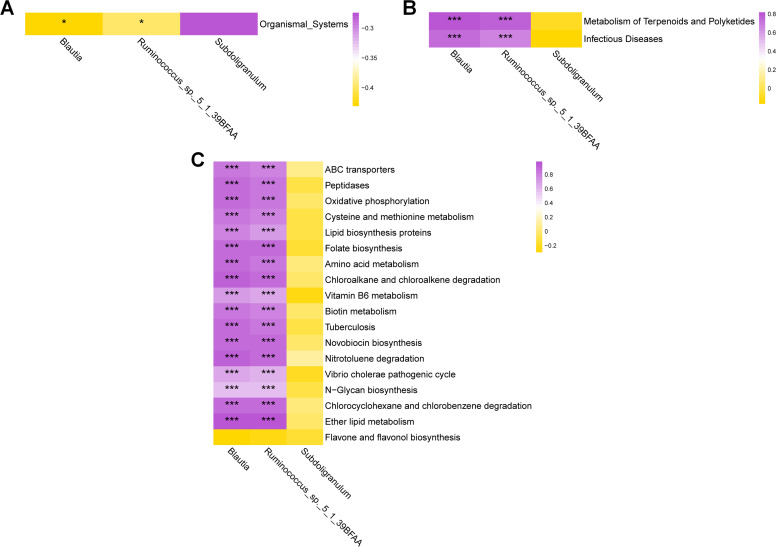
Our study aims to investigate the impact of probiotic consumption during pregnancy on gut microbiota functional diversity in healthy pregnant women. Thirty-two pregnant women were randomly assigned to two groups. The probiotic group (PG) consisted of pregnant women who consumed triple viable Bifidobacterium longum, Lactobacillus delbrueckii bulgaricus, and Streptococcus thermophilus tablets from the 32nd week of pregnancy until delivery. The functional profiles of the gut microbiota were predicted through high-throughput 16S rRNA sequencing results using PICRUSt software and referencing the Kyoto Encyclopedia of Genes and Genomes (KEGG) database. In the gut microbiota of the PG, the genera Blautia and Ruminococcus, as well as the species Subdoligranulum, showed significantly higher relative abundances compared to the control group (CG) (P < 0.05). At Level 1 of the KEGG signaling pathways, there was a significant reduction in the functional genes of the gut microbiota involved in Organismal Systems in the PG (P < 0.05). In Level 2 of the KEGG signaling pathways, there was a significant reduction in the functional genes of the gut microbiota involved in Infectious Disease in the PG (P < 0.05). In Level 3 of the KEGG signaling pathways, the PG exhibited a significant increase in the functional genes of the gut microbiota involved in ABC transporters, Oxidative phosphorylation, Folate biosynthesis, and Biotin metabolism (P < 0.05). The CG showed a significant increase in the functional genes related to Cysteine and methionine metabolism, Vitamin B6 metabolism, Tuberculosis, and Vibrio cholerae pathogenic cycle (P < 0.05). In conclusion, our findings suggest that probiotic supplementation during pregnancy has a significant impact on functional metabolism in healthy pregnant women.
Importance: Probiotics are considered beneficial to human health. There is limited understanding of how probiotic consumption during pregnancy affects the functional diversity of the gut microbiota. The aim of our study is to investigate the impact of probiotic consumption during pregnancy on the functional diversity of the gut microbiota. Our findings suggest that probiotic supplementation during pregnancy has a significant impact on functional metabolism. This could potentially open up new avenues for preventing various pregnancy-related complications. This also provides new insights into the effects of probiotic consumption during pregnancy on the gut microbiota and offers a convenient method for exploring the potential mechanisms underlying the impact of probiotics on the gut microbiota of pregnant women.
Keywords: functional prediction; gut microbiota; predictive metagenome profiling; pregnancy; probiotic.
Conflict of interest statement
The authors declare no conflict of interest.
Figures


Similar articles
-
Predictive analysis of the impact of probiotic administration during pregnancy on the functional pathways of the gut microbiome in healthy infants based on 16S rRNA gene sequencing.Gene. 2025 Jun 10;952:149414. doi: 10.1016/j.gene.2025.149414. Epub 2025 Mar 12. Gene. 2025. PMID: 40086705 Clinical Trial.
-
Probiotic Supplementation During Human Pregnancy Affects the Gut Microbiota and Immune Status.Front Cell Infect Microbiol. 2019 Jul 16;9:254. doi: 10.3389/fcimb.2019.00254. eCollection 2019. Front Cell Infect Microbiol. 2019. PMID: 31380297 Free PMC article.
-
Effect of Lactobacillus rhamnosus HN001 and Bifidobacterium longum BB536 on the healthy gut microbiota composition at phyla and species level: A preliminary study.World J Gastroenterol. 2017 Apr 21;23(15):2696-2704. doi: 10.3748/wjg.v23.i15.2696. World J Gastroenterol. 2017. PMID: 28487606 Free PMC article. Clinical Trial.
-
ILSI Europe perspective review: site-specific microbiota changes during pregnancy associated with biological consequences and clinical outcomes: opportunities for probiotic interventions.Gut Microbes. 2025 Dec;17(1):2501186. doi: 10.1080/19490976.2025.2501186. Epub 2025 May 21. Gut Microbes. 2025. PMID: 40397816 Free PMC article. Review.
-
A Review of Probiotic Intervention Targets in Diseases: Unveiling Mechanisms and Providing Insights toward Engineering Strategies.J Agric Food Chem. 2025 Jun 11;73(23):14176-14191. doi: 10.1021/acs.jafc.5c03008. Epub 2025 Jun 1. J Agric Food Chem. 2025. PMID: 40452150 Review.
Cited by
-
Exploring the Immunological Role of the Microbial Composition of the Appendix and the Associated Risks of Appendectomies.J Pers Med. 2025 Mar 14;15(3):112. doi: 10.3390/jpm15030112. J Pers Med. 2025. PMID: 40137428 Free PMC article. Review.
-
Related differences in fecal bacteria of Chinese northern pregnant women of different ages: associations with maternal clinical indicators and neonatal outcomes.Front Microbiol. 2025 Jul 18;16:1642516. doi: 10.3389/fmicb.2025.1642516. eCollection 2025. Front Microbiol. 2025. PMID: 40756211 Free PMC article.
-
Chronological dynamics of the gut microbiome in response to the pasture grazing system in geese.Microbiol Spectr. 2024 Oct 3;12(10):e0418823. doi: 10.1128/spectrum.04188-23. Epub 2024 Aug 27. Microbiol Spectr. 2024. PMID: 39189756 Free PMC article.
-
The Influences of Oral Probiotics on the Immunometabolic Response During Pregnancy and Lactation: A Systematic Review.Nutrients. 2025 Apr 30;17(9):1535. doi: 10.3390/nu17091535. Nutrients. 2025. PMID: 40362845 Free PMC article.
References
-
- Hill C, Guarner F, Reid G, Gibson GR, Merenstein DJ, Pot B, Morelli L, Canani RB, Flint HJ, Salminen S, Calder PC, Sanders ME. 2014. Expert consensus document. the international scientific association for probiotics and prebiotics consensus statement on the scope and appropriate use of the term probiotic. Nat Rev Gastroenterol Hepatol 11:506–514. doi:10.1038/nrgastro.2014.66 - DOI - PubMed
Publication types
MeSH terms
Substances
Grants and funding
LinkOut - more resources
Full Text Sources
