. 2024 Aug;23(8):e14184.
doi: 10.1111/acel.14184. Epub 2024 Apr 30.

PAR2-mediated cellular senescence promotes inflammation and fibrosis in aging and chronic kidney disease

Affiliations

PAR2-mediated cellular senescence promotes inflammation and fibrosis in aging and chronic kidney disease

Sugyeong Ha et al. Aging Cell. 2024 Aug.

Abstract

Cellular senescence contributes to inflammatory kidney disease via the secretion of inflammatory and profibrotic factors. Protease-activating receptor 2 (PAR2) is a key regulator of inflammation in kidney diseases. However, the relationship between PAR2 and cellular senescence in kidney disease has not yet been described. In this study, we found that PAR2-mediated metabolic changes in renal tubular epithelial cells induced cellular senescence and increased inflammatory responses. Using an aging and renal injury model, PAR2 expression was shown to be associated with cellular senescence. Under in vitro conditions in NRK52E cells, PAR2 activation induces tubular epithelial cell senescence and senescent cells showed defective fatty acid oxidation (FAO). Cpt1α inhibition showed similar senescent phenotype in the cells, implicating the important role of defective FAO in senescence. Finally, we subjected mice lacking PAR2 to aging and renal injury. PAR2-deficient kidneys are protected from adenine- and cisplatin-induced renal fibrosis and injury, respectively, by reducing senescence and inflammation. Moreover, kidneys lacking PAR2 exhibited reduced numbers of senescent cells and inflammation during aging. These findings offer fresh insights into the mechanisms underlying renal senescence and indicate that targeting PAR2 or FAO may be a promising therapeutic approach for managing kidney injury.

Keywords: PAR2; SASP; aging; fatty acid oxidation; fibrosis; inflammation; senescence.


Conflict of interest statement

The authors have declared that no conflict of interest exists.

Figures
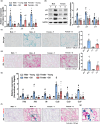
FIGURE 1
FIGURE 1
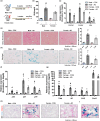
Tubule cell senescence is associated with increased renal injury in aged rat kidney. (a) Relative mRNA expression of p16, p21, and p53. #p < 0.05 versus male young rats. *p < 0.05 versus male aged rats. $p < 0.05 versus female young rats. (b) Representative western blots showing the renal expression of p16, p21, and p53 in four groups. GAPDH was used as internal control. Relative protein expressions were quantified using densitometry. #p < 0.05 versus male young rats. *p < 0.05 versus male aged rats. (c) Representative images of renal SA‐β‐gal staining in different groups. The area positive for SA‐β‐gal staining were quantified for each group. #p < 0.05 versus male young rats. *p < 0.05 versus male aged rats. $p < 0.05 versus female young rats. (d) Representative ISH images of p21 (red) gene in four groups. The area positive for ISH staining were quantified for each group. #p < 0.05 versus male young rats. *p < 0.05 versus male aged rats. $p < 0.05 versus female young rats. (e) Relative mRNA expression of Tnfa, Il6, Il1b, Ccl2, Ccl3, and Ccl7. #p < 0.05 versus male young rats. *p < 0.05 versus male aged rats. $p < 0.05 versus female young rats. (f) Representative dual‐ISH images of Ccl2 (green) and Cdkn1a (red) genes in different groups. (g) Magnified image of dual‐ISH staining from male aged rats. Arrows highlight cells positive for both Ccl2 (green) and Cdkn1a (red).
FIGURE 2
FIGURE 2
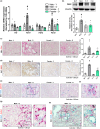
Fibrotic response is severe in male mouse kidneys and is associated with increased epithelial senescence. (a) Study design of 0.25% adenine diet (AD)‐fed kidney fibrosis‐inducing experiments in male and female mice. (b) Changes of BUN in four different groups. #p < 0.05 compared with male control group. *p < 0.05 compared with male AD‐fed group. (c) Relative mRNA expression of Col1a2, Col3a1, and Vim. #p < 0.05 compared with male control group. *p < 0.05 compared with male AD‐fed group. (d) Representative images of SR staining in the kidney sections of different groups. The area positive for SR staining were quantified for each group. #p < 0.05 versus male control group. *p < 0.05 versus male AD group. (e) Representative staining images show SA‐β‐gal activity in the kidney sections of different groups. The area positive for SA‐β‐gal staining were quantified for each group. #p < 0.05 versus male control group. *p < 0.05 versus male AD group. (f) Relative mRNA expressions of senescence markers including p16, p21, and p53. #p < 0.05 compared with male control group. *p < 0.05 compared with male AD‐fed group. (g) Relative mRNA expressions of SASP‐related genes (Tnfa, Il6, Ccl2, and Cxcl1). #p < 0.05 compared with male control group. *p < 0.05 compared with male AD‐fed group. (h) Representative dual‐ISH staining images of Ccl2 (green) and p21 (red) genes in different groups. (i) Magnified image of dual‐ISH staining from male AD‐treated mice. Arrows highlight cells positive for both Ccl2 (green) and Cdkn1a (red).
FIGURE 3
FIGURE 3
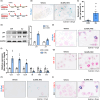
PAR2 expression is associated with cellular senescence and inflammation in fibrotic kidney. (a) Relative mRNA expression of F2r, F2rl1, F2rl2, and F2rl3. #p < 0.05 versus male young rats. *p < 0.05 versus male aged rats. (b) Renal protein expression levels of PAR2 were detected using western blotting in different groups. β‐Actin was used as internal control. Relative PAR2 expressions were quantified using densitometry. #p < 0.05 versus male young rats. *p < 0.05 versus male aged rats. (c) Representative ISH images of F2rl1 (red) gene in the kidney sections of four groups. The area positive for ISH staining were quantified for each group. #p < 0.05 versus male young rats. *p < 0.05 versus male aged rats. $p < 0.05 versus female young rats. (d) Representative images of kidney sections immunostained with PAR2 antibody in different groups. The area positive for IHC staining were quantified for each group. #p < 0.05 versus male young rats. *p < 0.05 versus male aged rats. $p < 0.05 versus female young rats. (e) Representative dual‐ISH images of F2rl1 (green) and p21 (red) genes in different groups. (f) Magnified image of dual‐ISH staining from male aged rats. Arrows highlight cells positive for both F2rl1 (green) and Cdkn1a (red). (g) Representative dual‐ISH staining images of F2rl1 (green) and Col1a1 (red) genes in male aged rat kidneys. (h) Representative dual‐ISH staining images of F2rl1 (green) and Emr1 (red) genes in male aged rat kidneys.
FIGURE 4
FIGURE 4
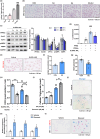
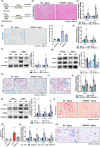
PAR2 activation promotes senescence and enhances chemokine expression in renal epithelial cells. (a) NRK52E renal epithelial cells were subjected to a triple treatment regimen with 150 μM SLIGRL‐NH2 (SLI), administered at 24‐h intervals, for a total duration of 72 h. Control cells were treated with vehicle for 72 h. (b) Representative images of SA‐β‐gal staining with or without PAR2 activation. (c) Quantification of SA‐β‐gal positive cells in cells with or without PAR2 activation. **p < 0.01 versus control group. (d) Western blots show protein levels of p53 and p21 with or without PAR2 activation. GAPDH was used as internal control. Relative protein expressions were quantified using densitometry. *p < 0.05 versus control group. (e) Representative images of double staining with Cdkn1a ISH staining and followed by SA‐β‐gal staining. (f) Relative mRNA expression of Ccl2, Ccl7, Cxcl1, Il8, Tnfa, and Il1b in NRK52E cells. *p < 0.01 versus control group. (g) Representative ISH images stained with Ccl2 (red) probe in the cells. (h) Representative pictures of double staining with Ccl2 ISH staining and followed SA‐β‐gal staining. (i) Representative dual ISH staining images of Ccl2 (green) and Cdkn1a (red) gene in the cells.
FIGURE 5
FIGURE 5
PAR2‐mediated cellular senescence is associated with defective fatty acid oxidation. (a) Cellular triglyceride contents were quantified in NRK52E cells treated with 150 μM of SLIGRL‐NH2 (SLI) or/and 50 μM of oleic acid (OA). *p < 0.05 and ***p < 0.001 versus control group. ###p < 0.001 versus OA‐treated group. (b) Lipid accumulation was visualized by Oil red O staining in NRK52E cells treated with SLI (150 μM) or/and OA (50 μM). (c) Protein levels of PPARα, Acox1, Cpt1α, phosphorylated AMPK, and AMPK were measured using western blotting in SLI‐treated cells. Relative protein expressions were quantified using densitometry. *p < 0.05 versus control group. (d) NRK52E cells were transfected with PPARα and PPRE plasmid for 24 h, followed by treatment with SLIGRL‐NH2. PPARα activity was measured using PPRE luciferase activity. ###p < 0.001 versus PPRE‐transfected group. *p < 0.05 versus PPRE + PPARα‐transfected group. (e) Representative ISH images stained with Cpt1a (red) probe in the cells. (f) The level of lactate in NRK52E cells was quantified with or without PAR2 activation. *p < 0.01 versus control group. (g) Cellular oxygen consumption rates (OCR) were measured using Seahorse systems under PAR2‐activated condition. **p < 0.01 versus control group. (h) OCR were measured using Seahorse systems under PAR2‐activated condition with or without Rotenone and Antimycin A treatment. #p < 0.05 versus control group. ***p < 0.001 between two groups. (i) Cellular triglyceride contents were quantified in NRK52E cells treated at designated conditions. **p < 0.01 between two groups. #p < 0.05 versus control group. (j) Representative images of SA‐β‐gal staining under etomoxir‐treated condition. (k) Relative mRNA expression of chemokines (Ccl2, Ccl7, and Cxcl1) in NRK52E cells treated with or without Etomoxir. *p < 0.01 versus vehicle group (l) *p < 0.01 versus vehicle group. Representative dual ISH images of Ccl2 (green) and Cdkn1a (red) genes under etomoxir‐treated condition.
FIGURE 6
FIGURE 6
PAR2 deficiency alleviates age‐related cellular senescence and fibrosis in mice. (a) Experimental scheme for PAR2 KO aging experiments. (b) Representative H&E staining images of mouse kidney samples from different groups. (c) Relative mRNA expression of Havcr1 (Hepatitis A virus cellular receptor1) and Lcn2 (Lipocalin 2). #p < 0.05 compared with young WT group. *p < 0.05 compared with aged WT group. (d) Representative images showing SA‐β‐gal activity in the kidney sections. The area positive for SA‐β‐gal staining were quantified for each group. #p < 0.05 versus WT young mice. *p < 0.05 versus WT aged mice. (e) Relative mRNA expression of p16 and p21. #p < 0.05 compared with young WT group. *p < 0.05 compared with aged WT group. (f) The protein expression of p21 and p53 were detected using western blotting in the kidneys of different groups. α‐tubulin was used as internal control. Relative protein expressions were quantified using densitometry. #p < 0.05 versus WT young mice. *p < 0.05 versus WT aged mice. (g) Renal protein expression of ACOX1 and CPT1α were detected using western blotting in different groups. α‐tubulin was used as internal control. Relative protein expressions were quantified using densitometry. #p < 0.05 versus WT young mice. *p < 0.05 versus WT aged mice. (h) Representative dual‐ISH images of Cpt1a (green) and Cdkn1a (red) genes in two groups. (i) Magnified image of dual‐ISH staining from WT aged mice. (j) Relative mRNA expression of Col1a2 and Vim. #p < 0.05 compared with young WT group. *p < 0.05 compared with aged WT group. (k) Protein levels of Col1, Vimentin, and α‐SMA were detected using western blotting in the kidneys. α‐tubulin was used as internal control. Relative protein expressions were quantified using densitometry. #p < 0.05 versus WT young mice. *p < 0.05 versus WT aged mice. (l) Representative images of SR staining of kidney sections. (m) Quantification of fibrosis extent detected by Sirius red staining using ImageJ. #p < 0.05 compared with young WT group. *p < 0.05 compared with aged WT group. (n) Relative mRNA expression of Ccl2, Ccl3, Cxcl1, and Cd68. #p < 0.05 compared with young WT group. *p < 0.05 compared with aged WT group. (o) Representative image of dual ISH staining images of Ccl2 (green) and Cdkn1a (red) genes in two groups.

References

    1. Albertus, P. , Morgenstern, H. , Robinson, B. , & Saran, R. (2016). Risk of ESRD in the United States. American Journal of Kidney Diseases, 68(6), 862–872. 10.1053/j.ajkd.2016.05.030 - DOI - PMC - PubMed
    1. Baraibar, M. A. , Hyzewicz, J. , Rogowska‐Wrzesinska, A. , Bulteau, A. L. , Prip‐Buus, C. , Butler‐Browne, G. , & Friguet, B. (2016). Impaired energy metabolism of senescent muscle satellite cells is associated with oxidative modifications of glycolytic enzymes. Aging (Albany NY), 8(12), 3375–3389. 10.18632/aging.101126 - DOI - PMC - PubMed
    1. Carrero, J. J. , Hecking, M. , Chesnaye, N. C. , & Jager, K. J. (2018). Sex and gender disparities in the epidemiology and outcomes of chronic kidney disease. Nature Reviews. Nephrology, 14(3), 151–164. 10.1038/nrneph.2017.181 - DOI - PubMed
    1. Chen, C. , Qiu, R. , Yang, J. , Zhang, Q. , Sun, G. , Gao, X. , Hei, Z. , & Ji, H. (2021). Lipoxin A4 restores septic renal function via blocking crosstalk between inflammation and premature senescence. Frontiers in Immunology, 12, 637753. 10.3389/fimmu.2021.637753 - DOI - PMC - PubMed
    1. Chen, P. , Zhang, Q. , Zhang, H. , Gao, Y. , Zhou, Y. , Chen, Y. , Guan, L. , Jiao, T. , Zhao, Y. , Huang, M. , & Bi, H. (2021). Carnitine palmitoyltransferase 1C reverses cellular senescence of MRC‐5 fibroblasts via regulating lipid accumulation and mitochondrial function. Journal of Cellular Physiology, 236(2), 958–970. 10.1002/jcp.29906 - DOI - PubMed

LinkOut - more resources