

Longitudinal Evaluation of Severe Acute Respiratory Syndrome Coronavirus 2 T-Cell Immunity Over 2 Years Following Vaccination and Infection
- PMID: 38687181
- PMCID: PMC11420770
- DOI: 10.1093/infdis/jiae215
Longitudinal Evaluation of Severe Acute Respiratory Syndrome Coronavirus 2 T-Cell Immunity Over 2 Years Following Vaccination and Infection
Abstract
Background: Within a year of the severe acute respiratory syndrome coronavirus 2 (SARS-CoV-2) pandemic, vaccines inducing a robust humoral and cellular immune response were implemented worldwide. However, emergence of novel variants and waning vaccine-induced immunity led to implementation of additional vaccine boosters.
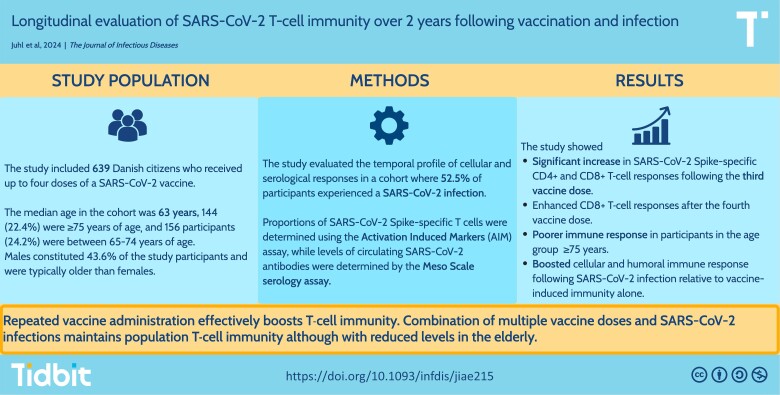
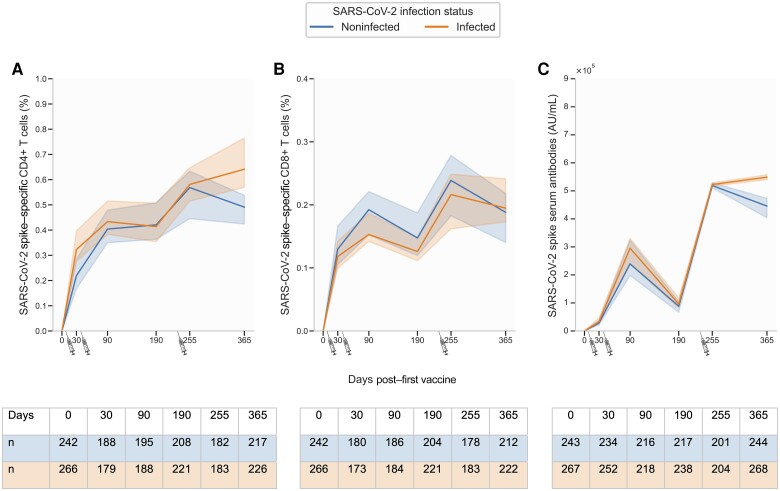
Methods: This prospective study evaluated the temporal profile of cellular and serological responses in a cohort of 639 SARS-CoV-2-vaccinated participants, of whom a large proportion experienced a SARS-CoV-2 infection. All participants were infection naïve at the time of their first vaccine dose. Proportions of SARS-CoV-2 spike-specific T cells were determined after each vaccine dose using the activation-induced marker assay, while levels of circulating SARS-CoV-2 antibodies were determined by the Meso Scale serology assay.
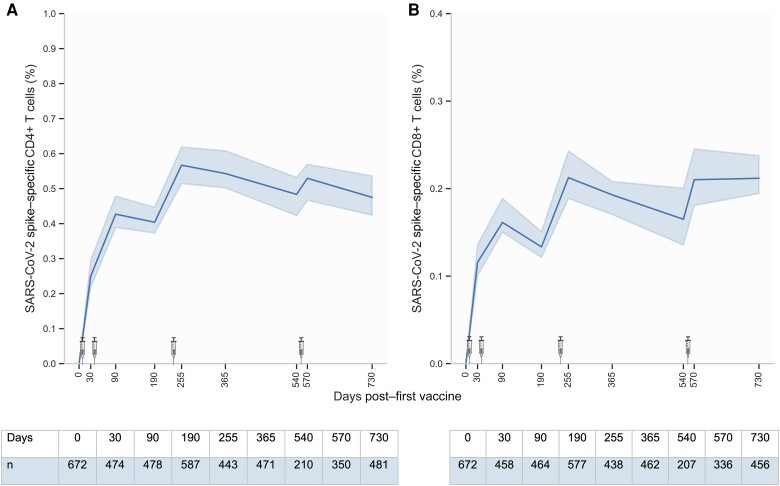
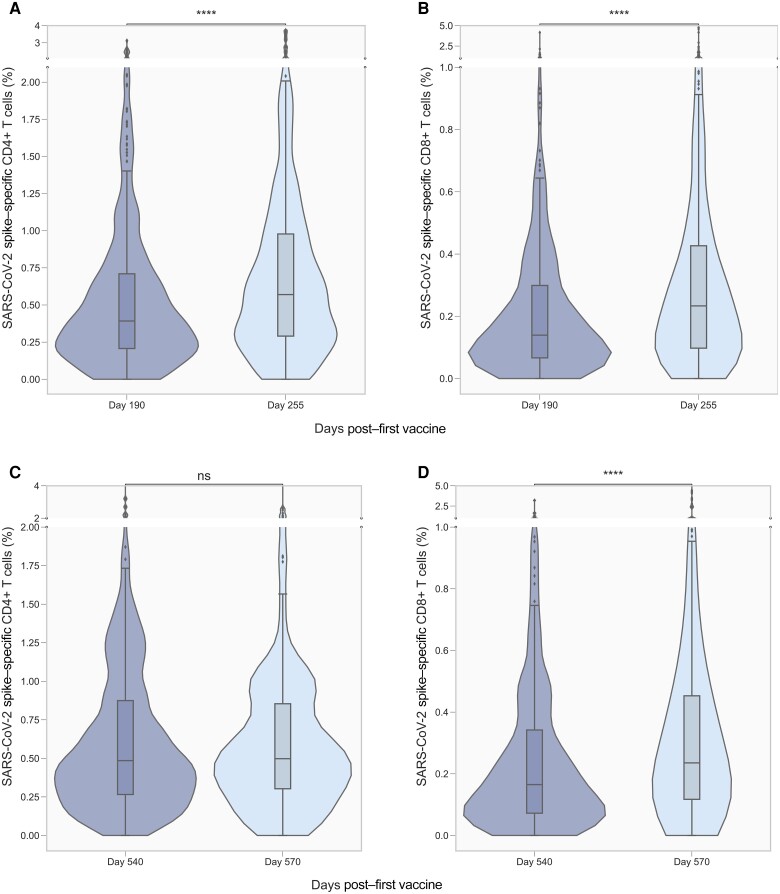
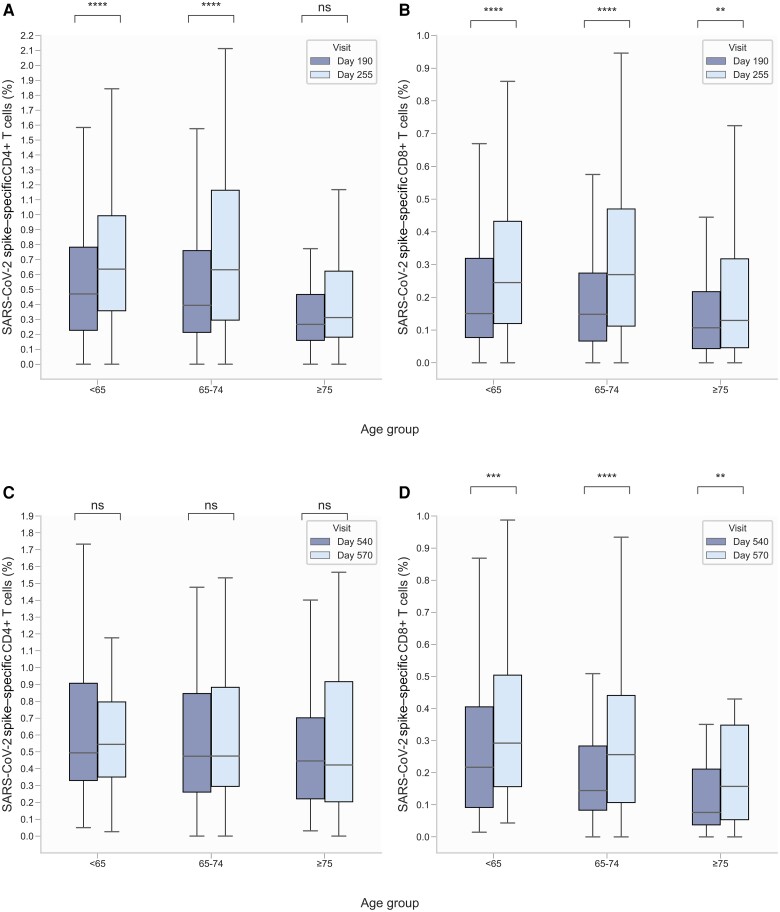
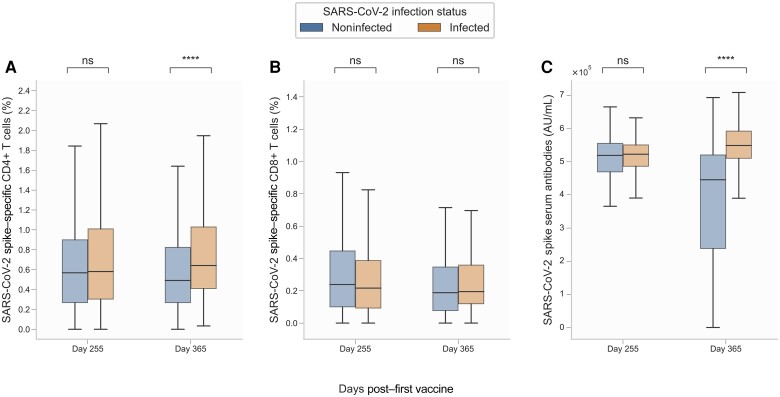
Results: We found a significant increase in SARS-CoV-2 spike-specific CD4+ and CD8+ T-cell responses following the third dose of a SARS-CoV-2 messenger RNA vaccine as well as enhanced CD8+ T-cell responses after the fourth dose. Furthermore, increased age was associated with a poorer response. Finally, we observed that SARS-CoV-2 infection boosts both the cellular and humoral immune response, relative to vaccine-induced immunity alone.
Conclusions: Our findings highlight the boosting effect on T-cell immunity of repeated vaccine administration. The combination of multiple vaccine doses and SARS-CoV-2 infections maintains population T-cell immunity, although with reduced levels in the elderly.
Keywords: COVID-19; Spike-specific T cells; cellular response; hybrid immunity; longitudinal study; vaccination.
© The Author(s) 2024. Published by Oxford University Press on behalf of Infectious Diseases Society of America.
Conflict of interest statement
Potential conflicts of interest . T. B. reports the following grants from the past 36 months: unrestricted grant to his institution from Novo Nordisk Foundation, Simonsen Foundation, Lundbeck Foundation, Kai Foundation, Erik and Susanna Olesen’s Charitable Fund; unrestricted grant to his institution, principal investigator [PI]/clinical trial, advisory board from Pfizer, MSD, GSK, and Gilead Sciences; and grant for PI/clinical trial from Boehringer Ingelheim, Roche, Novartis, Kancera AB, Janssen, and AstraZeneca. T. B. is board member in Pentabase; serves on advisory boards for Janssen and AstraZeneca; and reports receiving payment or honoraria for lectures at GSK, Pfizer, Gilead Sciences, Boehringer Ingelheim, AbbVie, and AstraZeneca. L. W. M. reports receiving travel support from AbbVie in September 2023. N. B. S. reports receiving funding from Danish Ministry of Health for the manuscript and consulting fees on study regarding respiratory syncytial virus from Pfizer and serving as PI in clinical studies sponsored by Pfizer, Bavarian Nordic, Moderna, and AstraZeneca. O. S. S. reports receiving funding from Danish Ministry of Health for the manuscript and consulting fees from UNION therapeutics and participation on a data and safety monitoring board or advisory board with Immunocore, ViiV Healthcare, and Gilead. M.T. reports funding from Danish Ministry of Health for the manuscript. All other authors report no conflicts of interest. All authors have submitted the ICMJE Form for Disclosure of Potential Conflicts of Interest. Conflicts that the editors consider relevant to the content of the manuscript have been disclosed.
Figures
References
-
- Emborg H-D, Valentiner-Branth P, Schelde AB, et al. . Vaccine effectiveness of the BNT162b2 mRNA COVID-19 vaccine against RT-PCR confirmed SARS-CoV-2 infections, hospitalisations and mortality in prioritised risk groups. medRxiv [Preprint]. Posted online 2 June 2021. doi:10.1101/2021.05.27.21257583 - DOI
MeSH terms
Substances
Grants and funding
LinkOut - more resources
Full Text Sources
Medical
Research Materials
Miscellaneous
