Review
. 2024 May 8;124(9):5930-6050.
doi: 10.1021/acs.chemrev.3c00840. Epub 2024 Apr 30.

Optical Phenomena in Molecule-Based Magnetic Materials

Affiliations
Review

Optical Phenomena in Molecule-Based Magnetic Materials

Jakub J Zakrzewski et al. Chem Rev. .

Abstract

Since the last century, we have witnessed the development of molecular magnetism which deals with magnetic materials based on molecular species, i.e., organic radicals and metal complexes. Among them, the broadest attention was devoted to molecule-based ferro-/ferrimagnets, spin transition materials, including those exploring electron transfer, molecular nanomagnets, such as single-molecule magnets (SMMs), molecular qubits, and stimuli-responsive magnetic materials. Their physical properties open the application horizons in sensors, data storage, spintronics, and quantum computation. It was found that various optical phenomena, such as thermochromism, photoswitching of magnetic and optical characteristics, luminescence, nonlinear optical and chiroptical effects, as well as optical responsivity to external stimuli, can be implemented into molecule-based magnetic materials. Moreover, the fruitful interactions of these optical effects with magnetism in molecule-based materials can provide new physical cross-effects and multifunctionality, enriching the applications in optical, electronic, and magnetic devices. This Review aims to show the scope of optical phenomena generated in molecule-based magnetic materials, including the recent advances in such areas as high-temperature photomagnetism, optical thermometry utilizing SMMs, optical addressability of molecular qubits, magneto-chiral dichroism, and opto-magneto-electric multifunctionality. These findings are discussed in the context of the types of optical phenomena accessible for various classes of molecule-based magnetic materials.


Conflict of interest statement

The authors declare no competing financial interest.

Figures
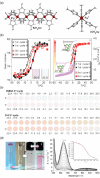
Figure 1
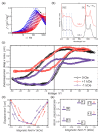
Figure 1
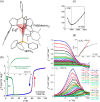
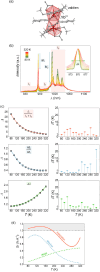
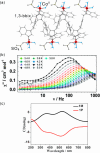
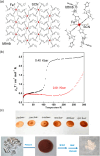
Representative structural fragments of [FeII(NH2trz)3](NO3)2·2H2O (NH2trz = 4-amino-4H-1,2,4-triazole) coordination polymers (a), thermal variation of the color intensity of the analogous chains with BF4 ions, depicted by green channel histogram modification and shown together with the thermal hysteresis loops of the χMT product (b), the series of photos for the thermochromic behavior of the BF4-containing compound dispersed in the PMMA polymer and polyurethane hydrogel D-6 (C = cooling, H = heating) (c), and the photos of high- and low-temperature phases of the analogous chains with tosylate counter-ions obtained as the gel and the colloidal suspension of nanoparticles, shown together the related variable temperature absorption spectra and the thermal dependence of the absorbance at 540 nm (d). Parts (b) and (c) were reproduced from ref (306) with permission from the Royal Society of Chemistry. Part (d) was reproduced from ref (307) with permission from the Royal Society of Chemistry.
Figure 2
Figure 2
The structural views on {[FeII(dpsme)][PtII(CN)4]}·2/3(dpsme)·xEtOH·yH2O (dpsme = 4,4′-di(pyridylthio)methane) coordination framework (a), shown with the temperature dependence of the χMT product (b) and photos of the powder sample at indicated temperatures (c), the structure of {FeII9(MeOH)8[ReV(CN)8]6}·10MeOH coordination cluster (d), shown with the temperature dependences of the χMT product and the χM–1 value (e) and photos of the selected single crystal at indicated temperatures (f), the structural view on [MnIII(5-MeO-sal-N-1-5-8-12)]Cl (5-MeO-sal-N-1-5-8-12 = a Schiff base ligand derived from 5-methoxysalicyl-aldehyde and N,N′-bis(3-aminopropyl)ethylenediamine) molecular material (g), presented with the temperature dependence of its magnetic moment (h) and photos of the selected single crystal at indicated temperatures (i), the structure of [CrII(ddpd)2](BF4)2 (ddpd = N,N′-dimethyl-N,N′-dipyridine-2-yl-pyridine-2,6-diamine) molecular material (j), shown together with the temperature dependence of the χMT product (k) and the photos of the acetonitrile solution of this Cr(II) complex at indicated temperatures (l). Parts (b) and (c) were adapted with permission from ref (315). Copyright 2012 John Wiley & Sons. Parts (e) and (f) were adapted with permission from ref (322). Copyright 2015 John Wiley & Sons. Parts (h) and (i) were reproduced from ref (331) with permission from the Royal Society of Chemistry. Parts (k) and (l) were adapted with permission from ref (334). Copyright 2020 John Wiley & Sons.
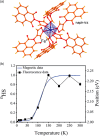
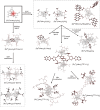
Figure 3
Figure 3
The structure of {[FeII(NCS)(py)]2(bpypz)2} (bpypz = 3,5-bis(2-pyridyl)pyrazolate; py = pyridine) molecules (a), the temperature dependence of magnetic moment for the NCSe-analog, shown with the calculated hysteresis loop (blue line) (b), the related optical microscopy snapshots of the crystal along the course of the thermal hysteresis (c), and the temperature dependence of the HS fraction derived from optical density analysis (d). Part (b) was reproduced with permission from ref (340). Copyright 2013 American Physical Society. Parts (c) and (d) were adapted with permission from ref (343). Copyright 2018 American Chemical Society.
Figure 4
Figure 4
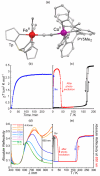
The structure of {[(pzTp)FeIII(CN)3]4[CoII(pz)3CCH2OH]4}(ClO4)4·13dmf·4H2O (pzTp = tetrapyrazolylborate; (pz)3CCH2OH = tris-2,2,2-(1-pyrazoyl)ethanol) molecular cube (a), shown with its temperature dependence of the χMT product, including also the results of a photomagnetic experiment with white light (b), and surface light absorption spectra at three indicated temperatures (c), the structure of {[CoII2FeIII2(CN)6(Tp*)2(dtbbpy)4]}(PF6)2·2MeOH (Tp* = hydrotris(3,5-dimethylpyrazol-1-yl)borate, dtbbpy = 4,4′-di-tert-butyl-2,2′-bipyridine) molecular square (d), presented with its temperature dependence of the χMT product, including also the curve after photoirradiation at low temperatures (e), and temperature-variable UV–vis-NIR absorption spectra, together with the temperature dependence of the [CoII,HS2FeIII,LS2] fraction estimated by the analyses of the temperature variable absorption intensity at 770 nm (f). Parts (b) and (c) were adapted with permission from ref (51). Copyright 2008 American Chemical Society. Parts (e) and (f) were adapted with permission from ref (358). Copyright 2011 American Chemical Society.
Figure 5
Figure 5
The structure of CsI0.1(H5O2)0.9{[CoII(4-Brpy)2.3][WV(CN)8]} (4-Brpy = 4-bromo-pyridine) layered coordination polymer (a), its thermal hysteresis loop on the temperature dependence of the χMT product (b), and the related thermal changes in the UV–vis-NIR absorption spectra shown together with the temperature dependence of the absorbance at 760 nm and the photos of the high- (HT) and low-temperature (LT) phases of the material (c). Parts (b) and (c) were reproduced from ref (377) with permission from the Royal Society of Chemistry.
Figure 6
Figure 6
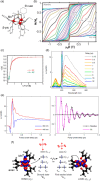
The molecular structure of [FeII(n-Bu-im)3(tren)](PF6)2 ((n-Bu-im)3(tren) = n-butyl-imidazoltris(2-ethylamino)amine) coordination system (a), its temperature dependence of the χMT product, measured at the rate of 4 K min–1 (upper part) and 0.1 K min–1 (bottom part), presented together with the χMT(T) curves for the photogenerated at 10 K LIESST phases (b), temperature-variable time evolution of the high-spin Fe(II) fraction, γHS, photogenerated within the LIESST effect at 10 K (c), and the comparison between the time evolution of γHS at 80 K for the samples irradiated at 10 K and at 80 K (d). Part (b) was adapted with permission from ref (454). Copyright 2013 John Wiley & Sons. Parts (c) and (d) were adapted with permission from ref (455). Copyright 2018 American Chemical Society.
Figure 7
Figure 7
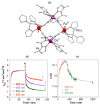
The structural views on {[FeII(tmphen)2]4[MoIV(CN)8]2}·solv (tmphen = 3,4,7,8–tetramethyl-1,10-phenanthroline; solv = crystallization solvent, MeOH/H2O) hexanuclear coordination cluster (a), the temperature dependence of the χMT product, shown together with the comparison between the χMT(T) curves collected before irradiation and in different parts of the photomagnetic experimental sequence shown on the right (c), and the schematic representation of the site-selective photoswitching effect (d). Parts (b), (c), and (d) were adapted with permission from ref (466). Copyright 2019 American Chemical Society.
Figure 8
Figure 8
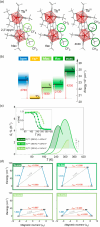
The structure of {[FeII4(L1)4]}(BF4)4·2MeCN ([FeII4]) (HL1 = 2-phenyl-4,5-bis{6-(3,5-dimethyl-1H-pyrazol-1-yl)pyrid-2-yl}-1H-imidazole) molecular square at 100 K (a), electric-potential-variable UV–vis-NIR absorption spectra of the [FeII4] molecules in acetonitrile (b), the structure of {[FeIII2FeII2(L1)4]}(BF4)6·6MeNO2·Et2O·4H2O ([FeIII2FeII2]) molecular square at 100 K (c), the related χMT(T) curves for the [FeII4] and [FeIII2FeII2] systems in the dark and after photoirradiation at 5 K (d), and the mechanism of the site-selective photoswitching effect for the [FeIII2FeII2] molecular squares (e). Parts (b), (d), and (e) were reproduced with permission from ref (469) under terms of the CC-BY license. Copyright 2014 Springer Nature.
Figure 9
Figure 9
The representative view for the crystal structure of {[FeII(trz-py)2][PtII(CN)4]}·3H2O (trz-py = 4-(2-pyridyl)-1,2,4,4H-triazole) layered coordination framework (a), its temperature dependence of the χMT product, presented with the χMT(T) curves for the phases photogenerated at 10 K using 510 nm (green points) and 830 nm (red points) light irradiation (b), the time evolution of the χMT product at 10 K under successive irradiation with 510 and 830 nm light (c), and the χMT(T) curves measured under 510 nm (top) and 830 nm (bottom) light irradiation, shown with the respective quasi-static hysteresis loops (black lines) (d). Parts (b), (c), and (d) were adapted with permission from ref (477). Copyright 2016 American Chemical Society.
Figure 10
Figure 10
The representative view on {[FeII(4-pyaldox)4]2[NbIV(CN)8]}·2H2O (4-pyaldox = 4-pyridinealdoxime) coordination network (a), its temperature dependence of the χMT product in the broad temperature range (b) and the limited low-temperature region before and after the 473 nm light irradiation (c), and the schematic illustration of the ferrimagnetic ordering occurring due to the light-induced SCO in this network (d). Parts (b), (c), and (d) were reproduced with permission from ref (111) under terms of the CC-BY license. Copyright 2011 Springer Nature.
Figure 11
Figure 11
The structure of [CuII(hfac)2LPr] (hfac = hexafluoroacetylacetonate; LPr = propyl-substituted nitronyl nitroxide ligand) coordination chain (a), the temperature dependence of its effective magnetic moment (b), continuous-wave EPR spectra of this material at 210 K (marked as 1), at 7 K (2), immediately after 900 nm light irradiation at 7 K (3), 5 min (4) and 210 min (5) after irradiation, at 7 K after thermal quenching at 20 K (6) (c), recovery curves of the 1216 mT EPR signal after 900 nm light irradiation at 7 K (red), 10 K (green), and 13 K (blue) (d), optical absorption spectra at 300 and 80 K (e), and time dependence of the transient absorption of this compound in PVC probed at 500 nm after 675 nm pump excitation at 90 K (f). Parts (b), (c), and (d) were adapted with permission from ref (487). Copyright 2008 John Wiley & Sons. Parts (e) and (f) were adapted with permission from ref (489). Copyright 2014 John Wiley & Sons.
Figure 12
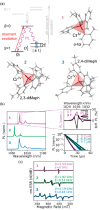
Figure 12
The structure of [PhB(MesIm)3FeII(NPPh3)] (PhB(MesIm)3 = a bulky tris(carbene) borate ligand) metal complex (a), the temperature dependence of the χMT product, shown together with the time evolution of the χMT product during irradiation (the inset) and the χMT(T) curve corresponding to thermal relaxation of the photogenerated state (b), the field dependence of the relaxation time at 2.3 K measured under continuous white light irradiation (c), and the temperature-variable ac magnetic characteristics under the 1000 Oe dc magnetic field and continuous white light irradiation (d), shown with the temperature dependence of the resulting relaxation time (the inset). Parts (b), (c), and (d) were adapted with permission from ref (493). Copyright 2013 American Chemical Society.
Figure 13
Figure 13
The structural view on {[FeII(bpmh)]2[FeIII(Tp*)(CN)3]}·2H2O (bpmh = N,N′-bis-pyridin-4-ylmethylene hydrazine; Tp* = hydrotris(3,5-dimethylpyrazolyl)borate) layers (a), the temperature dependence of the χMT product before and after the 473 nm light irradiation at 5 K (b), the temperature dependences of the ac magnetic susceptibility after irradiation (c), and the schematic representation of the ground ferromagnetic triplet state (LSFM) and the excited ferromagnetic septet state (HSFM) (d). Parts (b), (c), and (d) were reproduced with permission from ref (496) under terms of the CC-BY license. Copyright 2013 Springer Nature.
Figure 14
Figure 14
The representative view on (bibH){[FeII(bib)2][WV(CN)8]}·MeOH (bib = 1,4-bis(1H-imidazol-1-yl)benzene) layered framework (a), the temperature dependence of the χMT product before and after the 473 or 808 nm light irradiation at 10 K (b), shown together with isothermal cycles of sequential light irradiation (the inset), the field-dependent magnetization curves before and after the 473 or 808 nm light irradiation recorded at 1.8 K (c), the temperature dependences of the imaginary parts of the ac susceptibility under zero dc field after irradiation with the 808 nm light (d) and the temperature dependence of the resulting magnetic relaxation time after irradiation with the 808 nm light (e). Parts (b), (c), (d), and (e) were reproduced with permission from ref (498) under terms of the CC-BY license. Copyright 2021 Springer Nature.
Figure 15
Figure 15
The structure of {[MnIII(saltmen)]2[FeII(LN5)(CN)2]}(ClO4)2·0.5C4H10O·0.5H2O (saltmen = N,N′-(1,1,2,2-tetramethylethylene)bis(salicylideneiminate); LN5 = 2,13-dimethyl-3,6,9-12,18-pentaazabicyclo[12.3.1]octadeca-1(18),2,12,14,16-pentaene) coordination chain (a), the temperature-variable frequency dependencies of the ac magnetic susceptibility (b) and the related temperature dependence of the relaxation time before the photoirradiation experiment (c), the isothermal cycles of sequential light irradiation at 10 K followed by the absolute refractivity at 750 nm (d), and the isothermal cycles of sequential light irradiation at 5 K followed within photomagnetic experiment tracing the value of the χMT product (e). Parts (b), (c), (d), and (e) were adapted with permission from ref (500). Copyright 2013 American Chemical Society.
Figure 16
Figure 16
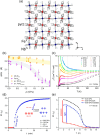
The structure of {[MnIII3O(Et-sao)3(β-pic)3(ClO4)]} (Et-saoH2 = ethyl derivative of salicylaldoxime; β-pic = 2-picolylamine) molecular triangle (a), the series of its field-dependent magnetization curves at the indicated temperatures (b), the related temperature dependence of the relaxation time (c), the difference spectra at the magic angle, for selected time delays, obtained from the transient absorption data in EtOH after pumping at 400 nm (d), and the kinetic traces for UV and vis bands (left) and associated averaged residues of the global analysis (435–492 nm, right) (e), all shown together with the scheme of the molecular and electronic structure of {[MnIII(acac)3]} (acac = acetylacetonate anion) complex for its ground and first excited states, presented for comparison (f). Parts (b) and (c) were reproduced from ref (467) with permission from the Royal Society of Chemistry. Parts (d), (e), and (f) were reproduced with permission from ref (501) under terms of the CC-BY license. Copyright 2020 Springer Nature.
Figure 17
Figure 17
The structure of [CoII(terpy)2]2+ (terpy = 2,2';6',2"-terpyridine) metal complex (a), its transient optical absorption spectra in water excited at 400 nm, shown for selected time delays (b), and their normalized kinetics at different wavelengths (c), the related normalized Kβ transient difference profiles of X-ray emission observed for different pump-probe delays after optical excitation at 400 nm (d), Kα1 and Kβ kinetics tracking the lifetime of the quartet HS state (e), and the calculated SA-CASSCF orbitals for the doublet and quartet structures (f). Parts (b), (c), (d), (e), and (f) were adapted with permission from ref (505). Copyright 2023 John Wiley & Sons.
Figure 18
Figure 18
The view on the idealized crystal structure of Prussian blue analogs (PBAs) of the AIx{MIIy[FeIII(CN)6]}·nH2O (A = alkali metal ion, M = d-block metal ions; here on the examples of A = K and M = Co, as well as A = Rb and M = Mn) type, shown without the visualization of the defects related to the presence of water molecules instead of the part of hexacyanidometallate complexes (a), the magnetization versus temperature curves before and after red light irradiation for KI0.2{CoII1.4[FeIII(CN)6]}·6.9H2O PBA (CoFe PBA) network (b), the molecular unit of the CoFe PBA with the graphical representation of the accessible spin states (c), schematic diagram of the potential energy curves of different key states involved in the electron transfer process in CoFe PBA (d), the magnetization versus temperature curves for Rb0.88{MnII[FeIII(CN)6]0.96}·0.5H2O PBA (RbMnFe PBA) network, gathered in the dark, after irradiation with the 532 nm light at 3 K, after the reverse photomagnetic effect with the 410 nm light at 3 K, and after thermal relaxation at 180 K, all shown together with the respective magnetic hysteresis loops at 3 K after irradiation with both wavelengths (e), and the schematic representation of the potential energy curves of different key states involved in the electron transfer process within the Mn (d–d excitation) path and the IT (intervalence transfer) path of RbMnFe PBA (f). Part (b) was reproduced with permission from ref (233). Copyright 1996 American Association for the Advancement of Science. Parts (c) and (d) were reproduced with permission from ref (550) under terms of the CC-BY license. Copyright 2021 Springer Nature. Part (e) was adapted with permission from ref (369). Copyright 2008 American Chemical Society. Part (f) was adapted with permission from ref (562). Copyright 2021 John Wiley & Sons.
Figure 19
Figure 19
The structure of {[FeIII(CN)3(Tp*)]2[CoII(2,2′-bpy)2]2}(OTf)2·4dmf·2H2O (OTf = trifluoromethanesulfonate anion; 2,2′-bpy = 2,2′-bipyridine; Tp* = tris(3,5-dimethyl)pyrazolylborate) molecular squares (a), the temperature dependences of the χMT product in the dark, after white light irradiation at 10 K, and for the quickly cooled (quenched) sample (b), shown together with the temperature dependence of the relaxation time of the photogenerated state for the thermally quenched (blue) and irradiated (green) samples (the inset). Part (b) was adapted with permission from ref (348). Copyright 2010 John Wiley & Sons.
Figure 20
Figure 20
The structural view on {[FeIII(Bpz4)(CN)3]2[CoII(bik)2]2}(ClO4)2·3H2O (Bpz4 = tetrapyrazolylborate, bik = bis(1-methylimidazol-2-yl)ketone) molecular squares (a), the time evolution of the χMT product under irradiation with different indicated light wavelengths at 20 K (b), and the time variation of the a unit cell parameter upon successive laser irradiation of 808 and 532 nm at 15 K (c). Parts (b) and (c) were adapted with permission from ref (363). Copyright 2013 American Chemical Society.
Figure 21
Figure 21
The structure of {[FeIII(CN)3(Tp)][CoII(PY5Me2)]}+ (Tp = hydridotris(pyrazol-1-yl)borate, PY5Me2 = 2,6-bis(1,1-bis(2-pyridyl)ethyl)pyridine) dinuclear molecular cation (a), the time dependence of the χMT product under white light irradiation at 10 K (b), the temperature dependence of the χMT before and after white light irradiation at 10 K (c), the variation of surface refractivity upon cooling from 300 to 10 K (d), and the temperature dependence of absolute refractivity at 850 nm before and after white light irradiation at 10 K. Parts (b), (c), (d), and (e) were adapted with permission from ref (361). Copyright 2014 American Chemical Society.
Figure 22
Figure 22
The structure of {[CoII(pym)2]2[CoII(H2O)2][WV(CN)8]2}·4H2O (pym = pyrimidine) coordination network (a), its magnetization versus field curve at 2 K before irradiation, after 120 min of the 840 nm light irradiation, and after thermal relaxation at 150 K (b), and the magnetization versus time curve within the cycles of the successive 840 nm and 532 nm light irradiation at 10 K, shown together with the temperature dependence of magnetization measured in the dark, after irradiation with the 840 nm light, and after the subsequent photoirradiation with the 532 nm light (c). Parts (b) and (c) were adapted with permission from ref (377). Copyright 2008 American Chemical Society.
Figure 23
Figure 23
The structure of {[FeIII(CN)3(pzTp)]2[CoII(4-styrpy)]}·2H2O·2MeOH (pzTp = tetrakis(pyrazolyl)borate; 4-styrpy = 4-styrylpyridine) coordination chain (a), its temperature dependence of the χMT product before and after 532 nm light irradiation at 5 K, shown together with the scheme of the observed thermal and photoinduced electron transfer process (b), the relaxation kinetics of the photogenerated fraction at different temperatures (c), and the temperature dependences of the real and imaginary parts of the ac magnetic susceptibility under zero dc field after irradiation using the 532 nm light (d). Parts (b), (c), and (d) were adapted with permission from ref (576). Copyright 2012 John Wiley & Sons.
Figure 24
Figure 24
The representative structural view on {[FeIII(2,2′-bpy)(CN)4]2[CoII(4,4′-bpy)]}·4H2O (2,2′-bpy = 2,2′-bipyridine; 4,4′-bpy = 4,4′-bipyridine) layered coordination polymer (a), the temperature dependence of the χMT product in the dark (b, upper part), as well as after the 532 nm light irradiation at 5 K and after thermal relaxation at 150 K (b, bottom part), and the temperature dependences of the real and imaginary parts of the ac magnetic susceptibility under zero dc field after irradiation with the 532 nm light (c). Parts (b) and (c) were adapted with permission from ref (577). Copyright 2010 American Chemical Society.
Figure 25
Figure 25
The schematic representation of the reversible light-induced magnetic switching of the azopyridine-functionalized Ni(II)-porphyrin molecular system occurring in solution (a) and the related UV–vis absorption spectra of the trans and cis isomers of this Ni(II)-porphyrin complex with the indicated light stimuli modulating the spectra (b). Reproduced with permission from ref (617). Copyright 2011 American Association for the Advancement of Science.
Figure 26
Figure 26
The structures of the all-trans (left, E isomers) and all-cis (right, Z isomers) metal complexes of [FeII(4-styrpy)4(NCSe)2] (4-styrpy = 4-styrylpyridine) (a), UV–vis absorption spectra at 120 K of PMMA (poly(methyl methacrylate)) thin films filled with all-trans (left) and all-cis (right) Fe(II) metal complexes before and after irradiation using the indicated wavelengths (b), the time-dependent magnetization over field curves under the 355 nm light irradiation at 130 K for the PMMA thin films filled with the above-mentioned all-trans (left) and all-cis (right) complexes (c). Parts (b) and (c) were adapted with permission from ref (624). Copyright 2009 American Chemical Society.
Figure 27
Figure 27
The structure of [FeII(H2B(pz)2)2(phen*)] (pz = 1-pyrazolyl; phen* = 5,6-bis(2,5-dimethylthien-3-yl)-1,10-phenanthroline) metal complex (a), the schematic representation of the bidirectional switching using photocyclization of the phen* ligand followed by photocycloreversion (b), the UV-induced photocyclization under the 282 nm irradiation and the subsequent photocycloreversion realized by visible light traced by the UV–vis absorption spectra at room temperature, shown together with the cycles of the photoswitching effect investigated following the intensity of the 375 nm absorption band at room temperature (c), and NEXAFS spectra at the FeL3 edge at room temperature and at 82 K for the pristine material (left side), room temperature NEXAFS spectra at the FeL3 edge for the pristine material and the sample after irradiation with UV or visible light (middle part), shown together with the time dependence of the peak intensity at 710.2 eV in the NEXAFS spectra at the FeL3 edge upon alternating irradiation with UV and visible light at room temperature (right side) (d). Parts (b), (c), and (d) were adapted with permission from ref (631). Copyright 2015 John Wiley & Sons.
Figure 28
Figure 28
The schematic representation of photoisomerization-induced spin-charge excited-state (PISCES) effect in [CoIII(dtbq)2(apso)] (dtbq = an o-benzoquinone derivative; apso = spiro(azahomoadamantyl-phenanthrolinoxazine)) metal complex (a), the temperature dependence of the χMT product in the solid state (squares) and solution (triangles) (b), the time dependence of the χMT product under visible light irradiation and its removal for the thin film sample (c), change of the χMT product over several cycles of white light irradiation followed by thermal relaxation for the thin film sample (d), and the NIR absorption spectra before and after white light irradiation for the thin film sample at 300 K, presented together with the 2500 nm band intensity changes over the several cycles of white light on/off switching (e). Adapted with permission from ref (609). Copyright 2018 American Chemical Society.
Figure 29
Figure 29
The structure of the 1,2-bis(5-carboxyl-2-methyl-3-thienyl)perfluorocyclopentene (dae2–) ligand and its schematic conversion under UV and vis light irradiation (a), the structure of {[DyIII2(dae)3(dmso)3(MeOH)]} dinuclear molecule (b), the solid-state UV–vis absorption spectra of a powdered sample measured upon irradiation using the 365 nm (left side) and 480 nm (right side) light (c), temperature variable frequency dependencies of the imaginary part of the ac magnetic susceptibility before irradiation, under 1500 Oe dc magnetic field (d), the temperature dependencies of the relaxation times under 1500 Oe dc magnetic field for the pristine sample, after irradiation with the 365 nm light, and after irradiation with the 480 nm light (e). Parts (a), (c), (d), and (e) were adapted with permission from ref (646). Copyright 2014 John Wiley & Sons.
Figure 30
Figure 30
The structure of [DyIIIF(Lc)(Tppy)]PF6 (Lc = closed form of bispyridyl dithienylethene derivative; Tppy = tris(3-(2-pyridyl)pyrazolyl)hydroborate) coordination chain and its photoinduced phase with the open form of the bispyridyl dithienylethene ligand (Lo) (a), the time evolution of the unit cell parameters upon the 532 nm light irradiation followed by the 365 nm light irradiation at room temperature (b), the temperature dependences of the magnetic relaxation time for this system before and after white light irradiation (c) and the magnetization versus field hysteresis loops at 2 K before and after white light irradiation (d). Parts (b), (c), and (d) were adapted with permission from ref (647). Copyright 2019 American Chemical Society.
Figure 31
Figure 31
Schematic representation of the AzoMOF, {[ZrIV6O4(OH)4(LAzo)6]} (LAzo = 2′-phenyldiazenyl-1,1′:4′,1″-terphenyl-4,4″-dicarboxylate) with the octahedral pores occupied by {DyIIIScIII2N@C80} magnetic fullerenes, and its irradiation with the UV light (a),, the related magnetization versus field hysteresis loops at 2 K for {DyIIIScIII2N@C80} (b, left) and for this system embedded in the AzoMOF before and after UV light irradiation (b, right). Adapted with permission from ref (655). Copyright 2018 American Chemical Society.
Figure 32
Figure 32
The representative structural views on {[NaI(H2O)2]2[CoII(ox)2(H2O)2]}·2H2O (ox = oxalato) coordination framework (a), its room-temperature photoluminescence spectra for the UV excitation in the aqueous solution (top, b) and in the solid state (bottom, b), and the set of dc magnetic characteristics, including the χM(T) and χMT(T) curves under the applied field of 1 kOe (c). Parts (b) and (c) were reproduced from ref (703) with permission from the Royal Society of Chemistry.
Figure 33
Figure 33
The representative structural views on {[TbIII(box)2(dmf)2][WV(CN)8]}·H2O (box = 2,2′-bis(2-oxazoline)) layered coordination network (a), its temperature dependence of the χMT product under 2 kOe (b), shown together with the field dependence of magnetization at 1.8 K (the inset), and the low-temperature emission spectra under the indicated excitation light conditions, presented together with the related schematic energy level diagrams representing the observed optical phenomena (c). Parts (b) and (c) were adapted with permission from ref (716). Copyright 2014 American Chemical Society.
Figure 34
Figure 34
Examples of optical luminescence-based devices with incorporated Fe(II) SCO materials: the device built of the ITO/chlorophyll a/[FeII(dpp)2](BF4)2/Al (dpp = 2,6-di-(pyrazol-1-yl)pyridine; where the Fe(II) is a mononuclear complex with two N,N,N-tridentate organic ligands): sequence of the thin films (a, top) and their temperature-variable electro-luminescence at 300 and 200 K under the voltage of 3 V (a, bottom), the scheme of the preparation for the arrays of nanodots based on SCO-active [FeII(hptrz)3](OTs)2 coordination polymer (the analogous one to presented in Figure 1a; hptrz = 4-heptyl-1,2,4-triazole; OTs = tosylate anion) and doped with the acridine orange (b, top), shown with the dark field image of an obtained nanodot and fluorescence image of the dots in the highlighted area (b, bottom). Part (a) was reproduced with permission from ref (720). Copyright 2008 Elsevier Publishing. Part (b) was reproduced from ref (721) with permission from the Royal Society of Chemistry.
Figure 35
Figure 35
A two-dimensional HAADF-STEM (high-angle annular dark-field imaging on scanning transmission electron microscopy) image showing the core-shell structure of the SiO2–[FeII(HTrz)2(Trz)](BF4) (HTrz = 1H-1,2,4,-triazole; where the Fe(II) part is the structural analog of the compound presented in Figure 1a) SCO nanoparticle and a three-dimensional surface rendered tomographic reconstruction (a), the thermal variation of the emission intensity of this core-shell structure decorated with dansyl (i.e., 5-(dimethylamino)naphthalene-1-sulfonyl) groups under the 495 nm excitation light (b), and the related thermal variation of the χMT product under the 1 kOe field. Reproduced from ref (725) with permission from the Royal Society of Chemistry.
Figure 36
Figure 36
The structure of [FeII(L-o)2]2+ cationic metal complex bearing the ring-opened ligand (L-o) of pyridinecarbaldehyde rhodamine 6G hydrazone (a), and the temperature dependences of the χMT product and the fluorescence intensity at the emission (PL, photoluminescence) maximum under the 560 nm excitation light, gathered for the heating mode (b). Part (b) was adapted with permission from ref (729). Copyright 2018 American Chemical Society.
Figure 37
Figure 37
The structure of [FeII(naph-trz)6]2+ (naph-trz = N-(1,2,4-triazol-4-yl)-1,8-naphthalimide) cationic metal complex (a) and its temperature dependences of the emission peak position (fluorescence data) correlated with the Fe(II) high-spin fraction derived from the magnetic characteristics (magnetic data) (b). Part (b) was reproduced from ref (737) with permission from the Royal Society of Chemistry.
Figure 38
Figure 38
Schematic representation of the routes for structural modifications of luminescent [DyIII(acac)3(H2O)2] (acac = acetylacetonate) complexes, realized in two ways, by modifying the acac ligand or coordinating additional antenna ligands with the electron donating ability (tfac = 1,1,1-trifluoroacetylacetonate; hfac = hexafluoroacetylacetonate; 9Accm = 1,7-di-9-anthracene-1,6-heptadiene-3,5-dione; tta = 2-thenoyltrifluoroacetonate; facam = 3- trifluoroacetyl-(+)-camphorate anion; 2,2′-bpym = 2,2′-bipyrimidine; 2,2′-bpy = 2,2′-bipyridine; py = pyridine; TTF-L1, TTF-L2, TTF-L3 = three types of tetrathiafulvalene-based ligands). The key modification parts were indicated by the darker color.
Figure 39
Figure 39
The structure of {[DyIII(4-pyone)4(H2O)2][MIII(CN)6]}·nH2O (4-pyone = 4-pyridone; M = Co, Rh) dinuclear molecules (a), their temperature dependences of the zero-dc-field magnetic relaxation times with the indicated effective thermal energy barriers representing the strength of magnetic anisotropy in both compounds (b), room-temperature solid-state emission spectra of the {DyIIIRhIII} analog obtained under the indicated excitation wavelengths, shown together with the resulting emission colors (c), and the schematic energy level diagram showing the mechanisms of electronic interplay between incorporated molecular building blocks (d). Parts (b), (c), and (d) were reproduced from ref (793) with permission from the Royal Society of Chemistry.
Figure 40
Figure 40
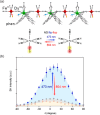
The structure of [YbIII2(valdien)2(NO3)2] (valdien = the deprotonated form of N1,N3-bis(3-methoxysalicylidene)diethylenetriamine) dinuclear molecule serving as a field-induced SMM (a) and its optical properties, including the NIR emission spectra related to the Yb(III)-centered 2F5/22F7/2 transition, recorded under the 375 nm excitation in the 80–320 K temperatures range (b), the thermometric parameters (Δ) for indicated thermometric approaches (the ratio between integrated regions, the ratio between selected detailed emission components, and the width of the selected emission peak), shown together with the respective fits of the Δ(T) dependences and the temperature uncertainties of the optical thermometric effect (c), and the relative thermal sensitivities of the considered thermometric approaches (d). Parts (b), (c), and (d) were reproduced from ref (817) with permission from the Royal Society of Chemistry.
Figure 41
Figure 41
The representative views on the series of [TbIII2(2,2′-bpym)(Ldk)6] (2,2′-bpym = 2,2′-bipyrimidine; Ldk stands for three different diketonate ligands, including hfac = hexafluoroacetylacetone, tfac = 1,1,1-trifluoroacetylacetonate, and acac = acetylacetonate) dinuclear molecules (a), the relative energy positions of the triplet states of the incorporated ligands in relation to the 5D4 emitting level of Tb(III) centers (b), the comparison of the relative thermal sensitivity curves, Sr(T), obtained from the fitting procedure of the temperature dependences of emission lifetime values shown in the inset (c), and the ab-initio-calculated energy splitting of two lowest-lying pairs of the mJ levels for the indicated complexes, shown together with the transition probabilities and tunneling gaps representing the magnetic relaxation processes observed for these molecules (d). Parts (b), (c), and (d) were adapted with permission from ref (772). Copyright 2019 John Wiley & Sons.
Figure 42
Figure 42
The structure of {[HoIII(4-pyone)4(H2O)2][MIII(CN)6]}·nH2O (4-pyone = 4-pirydone; M = Co, Rh, Ir) dinuclear molecules (a), the temperature dependence of zero-dc-field magnetic relaxation times for Ho–Co compound (1) and its Y(III)-diluted analog (1@Y), shown with indicated dominant magnetic relaxation processes (b), the set of temperature-dependent emission spectra of 1@Y measured under the 370 nm light irradiation, shown with the extracted luminescence re-absorption spectra obtained after the subtraction of the ligand emission component (c), and the enlargement of the related re-absorption spectra in the wavelength range of 435–470 nm, representing the efficient optical thermometry effect (d). Parts (b), (c), and (d) were reproduced from ref (795) with permission from the Royal Society of Chemistry.
Figure 43
Figure 43
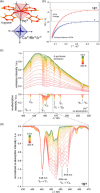
The structure of [DyIII(CyPh2PO)2(H2O)5] (CyPh2PO = cyclohexyl(diphenyl)phosphine oxide) anionic metal complex (a), its temperature-variable magnetization versus magnetic field curves (b), the set of absorption, excitation (λem = 574 nm), and emission (λexc = 361 nm) spectra, measured at 300 and 10 K (the vertical lines indicate the postulated energies of the emission components related to the 4F9/26H15/2 electronic transition), shown together with the pulsed-field emission spectrum at 5 K (c), and the schematic energy levels diagram determined by the fluorescence spectra, compared with the anisotropic energy barriers for the Dy(III)-based SMMs, found experimentally using the magnetic data of the Dy(III) complex (1) and its Y(III)-diluted analog (1@Y) as well as determined theoretically (ab initio) (d). Parts (b), (c), and (d) were adapted with permission from ref (837). Copyright 2017 John Wiley & Sons.
Figure 44
Figure 44
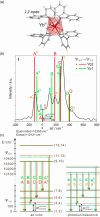
The structure of [YbIII(2,2′-bpdo)4][AgI(CN)2]3·(solvent) (2,2′-bpdo = 2,2′-bipyridine N,N′-dioxide) supramolecular framework (only the Yb(III) molecular cation revealing a field-induced SMM behavior was shown) (a), its high-resolution emission spectrum at 80 K for the 325 nm excitation, shown with the cumulative oscillator strengths (colored bars) for two crystallographically independent Yb1 and Yb2 sites, obtained from the ab initio calculations (b), and the comparison of the energy level diagrams obtained from the ab initio approach and the experimental emission spectra (photoluminescence) (c). Parts (b) and (c) were adapted with permission from ref (789). Copyright 2021 American Chemical Society.
Figure 45
Figure 45
The structure of [CsIDyIII(8-mCND)4(MeOH)(Me2CO)]·2(Me2CO) (8-mCND = the anion of hydroxy-8-methyl-1,5-naphthyridine-3-carbonitrile ligand) molecule (a), its UV-light-induced emission spectra measured in the 10–77 K range, representing the 4F9/26H13/2 electronic transition of Dy(III) centers (b), and the analogous emission spectra gathered at 5 K under a pulsed magnetic field up to 36 T, recorded in the 465–500 nm range, and shown together with a diagram of the energy splitting related to the Zeeman effect (c). Parts (b) and (c) were reproduced from ref (831) with permission from the Royal Society of Chemistry.
Figure 46
Figure 46
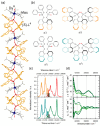
Excited-state manifold for the S = 1 metal complex in an ideal C3 symmetry with qualitative orbital splitting diagram and electronic configurations for the 1E and 3A states (a), the structure of [VIII((C6F5)3tren)(CNtBu)] ((C6F5)3tren = 2,2′,2′′-tris[(pentafluorophenyl)amino)triethylamine; CNtBu = tert-butyl isocyanide) complex being the representative of the S = 1 system (b), its variable-temperature luminescence spectra and emission lifetimes (c), and the variable-magnetic-field emission spectra, shown with the simulated Zeeman splitting and differential emission (in relation to the case without external field) (d). Parts (a), (c), and (d) were adapted with permission from ref (877). Copyright 2020 American Chemical Society.
Figure 47
Figure 47
The energy-level diagram of high-symmetry Cr(IV) complexes depicting their possible photoluminescence, shown together with the [CrIV(L-aryl)4] complexes of this type, including the systems with three different aryl ligands, L-aryl (o-tol = o-tolyl, 2,3-diMeph = 2,3-dimethylphenyl, and 2,4-diMeph = 2,4-dimethylphenyl) (a), low-temperature luminescence spectra of these complexes, presented together with their Zeeman splitting under the 0 and 9 T external magnetic fields (b), and the related X-band continuous-wave electron spin resonance spectra collected at 77 K (c). Reproduced with permission from ref (878). Copyright 2020 American Association for the Advancement of Science.
Figure 48
Figure 48
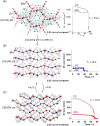
Representative structural views (left panel) and field-cooled (FC) with zero-field-cooled (ZFC) magnetic curves (right panel) of three chiral MnII–[CrIII(CN)6]3– molecule-based ferrimagnets with (S)- or (R)-1,2-diaminopropane (pn) ligands, including 3-D KI0.4((S)-pnH)0.6{[MnII((S)-pn)][CrIII(CN)6]} network obtained from a slightly basic solution (a), layered {[MnII((R)-pnH)(H2O)][CrIII(CN)6]}·H2O framework, obtained by adjusting the solution to relatively acidic pH (b), and the dehydration-induced 3-D {[MnII((R)-pnH)][CrIII(CN)6]} framework (c). Part (a) was adapted with permission from ref (910). Copyright 2001 John Wiley & Sons. Parts (b) and (c) were adapted with permission from ref (911). Copyright 2016 American Chemical Society.
Figure 49
Figure 49
Structure of 3-D chiral {[MnII((S)-diMeAlaOH)(H2O)]2MnII[MoIII(CN)7]2}·2H2O ((S)-diMeAlaOH = (S)-N,N-dimethylalaninol) coordination network with indicated water molecules occupying the structural nanopores (a) and the temperature dependences of molar magnetization for the as-synthesized water-containing framework and their dehydrated phase, shown with the indicated values of the critical temperatures of related magnetic phase transitions (b). Part (b) was adapted with permission from ref (919). Copyright 2007 American Chemical Society.
Figure 50
Figure 50
The structure of 3-D chiral {[MnII(4-Ipy)4]2[NbIV(CN)8]} (4-Ipy = 4-iodopyridine) coordination network with the indicated two types of helical structural channels (a) and its temperature dependence of molar magnetization with the indicated value of the critical temperature of the magnetic phase transition (b). Part (b) was reproduced from ref (921) with permission from the Royal Society of Chemistry.
Figure 51
Figure 51
The structure of chiral [FeII(H3tris(imaea))][FeIII(tris(imaea))](NO3)2 (tris(imaea) = tris{[2-{(imidazole-4-yl)methylidene}amino]ethyl}amine in the H3L or L3– form) supramolecular framework (a), its temperature- and light-induced spin transition characteristics followed by changes in the χMT product (b), and the CD spectra in KBr pellets of the selected crystals of this compound (c), the structure of analogous chiral [FeIII(H3tris(imaea))][FeIII(tris(imaea))][CrIII(ox)3]·3H2O (ox = oxalato) supramolecular network (d), its temperature dependence of the χMT product (e), and the CD spectra of this compound and its enantiomeric form (f). Parts (b) and (c) were adapted with permission from ref (470). Copyright 2003 John Wiley & Sons. Parts (e) and (f) were reproduced from ref (925) with permission from the Royal Society of Chemistry.
Figure 52
Figure 52
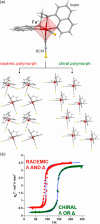
The structure of [FeII(bqen)(NCS)2] (bqen = N,N′-bis(8-quinolyl)ethane-1,2-diamine) complex and the two types of its crystal packing, including the racemic polymorph and the chiral one (a), and their temperature dependences of the χMT product, depicting the impact of the chirality on the thermal spin crossover effect (b). Part (b) was adapted with permission from ref (928). Copyright 2017 American Chemical Society.
Figure 53
Figure 53
The structural views on 3-D chiral [FeII(mptpy)2]·EtOH·0.2dmf (mptpy = 3-methyl-2-(5-(4-(pyridin-4-yl)phenyl)-4H-1,2,4-triazol-3-yl)pyridine) coordination framework showing the SCO effect (a), the temperature dependences of the χMT product for its solvated and desolvated phases (b), and the CD spectra of the bulk sample (dark yellow) and selected enantiopure single crystals (navy and magenta) (c). Parts (b) and (c) were reproduced from ref (929) with permission from the Royal Society of Chemistry.
Figure 54
Figure 54
The structure of chiral [FeII4((R)-immHpa)6]8+ ((R)-immHpa = (R)-enantiomer of the H-derivative of 1,4-di((imidazol-2-ylmethylene)-1-phenylethanamine)butane) molecular cationic cage, shown together with the ball-stick model of the related tetrahedral cage (a), the courses of the SCO effect for three different derivatives of this molecular cage, illustrated by the temperature dependences of the χMT product (b), the structure of chiral [FeII4((R)-Alk-bpddi)4]8+ ((R)-Alk-bpddi = 2,6-bis(6-(pyrazol-1-yl)pyridin-2-yl)-1,5-dihydrobenzo[1,2-d:4,5-d′]di-imidazole ligand decorated with the chiral alkyl substituent of the (R)-form) molecular cation, shown together with the ball-stick model of the [2x2] square grid topology (c), and its temperature dependence of the χMT product representing the thermal and photoinduced (LIESST) SCO effect (d). Part (b) was reproduced from ref (939) with permission from the Royal Society of Chemistry. Part (d) was adapted with permission from ref (945). Copyright 2021 John Wiley & Sons.
Figure 55
Figure 55
Examples of chiral single-chain magnets formed using the indicated metal centers and the nitronyl nitroxide (NIT)-type radicals: [CoII(hfac)2(NIT-PhOMe)]}(hfac = hexafluoroacetylacetonate, NIT-PhOMe = 2,4′-methoxo-4,4,5,5-tetramethylimidazoline-1-xoyl-3-oxide) helical chains (a), [LnIII(hfac)3(NIT-PhOPh)] (Ln = Dy, Tb, Ho, Er; NIT-PhOPh = 2,4′-benzoxo-4,4,5,5-tetramethylimidazoline-1-oxyl-3-oxide) helical chains (b), [TbIII(hfac)3(NIT-PhOHexyl)] (NIT-PhOHexyl = 2-(4′-hexoxyphenyl)-4,4,5,5-tetramethylimidazoline-1-oxyl-3-oxide) nanometer-sized tubular chains in two representative views (c).
Figure 56
Figure 56
The structure of chiral [MnIIMnIII12CuII8(D-tart)123-O)(O2CH)0.5(O2CMe)0.6(H2O)0.9]10– (D-tart = D-tartrate) anionic coordination cluster (a), its temperature dependences of the out-of-phase magnetic susceptibility at various indicated frequencies for the zero dc field, representing the SMM behavior for this compound (b), and the solid-state CD spectra for two enantiomers (with D-tart and L-tart) (c). Parts (b) and (c) were reproduced from ref (972) with permission from the Royal Society of Chemistry.
Figure 57
Figure 57
The structure of chiral [DyIII((RRRR)-LN6F12)(Ph3SiO)2](BPh4) ((RRRR)-LN6F12 = an enantiopure Schiff base ligand obtained from the condensation of two (1R, 2R)-1,2-bis(2,4,6-trifluorophenyl)ethane-1,2-diamine and two 2,6-diformylpyridine molecules; Ph3SiO = triphenylsilanolate) complex (a), its representative ac magnetic characteristics for the indicated temperature range, illustrating the SMM behavior (b), and the related temperature-variable magnetic hysteresis loops appearing below the blocking temperature (c). Parts (b) and (c) were adapted with permission from ref (982). Copyright 2021 American Chemical Society.
Figure 58
Figure 58
The structure of chiral (M)-[CoII(SO4)(1,3-bbix)(H2O)3] (1,3-bbix = 1,3-bis((1H-benzo[d]imidazol-1-yl)methyl)benzene) coordination chain obtained using the chiral molecular agent in the synthesis (a), the related out-of-phase magnetic susceptibility versus frequency curves at the indicated temperatures, representing the SMM behavior (b), and the CD spectra for two obtained enantiomorphic compounds, (M) and (P) (c). Parts (b) and (c) were reproduced from ref (986) with permission from the Royal Society of Chemistry.
Figure 59
Figure 59
The structure of chiral (N(CH3)(n-C3H7)((S)-s-C4H9)){MnII[CrIII(ox)3]} (ox = oxalato) layered coordination framework (a) (chiral organic cations are omitted for clarity), the comparison of the temperature dependences of the magneto-chiral dichroism (MChD) signal measured at 615 nm (ΔT/T) and molar magnetization, showing the correlation between MChD and ferromagnetism (b), the thermal variation of the second harmonic (SH, detected at 532 nm for the incident radiation of 1064 nm) signal under the 300 Oe magnetic field, demonstrating the appearance of the magnetization-induced SHG (MSHG) effect, shown together with the polarization analysis of the SHG signals for the ferromagnetic state (T = 2 K) changing upon the shift of the external magnetic field from +1700 Oe (blue points) to −1700 Oe (red points), which indicates the angular switching of the SHG polarization plane upon the magnetization reversal (c). For details regarding the SHG part see the text of section 5.5. Part (b) was reproduced with permission from ref (922) under terms of the CC-BY license. Copyright 2008 Springer Nature. Part (c) was adapted with permission from ref (133). Copyright 2009 American Chemical Society.
Figure 60
Figure 60
The structure of chiral [MII(hfac)2(NIT-PhOMe)] (M = Co, Mn; hfac = hexafluoroacetylacetonate, NIT-PhOMe = 2,4′-methoxo-4,4,5,5-tetramethylimidazoline-1-xoyl-3-oxide) helical chains (a), the normalized spectra of K-edge X-ray natural circular dichroism (XNCD), X-ray magnetic circular dichroism (XMCD), and X-ray magneto-chiral dichroism (MChD) collected at the temperature of 5 K and the magnetic field of 3 T for the Co(II)-based chains (b), and their Mn(II)-containing analogs (c). In (b) and (c), colored solid curves and grey solid curves represent the spectra of two obtained enantiomers, respectively, and dashed curves represent the calculated XNCD spectra for the P31 enantiomer. Parts (b) and (c) were reproduced with permission from ref (950) under terms of the CC-BY license. Copyright 2015 Springer Nature.
Figure 61
Figure 61
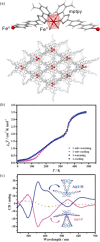
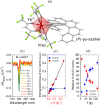
The structure of chiral [YbIII(hfac)3((P)-py-azahel)] (hfac = hexafluoroacetylacetonate, py-azahel = 3-(2-pyridyl)-4-aza[6]-helicene of the (P) or (M) form) metal complex (a) and the MChD spectra of a (P)-enantiomer at variable temperatures from the 4–150 K range related to the YbIII-centered 2F7/22F5/2 electronic transition (b); two mechanisms contributing to the MChD, the A term related to the lifting of the degeneracy of energy levels due to the magnetic field and the C term related to changes of population of the ground state levels, are disentangled with their respective integrated areas as a function of temperature (c) and the relative percentage of their contributions to the MChD signals at variable temperatures (d). Parts (b), (c), and (d) were adapted with permission from ref (1009). Copyright 2021 American Chemical Society.
Figure 62
Figure 62
The structure of chiral [DyIII5NiII6((R)-hmb-ser)6(ac)33-OH)9(H2O)6](ClO4)3·15H2O (hmb-ser = (2-hydroxy-3-methoxybenzyl)serine of the (R) or (S) form; ac = acetate) coordination cluster (a) and its temperature-variable MChD spectra collected under a magnetic field of 0.86 T within the 4–150 K temperature range (b). The dominant magnetic optical activity (MOA) origin of the MChD signal related to the Dy(III) centers, as well as the analogous dominant natural optical activity (NOA) origin of the MChD signal related to the Ni(II) centers, were indicated in (b). Part (b) was adapted with permission from ref (142). Copyright 2022 American Chemical Society.
Figure 63
Figure 63
The representative view on chiral α-{[MnII(urea)2(H2O)]2[NbIV(CN)8]} coordination framework (a), its temperature dependences of molar magnetization for the single crystal at the indicated magnetic field conditions (b), and the related temperature dependence of the SHG signal with the indicated area corresponding to the magnetization-induced SHG (MSHG effect) (c). Parts (b) and (c) were adapted with permission from ref (1023). Copyright 2011 American Chemical Society.
Figure 64
Figure 64
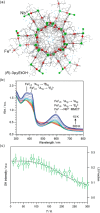
The structure of chiral {[FeII2((R)-3pyEtOH)8][NbIV(CN)8]}·6H2O (3pyEtOH = 1-(3-pyridyl)ethanol in the (R) or (S) form) coordination framework (a), its temperature-variable UV–vis absorption spectra with the indicated electronic transitions appearing for the low-spin (low-temperature) phase (b), and the temperature dependence of the SH intensity upon 2.2 mW incident laser irradiation compared with the FeII low-spin (LS) fraction (c). Parts (b) and (c) were reproduced from ref (482) with permission from the Royal Society of Chemistry.
Figure 65
Figure 65
The representative structural views on {[NiII(H2O)2]2[WIV(CN)8]}·4H2O coordination network and its dehydrated {NiII2[WIV(CN)8]} form (a), the related temperature dependences of the χMT product (b), and their UV–vis-NIR absorption spectra shown with the photos of the powder samples (c), the structure of [CoII3(lac)2(pybz)2]·3dmf (lac = D- and L-lactate; pybz = 4-pyridyl benzoate) coordination network (d), the scheme of its post-synthetic modifications, shown together with the resulting magnetic ground states, color of the samples, and changes in coordination and valence of embedded Co ions (e), and the temperature dependences of the ac magnetic susceptibilities for two indicated phases (f). Parts (b) and (c) were adapted with permission from ref (1063). Copyright 2017 American Chemical Society. Parts (e) and (f) were adapted with permission from ref (1064). Copyright 2014 American Chemical Society.
Figure 66
Figure 66
The representative views on {[FeII(pz)][PtII(CN)4]}·2H2O (pz = pyrazine) Hofmann-type coordination framework, shown together with the insight into the pores occupied by the guest molecules for the pyrazine- and CS2-containing phases (a), schematic presentation of the chemically- and thermally-driven processes, presented together with the respective color changes (HS and LS represents the labels for the high- and low-spin states of Fe(II) sites, respectively) (b), and the related temperature dependences of the χMT product for the as-synthesized sample and the phases filled with benzene (bz) and CS2 molecules (c), the structural views on [FeII(tolpzph)2(NCS)2]·THF (tolpzph = 4-p-tolyl-3-(phenyl)-5-(2-pyrazinyl)-1,2,4-triazole) coordination system, including the positions of the THF molecules of crystallization (d), the related temperature dependences of the magnetic moment measured on cooling from 300 to 50 K, and further in the 50–400 K cycles (e), and the curve representing the changes in the T1/2 values (temperature of the 50% yield of the thermal Fe(II) SCO completeness) upon 10 consecutive cycles of interconversions between the thermally desolvated and the THF-containing phases, shown together with the photos of the respective powder samples (f). Parts (b) and (c) were adapted with permission from ref (316). Copyright 2009 John Wiley & Sons. Parts (e) and (f) were reproduced from ref (1072) with permission from the Royal Society of Chemistry.
Figure 67
Figure 67
The structure of (NH4){[NiII(cyclam)][FeIII(CN)6]}·5H2O (cyclam = 1,4,8,11-tetraazacyclotetradecane) coordination chains and their arrangement in the supramolecular network (a), the temperature dependences of the χMT product for the as-synthesized phase (HT and LT represent the labels for its high- and low-temperature phases, respectively, differing in the oxidation states of the metal sites) and the dehydrated phase (1d) (ETPT = electron transfer phase transition) (b), and the UV–vis-NIR absorption spectra of the related phases, shown with the assignment of the strongest absorption bands and the photos of the respective powder samples (c). Parts (b) and (c) were adapted with permission from ref (366). Copyright 2020 John Wiley & Sons.
Figure 68
Figure 68
The structural views on {[DyIII(H2O)2][CoIII(CN)6]}·2.2H2O coordination network in its as-synthesized hydrated form (1) and the dehydrated phase of {DyIII[CoIII(CN)6]} (2) (a), the representative ac magnetic characteristics demonstrating the SMM behavior occurring for the phase 2 (b), and the low-temperature (T = 3.5 K) photoluminescence (excitation – left sides, emission – right sides) spectra for both investigated phases, shown together with the assignment of the main emission components to the selected f–f electronic transitions (c). Parts (b) and (c) were adapted with permission from ref (794). Copyright 2019 American Chemical Society.
Figure 69
Figure 69
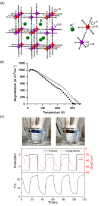
The structural model for the family of KIx{VII/IIIy[CrIII(CN)6]znH2O coordination frameworks (a),, including electrochemically synthesized KI0.31{VII0.49VIII0.51[CrIII(CN)6]0.94}·6.5H2O and KI0.61{VII0.97VIII0.03][CrIII(CN)6]0.88}·7.2H2O·0.4EtOH phases, for which the temperature dependences of the magnetization are presented (b) (filled black and empty circles, respectively), and the representative views on the electrochromic switching of this type of molecule-based magnets (c), shown by the photos of the related films in the electrochemical cell (in aqueous solution of KCl) at 0 V (left) and −1.3 V (right), the time-sequence of the applied potential and corresponding charge density (central part), and the related changes in the transmittance at 465 nm (bottom). Part (b) was adapted with permission from ref (994). Copyright 2000 American Chemical Society. Part (c) was reproduced with permission from ref (1083). Copyright 2017 Elsevier Publishing.
Figure 70
Figure 70
The structure of CsI{[FeII(Tp)(CN)3]4[FeII1FeIII3(pzTp)4]} (Tp = hydrotris(pyrazol-1-yl)borate; pzTp = tetrakis(pyrazolyl)borate) cluster (a), the changes in the UV–vis-NIR absorption spectra at modulated applied potential with the indicated origin of main absorption bands (b), the temperature dependences of the χMT product for freshly prepared crystals of the clusters exhibiting the SCO effect (blue curve) and the subsequent curve measured after heating to 310 K that indicate the irreversibility of the transition (cyan curve) (c), and the scheme of the 9 redox states of the cluster accessible through cyclic voltammetry (d). Parts (b), (c), and (d) were reproduced from ref (387) with permission from the Royal Society of Chemistry.
Figure 71
Figure 71
The representative structural views on [FeII(bttmb)2(SCN)2] (bttmb = 1,3-bis(1,2,4-triazol-1-ylmethyl)-2,4,6-trimethylbenzene) layered coordination network (a), its temperature dependences of the χMT product under the indicated pressures (b), and the color changes of this compound (mixed with KBr) under various indicated pressures, shown together with the color changes from transparent colorless crystals to purple under the pressure, followed by the color recovery achieved by grinding and heating under vacuum (c). Parts (b) and (c) were adapted with permission from ref (1095). Copyright 2018 American Chemical Society.
Figure 72
Figure 72
Schematic presentation of the pH-driven equilibrium between the ring-closed (HL-c) and ring-opened (HL-o) forms of the rhodamine 6G salicylaldehyde hydrazone ligand and its subsequent reaction with Dy(III) towards [DyIII(L-c)2(MeOH)2](ClO4) molecule (1) and its further grinded form of 1G (a), the structural view for the complex 1 (b), the frequency dependences of the out-of-phase ac magnetic susceptibility for 1 and 1G at the indicated temperatures (c), and the visualization of the reversible color change occurring upon grinding and solvent fuming, shown together with the micrographs of the compound 1 under indicated sequence of modulated external pressure (d). Parts (a), (c) and (d) were adapted with permission from ref (1100). Copyright 2021 American Chemical Society.
Figure 73
Figure 73
The structure of [FeII2(L-N4dte)3](ClO4)4·(solvent) (L-N4dte = 1,2-bis(5-(2-(pyrazol-3-yl)-pyridin-5-yl)-2-methylthiophen-3-yl)cyclopentene) dinuclear molecule (a), electronic absorption spectra of the [FeII2(L-N4dte)3]4+ ions in methanol and their evolution under UV light irradiation (left part), and the evolution of the absorption spectrum for the UV light irradiated solution under the subsequent visible light irradiation (right part) (b), the temperature dependences of the χMT product in the solid state for the methanolic solvate of the compound (left part) and the analogous curves for the compound dissolved in the methanol solution (right part), for both cases before and after UV light irradiation, shown together with the partial LIESST effect in the solid state at 10 K (left inset) and the photoreversibility in the solution at 298 K (right inset) (c), and room-temperature fluorescence spectra of these molecular cations in the methanolic solution gathered using the 290 nm light excitation upon the exposition to the UV irradiation (left part) and after the subsequent exposition to visible light (right part) (d). Parts (b), (c), and (d) were adapted with permission from ref (267). Copyright 2017 John Wiley & Sons.
Figure 74
Figure 74
The structure of (N(CH3)4)6K3H7{[DyIII(tart)(α-PW11O39)]2}·27H2O (tart = tartrate) coordination system (a), the temperature dependences of the imaginary part of the ac magnetic susceptibility under the 4 kOe dc field (left part), shown together with the temperature dependence of the resulting relaxation time (right part) (b), time evolution of the solid-state diffuse reflectance absorption spectra under the Xe lamp irradiation, shown together with the related decay curve for the reflectivity at 605 nm (c), and time evolution of the emission spectra upon the 367 nm excitation, also under the Xe lamp irradiation, present with its recovery on exposure to air for 5 days (d). Parts (b), (c), and (d) were reproduced from ref (662) with permission from the Royal Society of Chemistry.
Figure 75
Figure 75
The structure of [DyIII(depma)(NO3)3(hmpa)2] (depma = 9-diethylphosphonomethylanthracene; hmpa = hexamethylphosphoramide) metal complex and the photogenerated dinuclear species from two such complexes (a), time evolution of the emission spectra under the 365 nm light excitation and after thermal recovery at 100°C, shown with the CIE 1931 chromaticity diagram illustrating emission color change due to photodimerization (b), and the temperature-variable frequency dependencies of the ac magnetic susceptibility before (left side) and after irradiation (right side) under the 500 Oe dc field (c). Parts (b) and (c) were adapted with permission from ref (1128). Copyright 2018 John Wiley & Sons.
Figure 76
Figure 76
The representative structural view on chiral {[MnII(bmeep)]2[WIV(CN)8]}·10H2O (bmeep = 2,6-bis[1-(2-(N-methylamino)ethylimino)ethyl]pyridine) coordination network (a), the time evolution curves of the χMT product for the hydrated (orange) and fully dehydrated (red) phases under the 450 nm light irradiation at 10 K, shown alongside the field-cooled and zero-field-cooled magnetization curves for the anhydrous phase of this compound before and after irradiation with the 450 nm light (b). Part (b) was reproduced from ref (948) with permission from the Royal Society of Chemistry.
Figure 77
Figure 77
The structure of polar {[DyIII(phen)2(NO3)(H2O)][FeII(CN)5(NO)]}·3H2O (phen = 1,10-phenanthroline) coordination chains, presented together with the scheme of the observed photoinduced flip-flop isomerization of the nitrosyl group of a nitroprusside fragment (a), the angular dependence of the SH intensity at T = 100 K, measured before photoirradiation (black circles), after the 473 nm irradiation (blue circles), and after the 804 nm irradiation (orange squares). Adapted with permission from ref (531). Copyright 2021 American Chemical Society.
Figure 78
Figure 78
The structure of (+)-{[FeII(4-Brpy)4]2[NbIV(CN)8]}·2H2O (4-Brpy = 4-bromopyridine) coordination network (a), the temperature dependence of the χMT product for the powder sample at 5 kOe, shown with the temperature dependence of the SH intensity for the single crystal (b), the magnetization versus temperature curves for in the dark, after irradiation by the 473 nm light, and further irradiation with the 785 nm light, together with several cycles of alternating irradiation at 5 K (c), the SH intensity versus θ (analyzer rotation angle) plots for the phases produced by the 473 nm (upper part) and 785 nm (lower part) light irradiation at 2 K (d), and the illustration of the SH polarization plane switching (e). In (e), the left small panel shows the magnetic field dependence of the SH intensity for the 473 nm light irradiated phase while the right small panel represents the SH intensity switching at θ = 0° by alternate irradiation with the 473 and 785 nm light sources. Parts (b), (c), (d), and (e) were reproduced with permission from ref (143) under terms of the CC-BY license. Copyright 2014 Springer Nature.
Figure 79
Figure 79
The structure of chiral {[YbIII(facam)3]2(bphenTTF)} (facam = 3-trifluoroacetyl-(+)-camphorate, bphenTTF = bis(1,10-phenantro[5,6b])tetrathiafulvalene) dinuclear molecule (a), its temperature-variable frequency-dependencies of the imaginary part of the ac magnetic susceptibility under 1200 Oe (b), and room-temperature NIR CPL spectra for both enantiomers (related to the chirality of the facam ligand) in the dichloromethane solution upon the 300 nm excitation (upper part), shown together with the analogous spectra in solid state upon the 360 nm excitation (bottom part) (c). Parts (b) and (c) were adapted with permission from ref (1010). Copyright 2021 John Wiley & Sons.
Figure 80
Figure 80
The structure of chiral [DyIII(hfac)3((S)-L4)] (hfac = 1,1,1,5,5,5-hexafluoroacetylacetonate; (S)-L = the (S) enantiomer of the binaphthyl-2,2′-diyl (BINOL) phosphate-type ligand, shown in the (b) part) coordination chain incorporating the Dy(III) complexes of the SMM character (a), the set of BINOL-derived ligands used for the construction of chiral luminescent Dy(III)-based chains (analogous to this presented in the (a) part) (b), representative excitation and emission spectra of two enantiomorphic Dy(III)-based chains incorporating (S)-L3 and (upper part) and (S)-L4 (bottom part) ligands (c), and the set of electronic absorption spectra (upper part) and electronic circular dichroism (ECD; bottom part) spectra for (S/R)-L4 (light green lines) and {[DyIII(hfac)3((S/R)-L4)] (dark green lines) (d). Parts (b), (c), and (d) were reproduced from ref (777) with permission from the Royal Society of Chemistry.
Figure 81
Figure 81
The structure of chiral polar [DyIIIZnII((R,R)-debnbp)(OAc)(NO3)2] ((R,R)-debnbp = the (R,R) enantiomer of the 2,2′[2,2-diphenyl-1,2-ethanediyl]bis[(E)-nitrilomethylidyne]bis(6-methoxy)phenol ligand; OAc = acetate) dinuclear molecule (a), emission spectra acquired at room temperature and at 12 K upon the 365 nm excitation for both enantiomers of the molecules (b), ferroelectric hysteresis loops measured at indicated temperatures on the selected single crystal of this compound (c), the temperature-variable frequency dependences of the imaginary part of the ac magnetic susceptibility at the 1500 Oe dc field (d). Parts (b), (c), and (d) were adapted with permission from ref (833). Copyright 2015 John Wiley & Sons.
Figure 82
Figure 82
The structure of polar (pyrH)[MnIIBr3] (pyrH = pyrrolidinium) molecular hybrid below the critical temperature of ferroelectric ordering (a), the ferroelectric hysteresis loops measured at various indicated temperatures along the c axis of the selected single crystal, shown together with the temperature dependence of spontaneous polarization and pyroelectric current measured also along the c axis (b), the UV–vis absorption spectrum and temperature-variable emission spectra (c), and the magnetization versus field hysteresis loop at 1.9 K (d). Parts (b), (c), and (d) were adapted with permission from ref (1027). Copyright 2015 John Wiley & Sons.
Figure 83
Figure 83
The structure of {[FeII(pyrz)4]2[NbIV(CN)8]}·4H2O (pyrz = pyrazole) coordination network (a), the pressure dependence of the averaged metal-nitrogen distances for this Fe(II)-based framework and its Mn(II) analog at room temperature (b), the pressure-variable temperature dependences of the χMT product for the Fe(II)-based compound (c), its time evolution of magnetization upon the 473 nm irradiation at 2 K under 0.6 GPa (d), and the related field-cooled magnetization curves (e). Parts (b), (c), (d), and (e) were adapted with permission from ref (144). Copyright 2015 American Chemical Society.
Figure 84
Figure 84
The structure of chiral {[CoII((R)-pabn)][FeIII(Tp)(CN)3]}(BF4)·MeOH·H2O ((R)-pabn = (R)-N(2),N(2′)-bis(pyridin-2-ylmethyl)-1,1′-binaphtyl-2,2′-diamine; Tp = hydrotris (pyrazol-1-yl)borate) coordination chain (a), the temperature dependence of the χMT product for the hydrated phase of this compound before irradiation (blue points) and after the 808 nm irradiation (red points), shown together with the temperature dependences of the out-of-phase ac magnetic susceptibility for the indicated field frequencies (the inset) (b), and the temperature dependences of the dc electrical conductivity overlapped with the temperature dependence of the χMT product showing the hysteretic ETCST effect (c). Parts (b) and (c) were reproduced with permission from ref (238) under terms of the CC-BY license. Copyright 2012 Springer Nature.
Figure 85
Figure 85
The representative structural views on (H5O2)2{(H)[YbIII(hmpa)4][CoIII(CN)6]2}·0.2H2O (hmpa = hexamethylphosphoramide) molecular system (a), the temperature dependence of the magnetic relaxation time under the 1000 Oe dc field, shown together with the corresponding field dependence at 2 K (b), the correlation between observed proton conductivity and the overall number of water molecules per molecular unit (left) and the temperature dependence of proton conductivity at 90% of relative humidity (right) (c), temperature variable NIR emission spectra upon the 320 nm excitation, shown together with thermometric curves for three selected emission intensity ratios (d). Parts (b), (c), (d), and (e) were adapted with permission from ref (239). Copyright 2020 American Chemical Society.
Figure 86
Figure 86
The structure of [DyIII(SCN)3(depma)2(4-OHpy)2] (depma = 9-diethylphosphonomethylanthracene; 4-OHpy = 4-hydroxypyridine) complex at 193 K (LT) and 300 K (RT) (a), emission spectra upon the 365 nm excitation of the pristine compound at 193 K (1LT), at 300 K before (1RT) and after the 365 nm light irradiation (1UV), and at 300 K after thermal relaxation at 393 K (1R) (b), the temperature dependences of dielectric constant for the pristine material (1), after its irradiation at 300 K with the 365 nm light (1UV), and after the thermal relaxation at 393 K (1R) (c), and magnetization versus field curves for 1 and 1UV (d). Parts (b), (c), and (d) were reproduced from ref (657) with permission from the Royal Society of Chemistry.
Figure 87
Figure 87
The optical, magnetic, electrical, and magneto-electric characteristics of chiral polar [YbIIIZnII((R,R)-debnbp)(OAc)(NO3)2] ((R,R)-debnbp = the (R,R) enantiomer of 2,2′[2,2-di-phenyl-1,2-ethanediyl]bis[(E)-nitrilomethylidyne]bis(6-methoxy)phenol ligand; OAc = acetate) molecule (the structure is analogous to shown in Figure 81 for the {DyIIIZnII} derivative), including temperature-variable frequency dependences of the ac magnetic susceptibility under the 600 Oe dc field (a), room-temperature excitation and emission spectra for both enantiomers (b), piezoresponse hysteresis loops obtained at zero and under applied magnetic fields of ±1 kOe for the single crystal (c), magnetic-field variable displacement representing the magnetostriction effect (d), and the magnetic-field dependence of normalized piezoresponse representing six remanent polarization states accessible by applying magnetic and electric fields (e). Reproduced with permission from ref (1028). Copyright 2020 American Association for the Advancement of Science.

References

    1. Coronado E. Molecular Magnetism: From Chemical Design to Spin Control in Molecules, Materials and Devices. Nat. Rev. Mater. 2020, 5, 87–104. 10.1038/s41578-019-0146-8. - DOI
    1. Perlepe P.; Oyarzabal I.; Mailman A.; Yquel M.; Platunov M.; Dovgaliuk I.; Rouzieres M.; Negrier P.; Mondieig D.; Suturina E. A.; et al. Metal-Organic Magnets with Large Coercivity and Ordering Temperatures up to 242°C. Science 2020, 370, 587–592. 10.1126/science.abb3861. - DOI - PubMed
    1. Coey J. M. D. Perspective and Prospects for Rare Earth Permanent Magnets. Engineering 2020, 6, 119–131. 10.1016/j.eng.2018.11.034. - DOI
    1. Shao Z.; Ren S. Rare-Earth-Free Magnetically Hard Ferrous Materials. Nanoscale Adv. 2020, 2, 4341–4349. 10.1039/D0NA00519C. - DOI - PMC - PubMed
    1. Talaat A.; Suraj M. V.; Byerly K.; Wang A.; Wang Y.; Lee J. K.; Ohodnicki Jr P. R. Review on Soft Magnetic Metal and Inorganic Oxide Nanocomposites for Power Applications. J. Alloys Compd. 2021, 870, 159500.10.1016/j.jallcom.2021.159500. - DOI