. 2024 Apr 30:8:e53441.
doi: 10.2196/53441.

Precision Assessment of Real-World Associations Between Stress and Sleep Duration Using Actigraphy Data Collected Continuously for an Academic Year: Individual-Level Modeling Study

Affiliations

Precision Assessment of Real-World Associations Between Stress and Sleep Duration Using Actigraphy Data Collected Continuously for an Academic Year: Individual-Level Modeling Study

Constanza M Vidal Bustamante et al. JMIR Form Res. .

Abstract

Background: Heightened stress and insufficient sleep are common in the transition to college, often co-occur, and have both been linked to negative health outcomes. A challenge concerns disentangling whether perceived stress precedes or succeeds changes in sleep. These day-to-day associations may vary across individuals, but short study periods and group-level analyses in prior research may have obscured person-specific phenotypes.

Objective: This study aims to obtain stable estimates of lead-lag associations between perceived stress and objective sleep duration in the individual, unbiased by the group, by developing an individual-level linear model that can leverage intensive longitudinal data while remaining parsimonious.

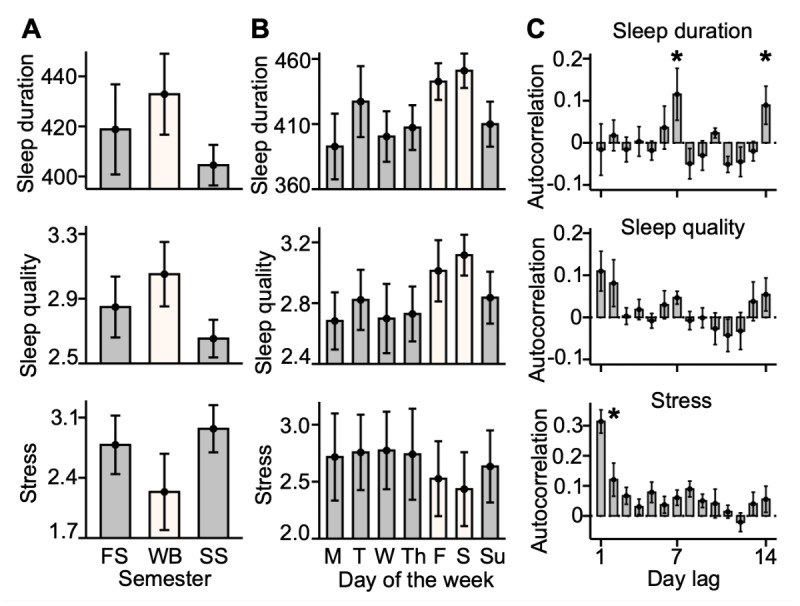
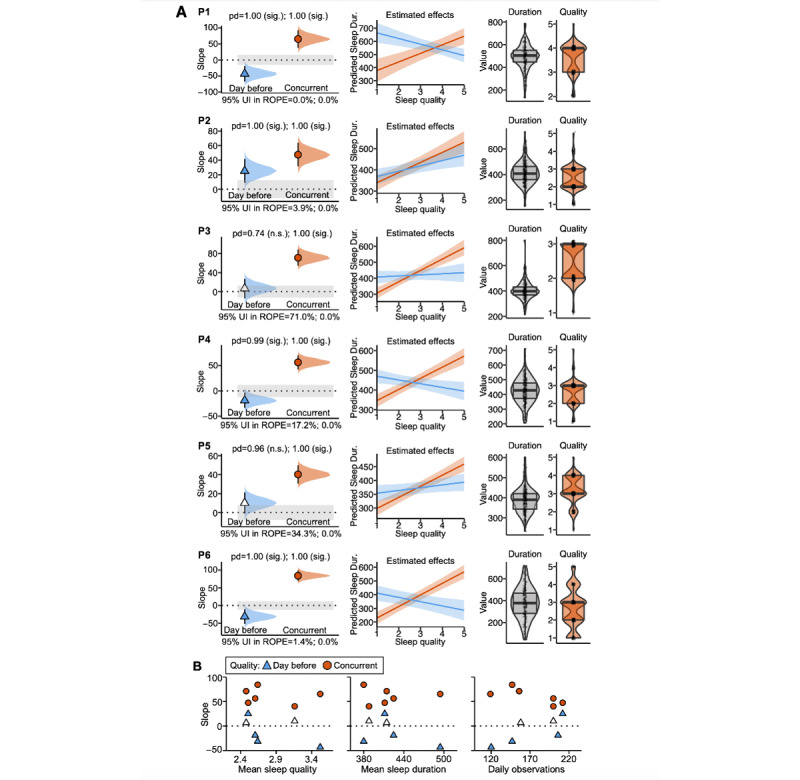
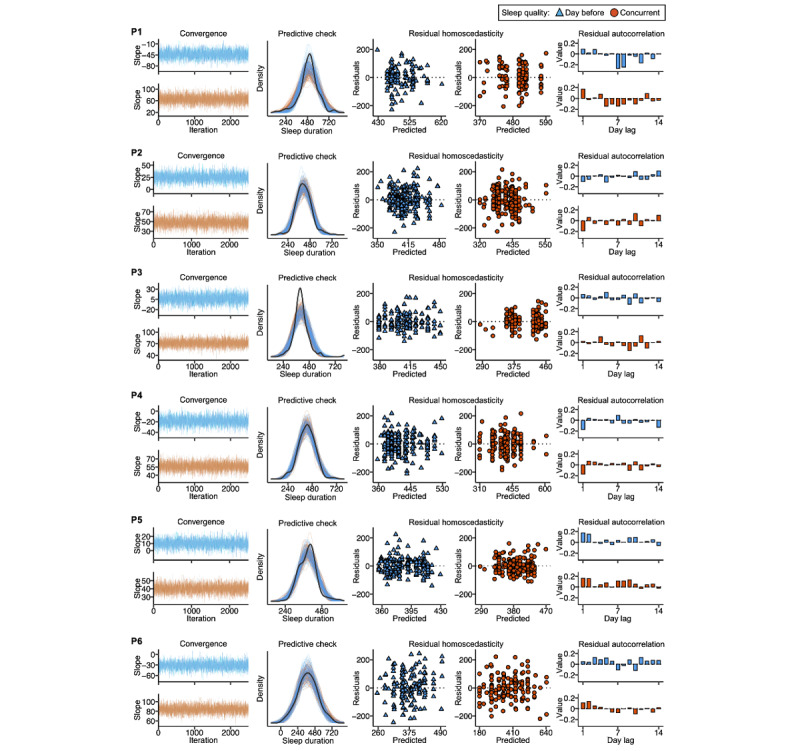
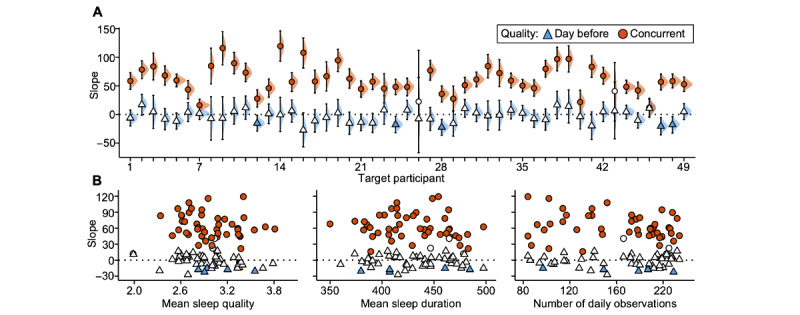
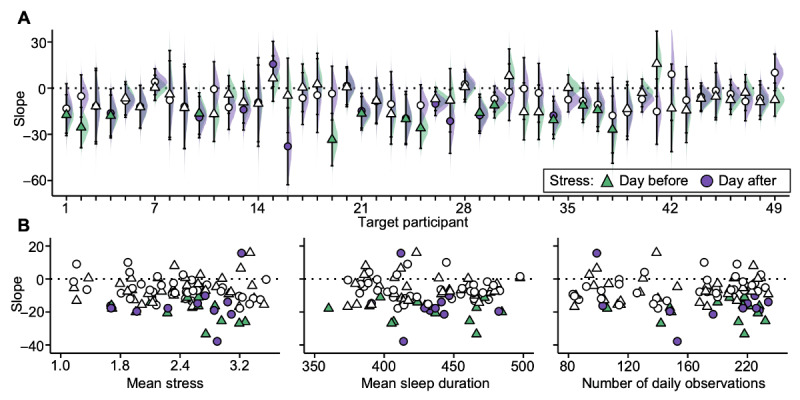
Methods: In total, 55 college students (n=6, 11% second-year students and n=49, 89% first-year students) volunteered to provide daily self-reports of perceived stress via a smartphone app and wore an actigraphy wristband for the estimation of daily sleep duration continuously throughout the academic year (median usable daily observations per participant: 178, IQR 65.5). The individual-level linear model, developed in a Bayesian framework, included the predictor and outcome of interest and a covariate for the day of the week to account for weekly patterns. We validated the model on the cohort of second-year students (n=6, used as a pilot sample) by applying it to variables expected to correlate positively within individuals: objective sleep duration and self-reported sleep quality. The model was then applied to the fully independent target sample of first-year students (n=49) for the examination of bidirectional associations between daily stress levels and sleep duration.

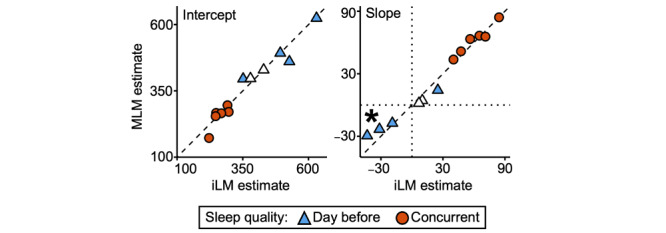
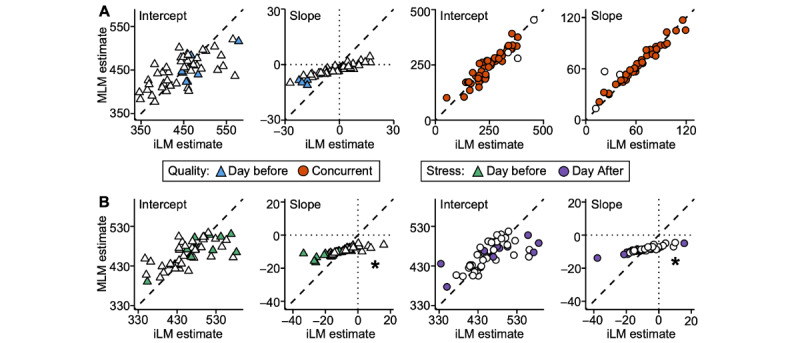
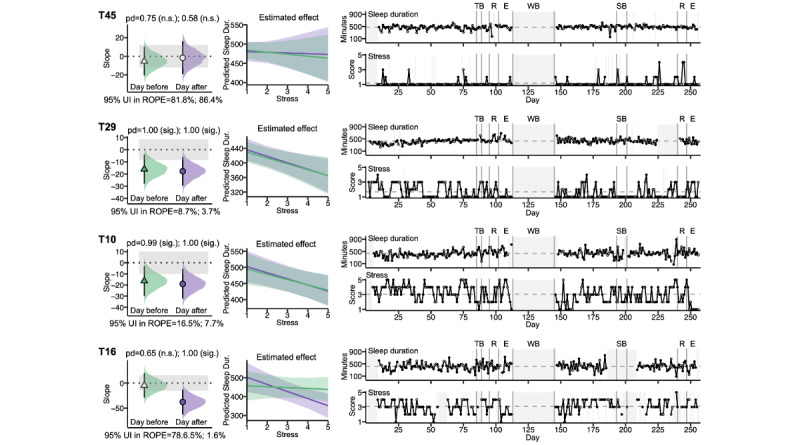
Results: Proof-of-concept analyses captured expected associations between objective sleep duration and subjective sleep quality in every pilot participant. Target analyses revealed negative associations between sleep duration and perceived stress in most of the participants (45/49, 92%), but their temporal association varied. Of the 49 participants, 19 (39%) showed a significant association (probability of direction>0.975): 8 (16%) showed elevated stress in the day associated with shorter sleep later that night, 5 (10%) showed shorter sleep associated with elevated stress the next day, and 6 (12%) showed both directions of association. Of note, when analyzed using a group-based multilevel model, individual estimates were systematically attenuated, and some even reversed sign.

Conclusions: The dynamic interplay of stress and sleep in daily life is likely person specific. Paired with intensive longitudinal data, our individual-level linear model provides a precision framework for the estimation of stable real-world behavioral and psychological dynamics and may support the personalized prioritization of intervention targets for health and well-being.

Keywords: accelerometer; actigraphy; deep phenotyping; digital health; individualized models; intensive longitudinal data; mobile phone; sleep; stress; wearable.


Conflict of interest statement

Conflicts of Interest: J-PO is a cofounder and board member of Phebe Health, a commercial entity that operates in digital phenotyping. JTB has received consulting fees from Verily Life Sciences as well as consulting fees and equity from Mindstrong for work unrelated to this study. RLB has received consulting fees from Pfizer, Roche, Alkermes, and Cognito for work unrelated to this study. All other authors declare no other conflicts of interest.

Figures

Figure 1
Figure 1
Group sleep and stress metrics fluctuate with the academic calendar. (A) The pilot participants’ group (between-person) means of sleep duration (in min), sleep quality (1-5 Likert scale), and perceived stress (1-5 Likert scale), aggregated by school semester (fall and spring) and winter break and (B) by the day of the week. (C) Between-person means of autocorrelation estimates over a 14-day window. Error bars show SE of the mean. *Autocorrelations were strongest at a 7-day lag (and again at a 14-day lag) for sleep duration and at 1-day and 2-day lags for perceived stress. F: Friday; FS: fall semester; M: Monday; S: Saturday; SS: spring semester; Su: Sunday; T: Tuesday; Th: Thursday; W: Wednesday; WB: winter break.
Figure 2
Figure 2
Within-individual linear models capture real-world associations between objective sleep duration and subjective sleep quality. (A) Each row (from participant 1 [P1] to participant 6 [P6]) shows model results for an individual pilot participant. Individual-level models testing sleep duration associated with sleep quality the day before are displayed in blue; models testing sleep duration associated with concurrent sleep quality are displayed in orange. Column 1 shows the models’ estimated slopes (computed as the median of the posterior distribution) and uncertainty metrics. Symbol shading signifies statistically significant slopes. Error bars show 95% uncertainty intervals (UIs). Shaded density plots show the full posterior distributions of the slopes; gray shaded areas show the regions of practical equivalence (ROPEs). Column 2 shows the models’ predicted sleep duration as a function of sleep quality; shading around the lines indicates 95% UIs. Column 3 shows the participant-level distributions of sleep duration (in min) and sleep quality (1-5 Likert scale) across all daily observations used in analysis. (B) Slope estimates from column 1 in subpart A are plotted against participant-level estimates across the study period. Dur.: duration; n.s.: not statistically significant; pd: probability of direction; sig.: statistically significant.
Figure 3
Figure 3
Within-individual model diagnostics suggest adequate convergence and specification. Each row (from participant 1 [P1] to participant 6 [P6]) shows model diagnostics for an individual pilot participant. Diagnostics for the models assessing the association between sleep duration and sleep quality the day before are displayed in blue; models assessing the association between sleep duration and concurrent sleep quality are displayed in orange. Column 1’s trace plots display time series of each Markov chain’s estimated slope (y-axis) as a function of postwarmup iterations (x-axis). Column 2 shows posterior predictive checks; black density lines show the observed distributions of the outcome (sleep duration), and the thin colored density lines show 100 replicated outcome distributions generated based on random samples from the models’ parameters’ posterior distributions. Columns 3 and 4 show the models’ predicted values (x-axis) against the models’ residuals (y-axis). Column 5 shows autocorrelation plots of model residuals.
Figure 4
Figure 4
Within-individual linear models of the association between sleep duration and sleep quality yield similar, but not identical, estimates to a group-based linear model. Estimates of the intercepts and slopes from the individual-level linear models (iLMs; x-axis) for each participant are compared to the random effects estimated from a group-based multilevel linear model (MLM; y-axis). Triangles show estimates for the models examining the association between sleep duration and sleep quality the day before; circles show estimates for the models examining the association between sleep duration and concurrent sleep quality. Symbol shading signifies statistically significant slopes in the iLMs. Dashed diagonal lines represent identical estimates between the individual- and group-based approaches. *Attenuation of individual estimates in the MLM compared to the iLMs.
Figure 5
Figure 5
Longer objective sleep duration associates with higher subjective sleep quality in most individuals. (A) Estimated slopes (corresponding to the median of the posterior distribution) from the individual-level models that assess sleep duration associated with sleep quality the day before (triangles) and with concurrent sleep quality (circles) are plotted along the y-axis ordered by participant (x-axis). Statistically significant slope estimates are shaded blue (day before) or orange (concurrent). Error bars show 95% uncertainty intervals, and shaded density plots show the full posterior distributions of the slopes. (B) Slope estimates from subpart A are plotted against participant-level estimates across the study period.
Figure 6
Figure 6
Higher subjective stress associates with shorter objective sleep duration in most individuals. (A) Estimated slopes (corresponding to the median of the posterior distribution) from the individual-level models that assess sleep duration associated with stress the day before (triangles) and with stress the day after (circles) are plotted along the y-axis ordered by participant (x-axis). Statistically significant slope estimates are shaded green (day before) or purple (concurrent). Error bars show 95% uncertainty intervals, and shaded density plots show the full posterior distributions of the slopes. (B) Slope estimates from subpart A are plotted against each participant-level estimate across the study period.
Figure 7
Figure 7
Estimates of the intercepts and slopes from the individual-level linear models (iLMs; x-axis) for each participant are compared to the random effects estimated from a group-based multilevel linear model (MLM; y-axis) and presented separately for (A) associations between sleep duration and sleep quality and (B) associations between stress and sleep duration (bottom row). Symbol shading signifies statistically significant slopes in the iLMs. Dashed diagonal lines represent identical estimates between the individual- and group-based approaches. *Attenuation of individual estimates in the MLM compared to the iLMs.
Figure 8
Figure 8
Intensive within-individual longitudinal data reveal differences among individuals. Results are shown for individual-level models testing the association between sleep duration and stress the day before (green) and between sleep duration and stress the day after (purple). Column 1 shows the models’ estimated slopes (computed as the median of the posterior distribution) and uncertainty metrics. Symbol shading signifies statistically significant slopes. Error bars show 95% uncertainty intervals (UIs). Shaded density plots show the full posterior distributions of the slopes; gray shaded areas show the regions of practical equivalence (ROPEs). Column 2 shows the models’ predicted sleep duration as a function of stress; shading around the lines indicates 95% UIs. The time series panels in column 3 show daily observations of actigraphy-derived sleep duration and survey-based perceived stress. Gray dashed lines show the participant’s mean value across the study period. Vertical lines indicate landmark events (labeled) in the academic calendar. Gray shading indicates missing data during the school terms or the winter break, which were excluded from the individual-level linear models. Dur.: duration; E: examinations period; n.s.: not statistically significant; pd: probability of direction; R: reading period; SB: spring break; sig.: statistically significant; TB: Thanksgiving break; WB: winter break.

Similar articles

References

    1. Dyson R, Renk K. Freshmen adaptation to university life: depressive symptoms, stress, and coping. J Clin Psychol. 2006 Oct;62(10):1231–44. doi: 10.1002/jclp.20295. - DOI - PubMed
    1. Ross SE, Niebling C, Heckert TM. Sources of stress among college students. Coll Stud J. 1999;33(2):312–8.
    1. Taylor ZE, Doane LD, Eisenberg N. Transitioning from high school to college: relations of social support, ego-resiliency, and maladjustment during emerging adulthood. Emerg Adulthood. 2013 Oct 21;2(2):105–15. doi: 10.1177/2167696813506885. - DOI
    1. Bose M, Oliván B, Laferrère B. Stress and obesity: the role of the hypothalamic-pituitary-adrenal axis in metabolic disease. Curr Opin Endocrinol Diabetes Obes. 2009 Oct;16(5):340–6. doi: 10.1097/MED.0b013e32832fa137. https://europepmc.org/abstract/MED/19584720 - DOI - PMC - PubMed
    1. Kendler KS, Hettema JM, Butera F, Gardner CO, Prescott CA. Life event dimensions of loss, humiliation, entrapment, and danger in the prediction of onsets of major depression and generalized anxiety. Arch Gen Psychiatry. 2003 Aug 01;60(8):789–96. doi: 10.1001/archpsyc.60.8.789.60/8/789 - DOI - PubMed

LinkOut - more resources