. 2024 Apr 30;9(10):e176497.
doi: 10.1172/jci.insight.176497.

Increased hepatic glucose production with lower oxidative metabolism in the growth-restricted fetus

Affiliations

Increased hepatic glucose production with lower oxidative metabolism in the growth-restricted fetus

Laura D Brown et al. JCI Insight. .

Abstract

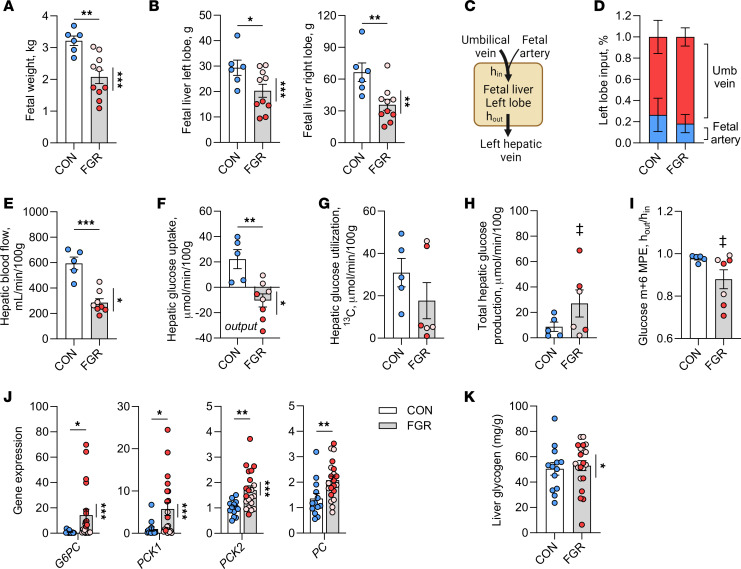
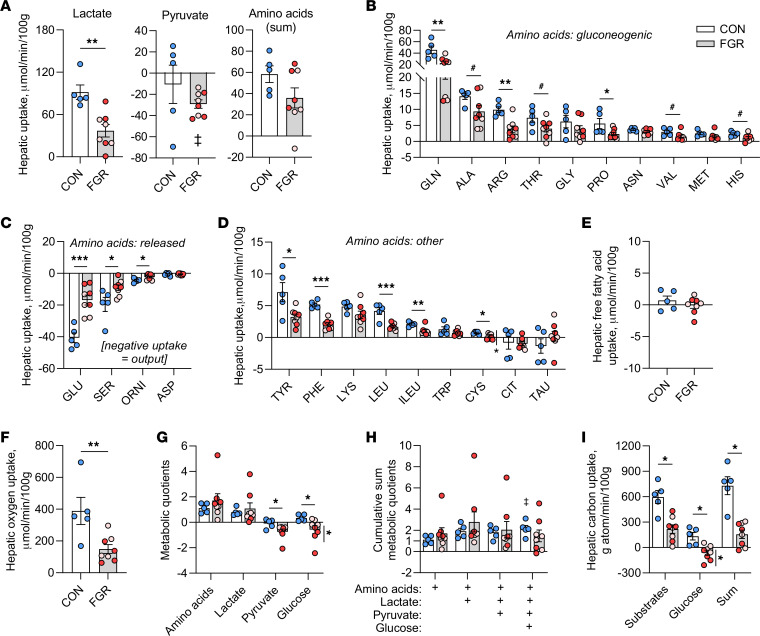
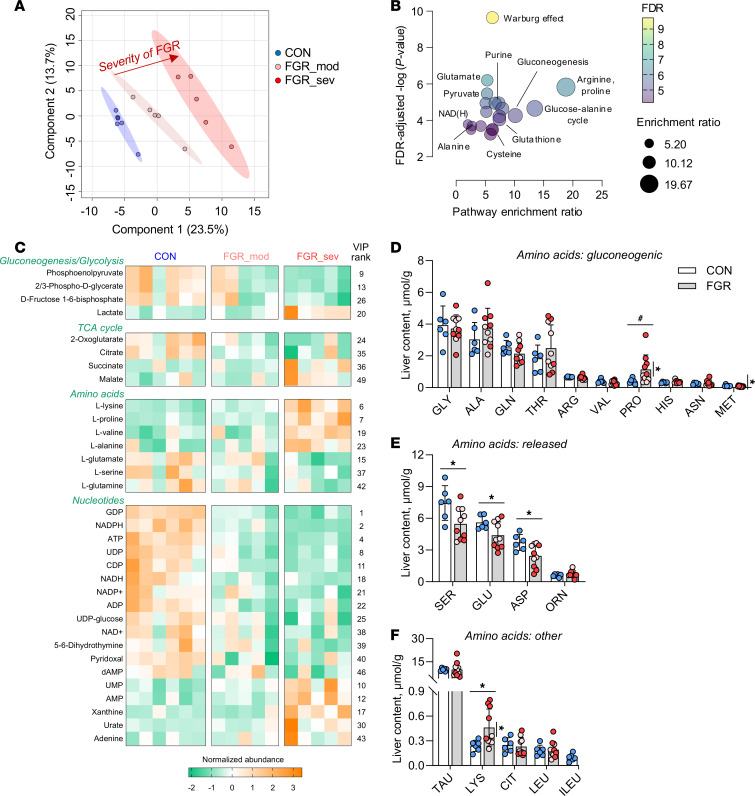
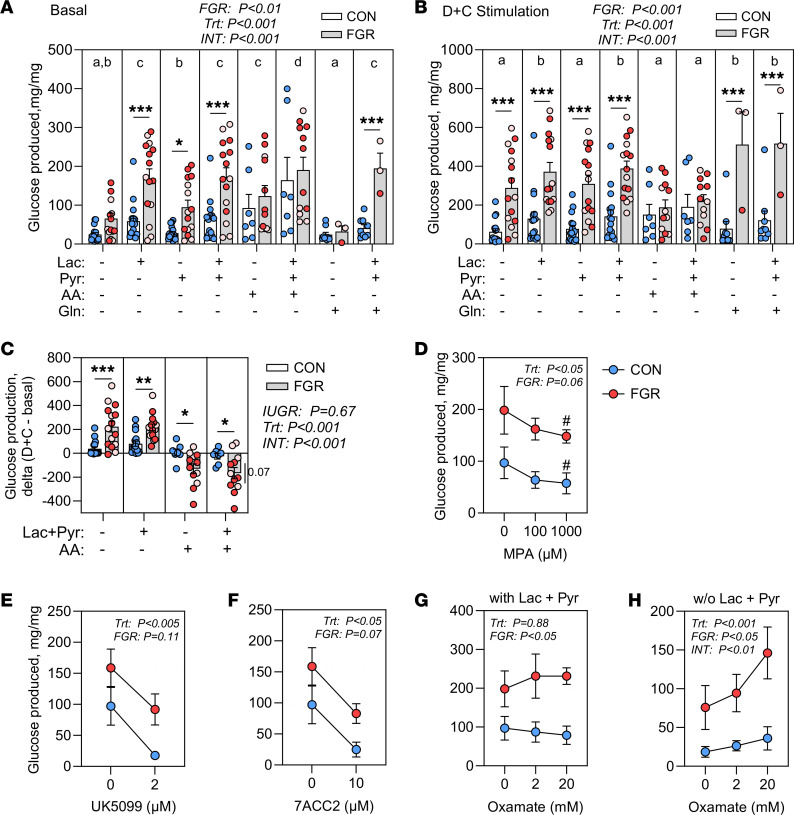
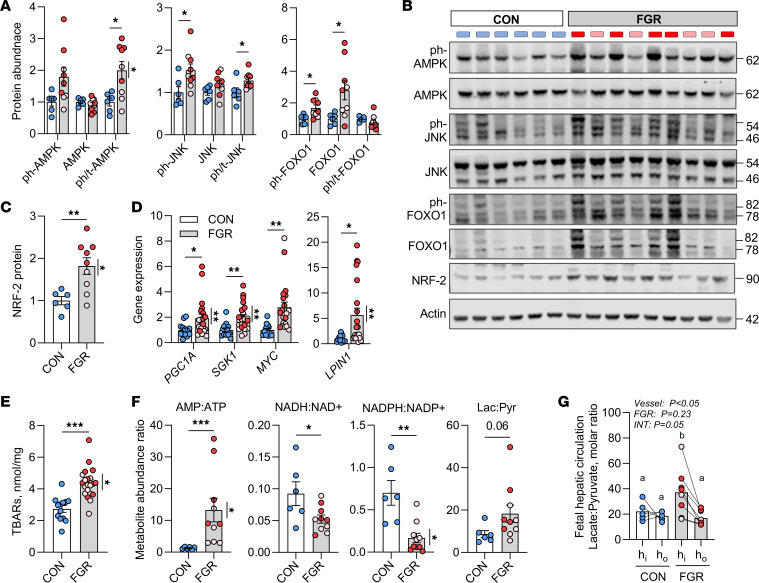
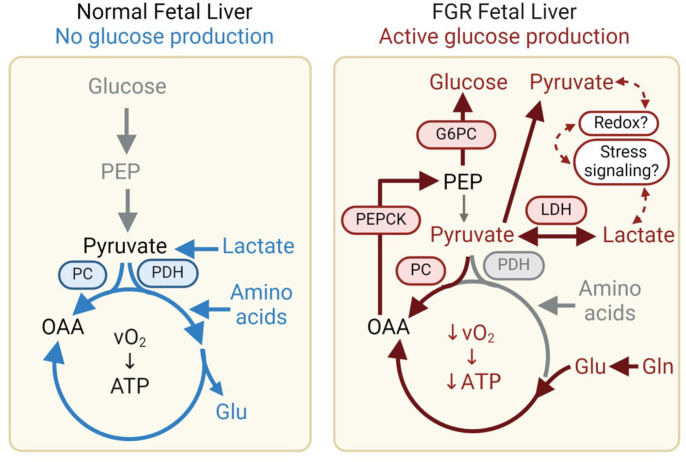
Fetal growth restriction (FGR) is accompanied by early activation of hepatic glucose production (HGP), a hallmark of type 2 diabetes (T2D). Here, we used fetal hepatic catheterization to directly measure HGP and substrate flux in a sheep FGR model. We hypothesized that FGR fetuses would have increased hepatic lactate and amino acid uptake to support increased HGP. Indeed, FGR fetuses compared with normal (CON) fetuses had increased HGP and activation of gluconeogenic genes. Unexpectedly, hepatic pyruvate output was increased, while hepatic lactate and gluconeogenic amino acid uptake rates were decreased in FGR liver. Hepatic oxygen consumption and total substrate uptake rates were lower. In FGR liver tissue, metabolite abundance, 13C-metabolite labeling, enzymatic activity, and gene expression supported decreased pyruvate oxidation and increased lactate production. Isolated hepatocytes from FGR fetuses had greater intrinsic capacity for lactate-fueled glucose production. FGR livers also had lower energy (ATP) and redox state (NADH/NAD+ ratio). Thus, reduced hepatic oxidative metabolism may make carbons available for increased HGP, but also produces nutrient and energetic stress in FGR liver. Intrinsic programming of these pathways regulating HGP in the FGR fetus may underlie increased HGP and T2D risk postnatally.

Keywords: Gluconeogenesis; Reproductive biology.


Conflict of interest statement

Conflict of interest: The authors have declared that no conflict of interest exists.

Figures

Figure 1
Figure 1. Decreased hepatic blood flow and increased hepatic glucose production in FGR fetuses.
(A) Fetal weight in CON and FGR groups. Dashed line at 2 kg indicates the separation between moderate (light pink) and severe (dark red) FGR. (B) Fetal left and right lobe liver weights. (C) Left hepatic catheterization method showing input (hin) and output (hout) across the left lobe. (D) Percentage contribution of umbilical vein and fetal artery blood supply to the left lobe. (E) Fetal hepatic blood flow normalized per 100 g of liver weight. (F) Net hepatic glucose uptake. (G) Hepatic glucose utilization. (H) Total hepatic glucose production (sum of utilization and net uptake). (I) Glucose tracer enrichment (m+6 MPE) ratio across the fetal liver. (J) Expression of gluconeogenic genes in liver tissue. (K) Hepatic tissue glycogen content. Means ± SEM are shown (n = 5–6 CON, 10 FGR in panels AI and n = 13 CON, 21 FGR in panels J and K). Results comparing CON (white bar) versus FGR (gray bar) groups were analyzed by 2-tailed Student’s t test, except panel I, where a Welch’s t test was used. In panels H and I, a 1-sample Wilcoxon test was used to test whether each group was greater than zero (panel H) or less than 1.0 (panel I) and differences are indicated with a double dagger. Weight-threshold differences comparing moderate versus severe FGR were analyzed by 2-tailed Student’s t test and are indicated by a vertical line. ‡P < 0.05; *P < 0.05; **P < 0.01, ***P < 0.001.
Figure 2
Figure 2. Lower hepatic uptake of carbon substrates and oxygen consumption in FGR fetus.
(A) Net hepatic lactate, pyruvate, and sum of all individual amino acid uptake rates measured in CON and FGR fetuses. Individual amino acids uptake rates are grouped as those that are (B) considered gluconeogenic, (C) normally released by the fetal liver, and (D) all other amino acids. (E) Net hepatic free fatty acid uptake. (F) Hepatic oxygen consumption rates. (G) Hepatic nutrient/oxygen metabolic quotients. (H) Cumulative sums of metabolic quotients. (I) The net carbon uptake of substrates (defined as sum of lactate, pyruvate, and all amino acids), glucose, and the sum of substrates plus glucose. (I) Means ± SEM are shown (n = 5 CON, 10 FGR). Results comparing CON (white bar) versus FGR (gray bar) groups were analyzed by 2-tailed Student’s t test. Weight-threshold differences comparing moderate (light pink) versus severe (dark red) FGR were analyzed by 2-tailed Student’s t test and are indicated by a vertical line. *P < 0.05; **P < 0.01, ***P < 0.001, #P < 0.15.
Figure 3
Figure 3. Hepatic tissue metabolites and amino acids.
Targeted metabolomic profiling with relative quantification in CON and FGR liver samples. (A) PLS-DA plot showing separation between groups. (B) Pathway enrichment analysis using the top 50 metabolites with the highest VIP scores and plotting enrichment ratios and FDR-adjusted significance (P < 0.00007). Pathways of interest are labeled. (C) Heatmap showing relative normalized abundance of metabolites within the major pathways. VIP rank from component 1 is shown. The hepatic tissue content of individual amino acids is shown for amino acids that are (D) gluconeogenic, (E) normally released by the fetal liver, and (F) all other amino acids. Means ± SEM are shown (n = 5–6 CON, 10 FGR). Results comparing CON (white bar) versus FGR (gray bar) groups were analyzed by 2-tailed Student’s t test. Weight-threshold differences comparing moderate (light pink) versus severe (dark red) FGR were analyzed by 2-tailed Student’s t test and are indicated by a vertical line. *P < 0.05; #P < 0.15.
Figure 4
Figure 4. Amino acid, pyruvate, and lactate metabolism.
(A) Gene expression in CON and FGR liver tissue. (B) Hepatic PDH and LDH activity. 13C-labeling of metabolites in liver tissue representing (C) PDH flux (ratio of m+2 citrate relative to m+3 lactate) and (D) lactate production (m+3 lactate relative to m+6 glucose). (E) Hepatic (in vivo) glucose oxidation rate. (F) Hepatic lactate utilization rate. (G) Endogenous hepatic lactate production rate (difference between lactate utilization in panel F and net hepatic uptake in Figure 2A). (H) Ratio of 13C-lactate (m+3) measured across the fetal hepatic circulation (hout/hin). (I) Glucose m+3 enrichment (MPE) measured in hepatic output (hout). (J) Plasma glucose m+6 enrichment (MPE) measured in hepatic input (hin). Means ± SEM are shown (n = 13 CON, 21 FGR in panels A and B and n = 5 CON, 7–10 FGR in panels CH). Results comparing CON (white bar) versus FGR (gray bar) groups were analyzed by 2-tailed Student’s t test. Weight-threshold differences comparing moderate (light pink) versus severe (dark red) FGR were analyzed by 2-tailed Student’s t test and are indicated by a vertical line. *P < 0.05; **P < 0.01, ***P < 0.001.
Figure 5
Figure 5. Glucose production in isolated fetal hepatocytes.
Glucose production measured in isolated primary hepatocytes from CON (n = 16) and FGR (n = 15) fetuses under (A) basal or (B) stimulated conditions with dexamethasone and cAMP (D+C). Substrates were provided: 20 mM lactate (Lac), 2 mM pyruvate (Pyr), 20% TrophAmine (w/vol, amino acids, AA), or 2 mM glutamine (Gln). (C) The effect of stimulation with D+C represented as the increase with D+C compared to basal without substrates (none) or with Lac+Pyr or AA. (D) Effect of 3-mercaptopicolinic acid (MPA) on glucose production in CON (n = 3) and FGR (n = 2) hepatocytes. Effects of UK5099 (E), 7ACC2 (F), and oxamate (G and H) in CON (n = 3) and FGR (n = 4) hepatocytes. Experiments in DG were performed with hormone stimulation (D+C) and 20 mM lactate and 2 mM pyruvate. In H, D+C stimulation without lactate and pyruvate was used. Experiments were analyzed with 2-way ANOVA. ANOVA main and interaction effects are shown. In panels A and B, different letters represent differences (P < 0.05) among substrate combinations by posttest comparison with Students t test. #P < 0.10; *P < 0.05; **P < 0.01, ***P < 0.001 represent posttest comparisons. Weight threshold differences comparing moderate (light pink) versus severe (dark red) FGR were analyzed by 2-tailed Student’s t test and are indicated by a vertical line.
Figure 6
Figure 6. Nutrient signaling and oxidative stress.
(A) Protein expression in CON and FGR livers for phosphorylated (ph-) and total protein abundance of AMPK (T172), JNK (T183/Y185), and FOXO1 (T24). Ratios of phosphorylated to total protein were calculated. (B) Representative Western blot images, with molecular weights of protein bands indicated. Actin shown for equality of loading. (C) Total abundance of NRF-2. (D) Hepatic expression of genes associated with nutrient and stress signaling. (E) Hepatic TBARS content. (F) Liver tissue metabolite abundance ratios for AMP/ATP, NADH/NAD+, NADPH/NADP+, and lactate/pyruvate (Lac:Pyr). (G) Blood lactate/pyruvate ratio measured across the fetal hepatic circulation with input (hin) and output (hout) shown. Means ± SEM are shown (n = 6 CON, 9–10 FGR, except panel E with n = 14 CON, 21 FGR). Results were analyzed by Student’s t test. *P < 0.05, **P < 0.01, ***P < 0.001. When P > 0.05, the value is shown. Data points on graphs or blot lanes representing samples from FGR fetuses with moderate (pink) or severe (red) growth restriction are indicated. Weight-threshold differences comparing moderate (light pink) versus severe (dark red) FGR were analyzed by 2-tailed Student’s t test and are indicated by a vertical line.
Figure 7
Figure 7. Increased hepatic glucose production and reduced hepatic oxidative metabolism in FGR fetus.
In the normal fetus, hepatic oxidative metabolism is fueled by lactate and amino acids, with a small net uptake of glucose. Herein, we demonstrate that the FGR fetus has increased HGP and net glucose output, with lower oxidative metabolism. Our data support increased lactate production, decreased pyruvate oxidation, and decreased glutamate output as putative mechanisms that make carbons available for glucose production. The FGR liver also has evidence of nutrient and energetic stress and redox imbalance. This may be a consequence of reduced oxidative metabolism and offset by increased pyruvate output.

Similar articles

Cited by

References

    1. Kalhan S, Parimi P. Gluconeogenesis in the fetus and neonate. Semin Perinatol. 2000;24(2):94–106. doi: 10.1053/sp.2000.6360. - DOI - PubMed
    1. Hay WW, Jr Fetal glucose uptake and utilization as functions of maternal glucose concentration. Am J Physiol. 1984;246(3 pt 1):E237–E242. - PubMed
    1. Houin SS, et al. Coordinated changes in hepatic amino acid metabolism and endocrine signals support hepatic glucose production during fetal hypoglycemia. Am J Physiol Endocrinol Metab. 2015;308(4):E306–E314. doi: 10.1152/ajpendo.00396.2014. - DOI - PMC - PubMed
    1. Thorn SR, et al. Increased hepatic glucose production in fetal sheep with intrauterine growth restriction is not suppressed by insulin. Diabetes. 2013;62(1):65–73. doi: 10.2337/db11-1727. - DOI - PMC - PubMed
    1. Wesolowski SR, et al. Role of placental insufficiency and intrauterine growth restriction on the activation of fetal hepatic glucose production. Mol Cell Endocrinol. 2016;435:61–68. doi: 10.1016/j.mce.2015.12.016. - DOI - PMC - PubMed