Randomized Controlled Trial
. 2024 Apr 30;9(11):e167408.
doi: 10.1172/jci.insight.167408.

Innate immune activation restricts priming and protective efficacy of the radiation-attenuated PfSPZ malaria vaccine

Affiliations
Randomized Controlled Trial

Innate immune activation restricts priming and protective efficacy of the radiation-attenuated PfSPZ malaria vaccine

Leetah Senkpeil et al. JCI Insight. .

Abstract

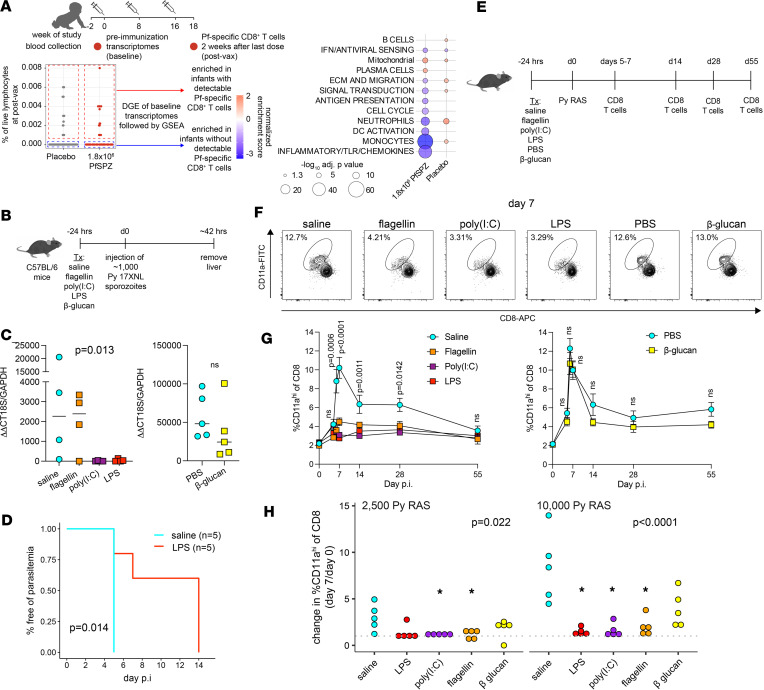
A systems analysis was conducted to determine the potential molecular mechanisms underlying differential immunogenicity and protective efficacy results of a clinical trial of the radiation-attenuated whole-sporozoite PfSPZ vaccine in African infants. Innate immune activation and myeloid signatures at prevaccination baseline correlated with protection from P. falciparum parasitemia in placebo controls. These same signatures were associated with susceptibility to parasitemia among infants who received the highest and most protective PfSPZ vaccine dose. Machine learning identified spliceosome, proteosome, and resting DC signatures as prevaccination features predictive of protection after highest-dose PfSPZ vaccination, whereas baseline circumsporozoite protein-specific (CSP-specific) IgG predicted nonprotection. Prevaccination innate inflammatory and myeloid signatures were associated with higher sporozoite-specific IgG Ab response but undetectable PfSPZ-specific CD8+ T cell responses after vaccination. Consistent with these human data, innate stimulation in vivo conferred protection against infection by sporozoite injection in malaria-naive mice while diminishing the CD8+ T cell response to radiation-attenuated sporozoites. These data suggest a dichotomous role of innate stimulation for malaria protection and induction of protective immunity by whole-sporozoite malaria vaccines. The uncoupling of vaccine-induced protective immunity achieved by Abs from more protective CD8+ T cell responses suggests that PfSPZ vaccine efficacy in malaria-endemic settings may be constrained by opposing antigen presentation pathways.

Keywords: Adaptive immunity; Infectious disease; Innate immunity; Malaria; Vaccines.


Figures

Figure 1
Figure 1. Variation in baseline transcriptomes.
(A) Overall study design. (B) Clustering heatmap of baseline transcriptomes. Partitioning around medoids and Euclidean distance metric were used for clustering with k = 4 and k = 5 for sample clusters (SC) and gene clusters (GC), respectively. Samples (columns) were split by treatment to highlight the patterns within and between treatments.
Figure 2
Figure 2. Innate activation, myeloid, and erythroid signatures at baseline distinguish protective outcomes.
(A) Associations between module eigengenes, obtained by weighted gene correlation network analysis using baseline transcriptomes of all 244 infants, with indicated binary variables determined by empirical Bayes moderated t test (*P < 0.05, **P < 0.01, ***P < 0.001). (B) Network graphs of significant modules containing nodes (red dots), edges (lines), and intermodule correlations (black edges). (C) Overrepresentation analysis of modules significantly correlating with outcome. Genes within the highly interconnected modules CSDE2, RIOK3, and SEC62 were combined. Only pathways/modules with BH-adjusted P < 0.01 are shown. (D) Gene set enrichment analysis between P and NP infants by group. Only modules with a BH-adjusted P < 0.05 are shown. Red text are modules in which direction of normalized enrichment score (NES) is reversed between placebo and 1.8 × 10⁶ PfSPZ. BH, Benjamini-Hochberg.
Figure 3
Figure 3. Baseline monocyte and innate inflammatory signatures correlate with postvaccination CSP-specific B cell responses.
(A) Volcano plot of CSP-specific IgG and flow cytometry features at each time point or calculated as fold-change after vaccination over baseline. (B) Correlation between CSP-specific MBCs and time to first parasitemia up to 6 months separated by protected (P) and not protected (NP) outcome at 3 months. (C) GSEA using genes ranked by direction and significance of correlation between baseline expression and percentage of CSP-specific of MBCs at 2 weeks after vaccination. (D) CSP-specific IgG at baseline and as fold-change (postvaccination/baseline) by treatment and outcome. *P < 0.05 between outcomes within a treatment by Wilcoxon test. Dotted line indicates threshold for high-CSP IgG response. (E) GSEA using genes ranked by direction and significance of DGE at baseline between 1.8 × 10⁶ PfSPZ vaccine recipients who subsequently had high or low CSP-specific IgG response after vaccination as defined in D. For C and E, only modules with a Benjamini-Hochberg–adjusted P < 0.05 are shown. NES, normalized enrichment score.
Figure 4
Figure 4. Peripheral gene signatures induced by high-dose PfSPZ vaccination predict protection from parasitemia.
(A) Unsupervised clustering heatmap of transcriptomic changes for the top 25% most variable genes split by treatment. Ward.D2 and Euclidean distance metric used for clustering samples (SC) and genes (GC). (B) Associations of the module eigengenes, obtained by weighted gene correlation network analysis of changes in gene expression (postvaccination/baseline) for 230 infants, with indicated variables determined by Spearman’s correlation or empirical Bayes moderated t test (P < 0.05) as appropriate. (C) Network graphs of modules in B containing nodes (genes) and edges (correlations). (D) GSEA of genes ranked by differential expression between postvaccination versus baseline (Δ) within the protected (ΔP) or not protected (ΔNP) groups or between outcomes adjusting for baseline (ΔP versus ΔNP) for 1.8 × 10⁶ PfSPZ infants. (E) Genes differentially expressed between ΔP and ΔNP (log2 fold-change > 2, P < 0.005) in 1.8 × 10⁶ PfSPZ. (F) Kaplan-Meier plot of risk of parasitemia for PfSPZ-vaccinated infants with or without upregulation of indicated gene 2 weeks after vaccination. Significance determined by log-rank analysis. (G) FSTL4 expression in human PBMCs across publicly available flow-sorted RNA-Seq data sets.
Figure 5
Figure 5. Multimodal correlation analyses reveal features associated with CSP-specific Ab response and protection from parasitemia across all dose groups.
Pairwise Spearman’s correlations between baseline, 2 weeks after vaccination, and ∆ features with the outcomes of postvaccination CSP-specific IgG and time to parasitemia at 6 months for all infants with available data (FDR < 5%). Features included module expression scores and flow cytometric data with the addition of plasma cytokines for baseline analysis.
Figure 6
Figure 6. Integrated multimodal machine learning reveal features predictive of PfSPZ-induced protection from parasitemia.
(A) Overview of machine learning workflow using XGBoost to predict outcome (P versus NP through 3 months) using multimodal models that combined BTM features with flow-cytometric, CSP-specific IgG, and cytokine features. (B and C) Feature stability plots, SHapley Additive exPlanations (SHAP) plots, and performance metrics are shown for 1.8 × 10⁶ PfSPZ, baseline, (B) and 1.8 × 10⁶ PfSPZ, after vaccination (C). Feature stability plots show the most common features among the top 1% of 2,500 models evaluated for each feature set. SHAP plots and performance metrics are shown for the top 4 models.
Figure 7
Figure 7. Integrated multimodal machine learning reveals predictive features for ∆ 1.8 × 10⁶ PfSPZ and baseline placebo.
(A and B) Feature stability plots, SHAP plots, and performance metrics are shown for ∆ 1.8 × 10⁶ PfSPZ (A) and) baseline placebo (B). Refer to Figure 6 for additional details.
Figure 8
Figure 8. Stimulation of innate immunity reduces liver parasite burden but dampens RAS-induced CD8+ T cell responses.
(A) GSEA using baseline transcriptomes between infants with detectable (red) versus without detectable (blue) PfSPZ-specific CD8+ T cell responses. Only BTMs with Benjamini-Hochberg–adjusted P < 0.05 are shown. (B) Study design for mouse experiments to determine the effect of innate stimuli on P. yoelii (Py) liver stage infection. (C) Liver parasite burden quantification. Each symbol represents a single mouse. Data (median) are representative of 2 independent experiments. Significance determined by Kruskal-Wallis test. (D) Kaplan-Meier plot of time to first parasitemia after injection of 1,000 Py 17XNL sporozoites in mice pretreated with LPS or saline for 24 hours. Significance determined by log-rank test. (E) C57BL/6 mice were treated with the indicated innate stimuli or control 24 hours before injection of ~1 × 10⁴ Py 17XNL RAS. RAS-induced CD8+ T cell responses were enumerated in peripheral blood on the indicated days. (F) Representative flow cytometry plots identifying RAS-induced CD8+ T cell (CD8loCD11ahi). Shown are the percentages of all circulating CD8+ T cells that are CD8loCD11ahi. (G) Percent of circulating CD8+ T cells that are CD8loCD11ahi on the indicated day after RAS injection. Data (mean ± SEM) are cumulative results (n = 8 mice/treatment) from 2 independent experiments. Significance determined by Kruskal-Wallis test. (H) Ratio of circulating CD8+ T cells that are CD8loCD11ahi at day 7 after RAS injection over preinfection baseline in 2 experiments independent of those in G. Shown are global P values for 1-way ANOVA. *P < 0.05 when compared pairwise to saline control by t test.
Figure 9
Figure 9. Innate immune activation modulates monocyte phagocytic capacity of sporozoites independent of CSP-specific antibodies.
(A) Plots of actual values with linear regression fits. (B) Perspective plots using fitted values from the logistic regression model in Supplemental Table 7 showing that CSP-specific IgG and CD14+ monocytes have differing effects on protection for placebo and 1.8 × 10⁶ PfSPZ groups. (C) Baseline expression of innate-related BTMs in nonprotected (NP) and protected (P) infants who received 1.8 × 10⁶ PfSPZ and lacked baseline CSP-specific IgG. (D) In vitro sporozoite phagocytosis assay design. (E) Representative images of PfSPZ uptake by primary monocytes stained with anti-PfCSP 2A10 Ab after pretreatment with indicated conditions. (F) Odds ratios with 95% CIs for number of monocytes containing phagocytosed PfSPZ over total monocytes for indicated treatment versus medium-only control. Opsonization with anti-PfCSP L9LS mAb is shown as a positive control, where reference was isotype control mAb. Significance determined by Fisher’s exact test. Data shown are representative of 2 independent experiments.

References

    1. RTS S Clinical Trials Partnership. Efficacy and safety of RTS,S/AS01 malaria vaccine with or without a booster dose in infants and children in Africa: final results of a phase 3, individually randomised, controlled trial. Lancet. 2015;386(9988):31–45. doi: 10.1016/S0140-6736(15)60721-8. - DOI - PMC - PubMed
    1. Datoo MS, et al. Efficacy of a low-dose candidate malaria vaccine, R21 in adjuvant Matrix-M, with seasonal administration to children in Burkina Faso: a randomised controlled trial. Lancet. 2021;397(10287):1809–1818. doi: 10.1016/S0140-6736(21)00943-0. - DOI - PMC - PubMed
    1. Datoo MS, et al. Efficacy and immunogenicity of R21/Matrix-M vaccine against clinical malaria after 2 years’ follow-up in children in Burkina Faso: a phase 1/2b randomised controlled trial. Lancet Infect Dis. 2022;22(12):1728–1736. doi: 10.1016/S1473-3099(22)00442-X. - DOI - PubMed
    1. Nussenzweig RS, et al. Protective immunity produced by the injection of x-irradiated sporozoites of plasmodium berghei. Nature. 1967;216(5111):160–162. doi: 10.1038/216160a0. - DOI - PubMed
    1. Clyde DF. Immunization of man against falciparum and vivax malaria by use of attenuated sporozoites. Am J Trop Med Hyg. 1975;24(3):397–401. doi: 10.4269/ajtmh.1975.24.397. - DOI - PubMed

Publication types

MeSH terms