. 2024 Apr 30;19(4):e0301345.
doi: 10.1371/journal.pone.0301345. eCollection 2024.

Individual and community empowerment improve resource users' perceptions of community-based conservation effectiveness in Kenya and Tanzania

Affiliations

Individual and community empowerment improve resource users' perceptions of community-based conservation effectiveness in Kenya and Tanzania

Robert Y Fidler et al. PLoS One. .

Abstract

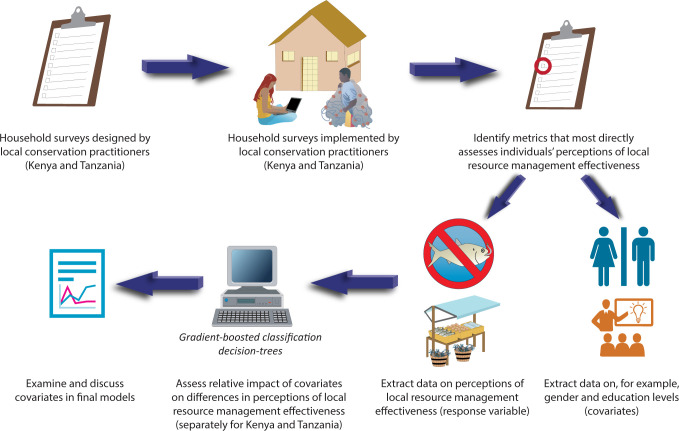
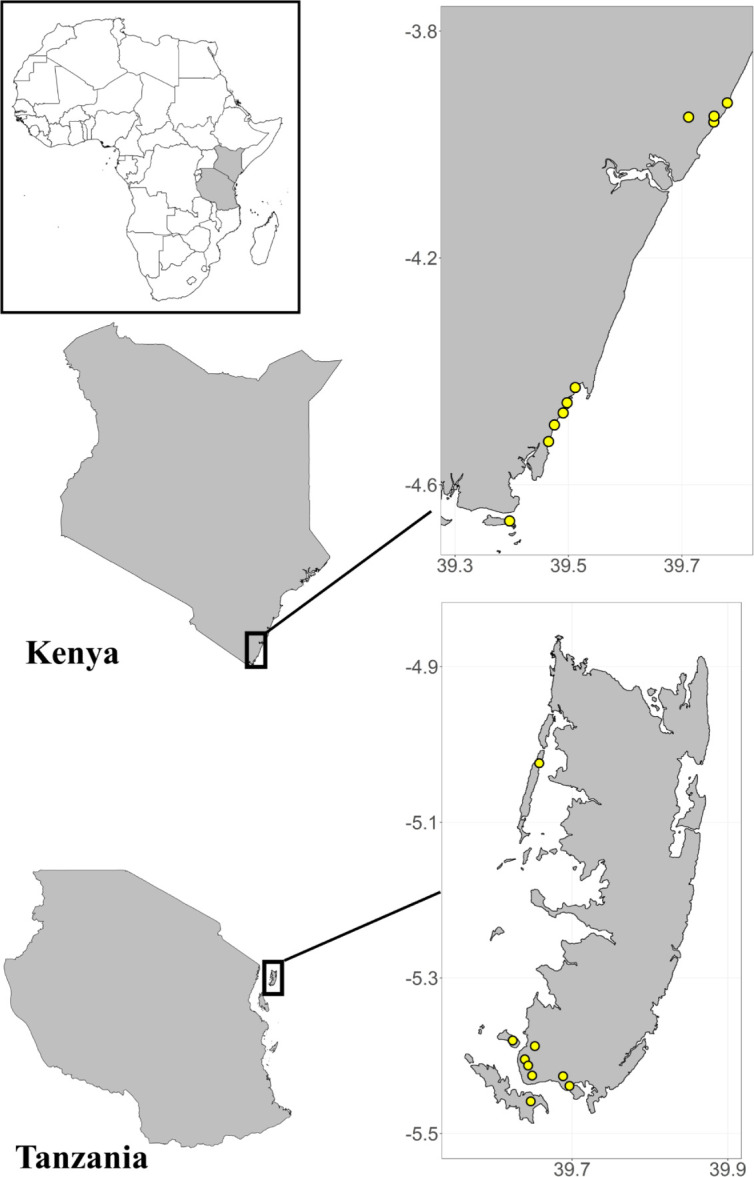
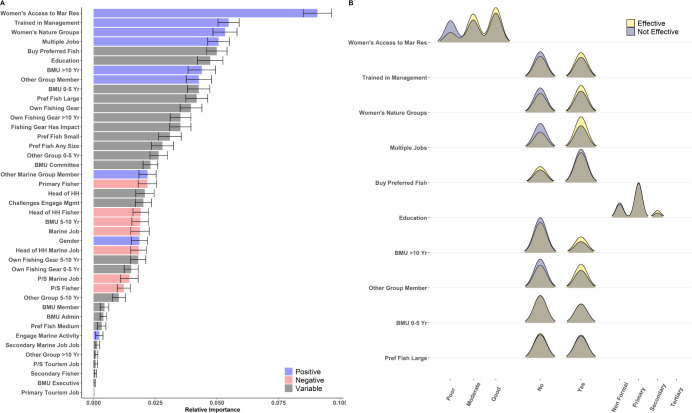
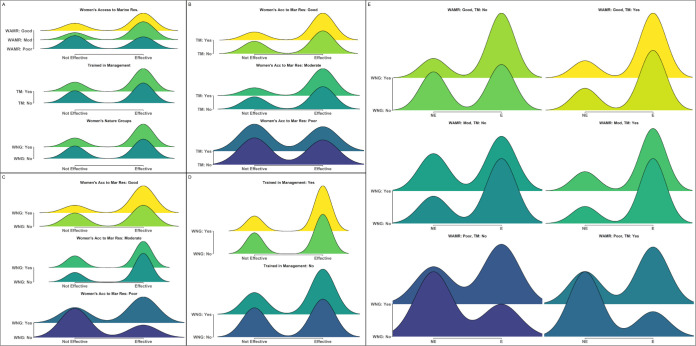
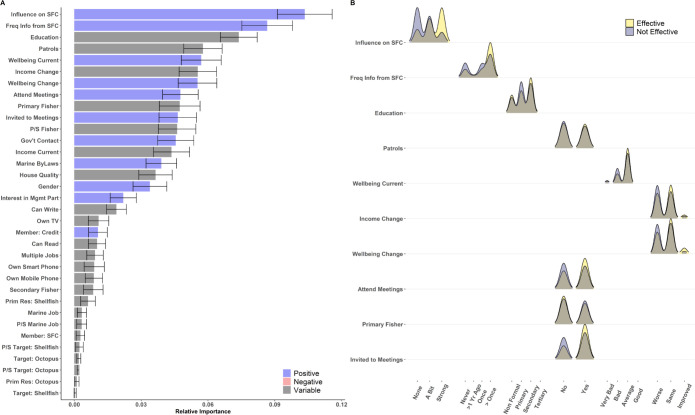
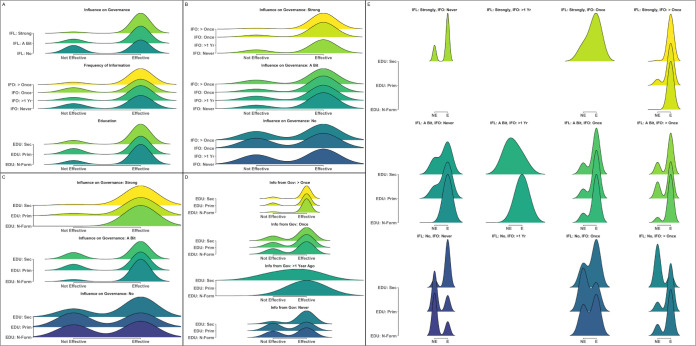
Community-based conservation has been increasingly recognized as critical to achieve both conservation and socio-economic development goals worldwide. However, the long-term sustainability of community-based conservation programs is dependent on a broadly shared perception among community members that management actions are achieving their stated goals. Thus, understanding the underlying factors driving differences in perceptions of management effectiveness can help managers prioritize the processes and outcomes most valued by resource users and thereby promote sustained support for conservation efforts. Here, we utilize large-scale interview survey data and machine learning to identify the factors most strongly associated with differences in perceived management effectiveness between resource users engaged in marine community-based conservation programs in Kenya and Tanzania. Perceptions of management effectiveness were generally favorable in both countries, and the most important predictors of positive perceptions were associated with community and individual empowerment in resource management and use, but within disparate focal domains. Improved perceptions of management effectiveness in Kenya were closely related to increases in women's empowerment in community-based conservation programs, while inclusionary and transparent governance structures were the most important factors driving improved perceptions in Tanzania. Additionally, the strongest predictors of differences between individuals in both countries often interacted synergistically to produce even higher rates of perceived effectiveness. These findings can help future initiatives in the region tailor management to match community-level priorities and emphasize the need for community-based conservation programs to understand local context to ensure that metrics of "success" are aligned with the needs and desires of local resource users.


Conflict of interest statement

The authors have declared that no competing interests exist.

Figures

Fig 1
Fig 1. Schematic overview of the research approach utilized in this study.
Fig 2
Fig 2. Location of household surveys in Kenya and Tanzania.
Yellow circles indicate locations where household survey data was collected.
Fig 3
Fig 3. Relative importance and distribution of responses for indicators most strongly associated with differences in perceived management effectiveness in Kenya.
(A) Relative importance of features to differences in perceived effectiveness. The length of solid bars along the x-axis represents the average feature importance for each variable across 100 model iterations, and the color of bars indicates relationships between increases in each metric and more positive perceptions of management effectiveness (blue: positive; red: negative; gray: variable). Error bars represent the standard deviation of importance across model runs. (B) Density plots of individual responses for the top 10 most important metrics, separated by individuals that believed management was effective (yellow) and not effective (purple). Brown areas represent overlapping values between individuals that believed management was effective and not effective.
Fig 4
Fig 4. Distributions and interactions between indicators with the strongest relationship to differences in perceived management effectiveness in Kenya.
Density plots demonstrating the relative proportion of individuals responding that they believed management was either not effective (left) or effective (right) across different values of: (A) the top three most important indicators (WAMR: Women’s Access to Marine Resources; TM: Trained in Management; WNG: Women’s Nature Groups); (B-D) two-way interactions between the top three indicators; and (E) three-way interactions between all indicators (x-axis: (NE) not effective; (E) effective). Numbers on either side of density plots represent the total number of individuals for each feature or combination of features that believed management was effective (right side) or not effective (left side).
Fig 5
Fig 5. Relative importance and distribution of responses for indicators most strongly associated with differences in perceived management effectiveness in Tanzania.
(A) Relative importance of features to differences in perceived effectiveness. The length of solid bars along the x-axis represents the average feature importance for each variable across 100 model iterations, and the color of bars indicates relationships between increases in each metric and more positive perceptions of management effectiveness (blue: positive; red: negative; gray: variable). Error bars represent the standard deviation of importance across model runs. (B) Density plots of individual responses for the top 10 most important metrics, separated by individuals that believed management was effective (yellow) and not effective (purple). Brown areas represent overlapping values between individuals that believed management was effective and not effective.
Fig 6
Fig 6. Distributions and interactions between indicators with the strongest relationship to differences in perceived management effectiveness in Tanzania.
Density plots demonstrating the relative proportion of individuals responding that they believed management was either not effective (left) or effective (right) across different values of: (A) the top three most important indicators (IFL: Influence on Governance; IFO: Frequency of Information from Governing Bodies; EDU: Education Level); (B-D) two-way interactions between the top three indicators; and (E) three-way interactions between all indicators (x-axis: (NE) not effective; (E) effective). Numbers on either side of density plots represent the total number of individuals for each feature or combination of features that believed management was effective (right side) or not effective (left side).

References

    1. Convention on Biological Diversity. First Draft of the Post-2020 Global Biodiversity Framework. CBD WG/2020/3/3. 5 July 2021. 2021.
    1. United Nations. The Sustainable Development Goals Report 2022. United Nations Publ issued by Dep Econ Soc Aff. 2022; 64.
    1. Mills M, Bode M, Mascia MB, Weeks R, Gelcich S, Dudley N, et al.. How conservation initiatives go to scale. Nat Sustain. 2019;2: 935–940. doi: 10.1038/s41893-019-0384-1 - DOI
    1. Andradi-Brown DA, Veverka L, Amkieltiela, Crane NL, Estradivari, Fox HE, et al.. Diversity in marine protected area regulations: Protection approaches for locally appropriate marine management. Front Mar Sci. 2023;10: 1–19. doi: 10.3389/fmars.2023.1099579 - DOI
    1. Adams WM, Aveling R, Brockington D, Dickson B, Elliott J, Hutton J, et al.. Biodiversity conservation and the eradication of poverty. Science. 2004. doi: 10.1126/science.1097920 - DOI - PubMed

Publication types