. 2024 Apr 30;22(4):e3002607.
doi: 10.1371/journal.pbio.3002607. eCollection 2024 Apr.

Brain high-throughput multi-omics data reveal molecular heterogeneity in Alzheimer's disease

Affiliations

Brain high-throughput multi-omics data reveal molecular heterogeneity in Alzheimer's disease

Abdallah M Eteleeb et al. PLoS Biol. .

Abstract

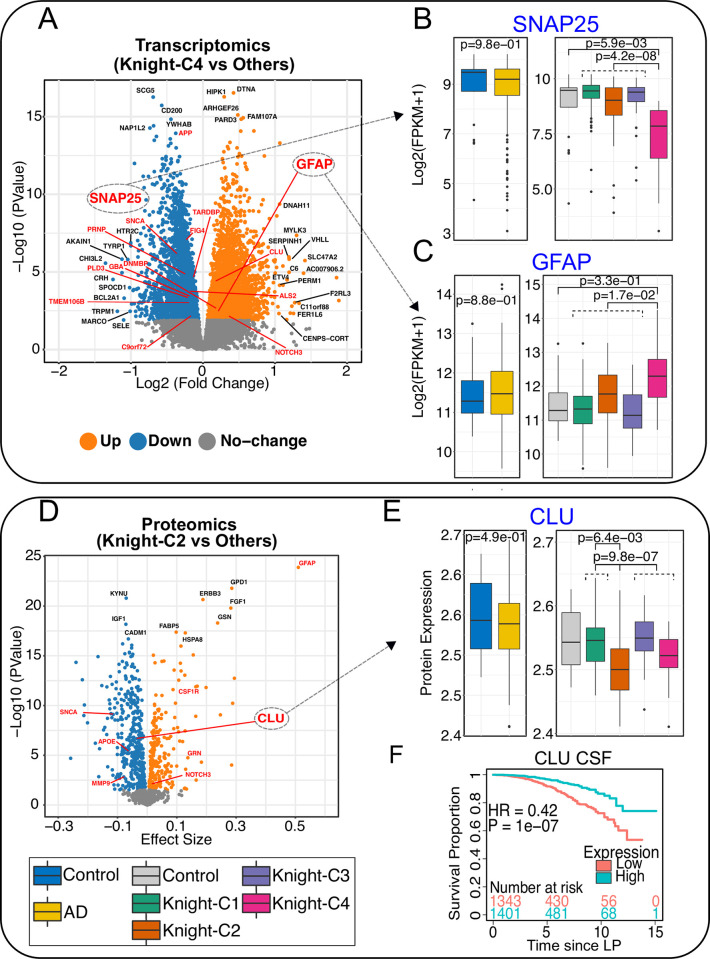
Unbiased data-driven omic approaches are revealing the molecular heterogeneity of Alzheimer disease. Here, we used machine learning approaches to integrate high-throughput transcriptomic, proteomic, metabolomic, and lipidomic profiles with clinical and neuropathological data from multiple human AD cohorts. We discovered 4 unique multimodal molecular profiles, one of them showing signs of poor cognitive function, a faster pace of disease progression, shorter survival with the disease, severe neurodegeneration and astrogliosis, and reduced levels of metabolomic profiles. We found this molecular profile to be present in multiple affected cortical regions associated with higher Braak tau scores and significant dysregulation of synapse-related genes, endocytosis, phagosome, and mTOR signaling pathways altered in AD early and late stages. AD cross-omics data integration with transcriptomic data from an SNCA mouse model revealed an overlapping signature. Furthermore, we leveraged single-nuclei RNA-seq data to identify distinct cell-types that most likely mediate molecular profiles. Lastly, we identified that the multimodal clusters uncovered cerebrospinal fluid biomarkers poised to monitor AD progression and possibly cognition. Our cross-omics analyses provide novel critical molecular insights into AD.


Conflict of interest statement

The authors have declared that no competing interests exist.

Figures

Fig 1
Fig 1. Study design.
. The transcriptomics, proteomics, metabolomics, and lipidomics profiles of postmortem parietal cortex samples from the Knight ADRC participants were used. The 3 omics shared 278 subjects (255 sporadic AD and 23 control cases). Expression/reading matrices were prepared for the same set of samples (n = 278) and different numbers of features (features = 60,754, proteins = 1,092, metabolites = 627). Before the integration, feature selection was performed on all omics datasets whose number of features exceeded 1,000 by selecting the top and most variant features. A Bayesian integrative clustering method was then employed to integrate the 3 omics datasets and the best clustering solution was extracted based on the maximum deviance ratio and the minimum BIC. AD molecular profiles were then linked to multiple clinical and molecular attributes to examine whether an association with these attributes exists. In addition, survival, DE, cell type-specific effect, and cell proportions inference analyses were performed on these profiles. These molecular profiles were then replicated in 2 independent datasets from MSBB BM36 (AD = 93, CO = 23) and ROSMAP (AD = 144, CO = 93). Dysregulated synaptic genes in the Knight-C4 profile were extracted and used for downstream AD staging analyses and in the ROSMAP cohort (early-AD vs. control and late-AD vs. control). Common synaptic genes present in the CSF SOMA dataset and associated with an increased risk of dementia through survival analyses were identified as CSF synaptic biomarkers for AD staging. Some components of this figure were Created with BioRender.com and edited and combined with Inkscape. AD, Alzheimer disease; BIC, Bayesian information criteria; CSF, cerebrospinal fluid; DE, differential expression; MSBB, Mount Sinai Brain Bank; ROSMAP, Religious Orders Study and Memory and Aging Project.
Fig 2
Fig 2. Cross-omics data integration identified 4 distinct molecular profiles of AD associated with worse clinical outcomes and molecular attributes.
(A) Heatmaps of multi-omics profiles of the top significant features. (B) Transcriptomic profiles (scaled) of the top genes contributed significantly to the clustering, showing an overall dysregulation of brains in Knight-C4. (C) The distribution of CDR scores across 4 clusters with Knight-C4 associated with high CDR scores. (D) Kaplan–Meier plots showing Knight-C4 association with poor outcome for the age of onset and death. (E) Boxplots showing the cell proportion from deconvolution analysis across 4 clusters using bulk RNA-seq from 4 cell types. Knight-C4 is associated with a significantly higher and lower proportion of astrocytes and neurons, respectively. (F) Boxplot showing each cluster’s first principal component of metabolomics profiles, with Knight-C2 and Knight-C4 showing a lower metabolomic signature than other AD cases. The data underlying panels C, E, and F can be found in S1 Data. AD, Alzheimer disease; CDR, Clinical Dementia Rating.
Fig 3
Fig 3. Molecular profiles of Knight-C4 are replicated in 2 independent datasets.
(A) Heatmaps of the transcriptomic and proteomic profiles of the top features from MSBB (BM36) show 2 distinct clusters. (B) Boxplots showing MSBB-C1 associated with higher CDR scores, replicating Knight-C4 in the knight ADRC. (C) Boxplots showing cell proportions inferred from bulk RNA-seq from MSBB (BM36) using digital deconvolution. MSBB-C1 replicates Knight-C4 by showing an association with significantly higher and lower proportions of astrocytes and neurons, respectively. (D) Heatmap of the transcriptomic profiles of the top features from ROSMAP (DLPFC) showing 2 distinct clusters. I Boxplots showing ROSMAP-C1 associated with lower MMSE30 scores. (F) Boxplots showing cell proportion estimated from bulk RNA-seq from ROSMAP (DLPFC) using digital deconvolution. Like MSBB, ROSMAP-C1 replicates Knight-C4 by showing an association with significantly higher and lower proportions of astrocytes and neurons, respectively. (G) Venn diagram showing the common dysregulated genes in the discovery and replicated cohorts. (H) Heatmaps of the mean expression of the shared genes across the discovery and replicated cohorts showing a clear, consistent expression pattern. (I) Heatmap of the effect size detected in the discovery and replicated cohorts showing a high effect size similarity across the 3 cohorts. The data underlying panels B, C, E, and F can be found in S1 Data. CDR, Clinical Dementia Rating; DLPFC, dorsolateral prefrontal cortex; MSBB, Mount Sinai Brain Bank; ROSMAP, Religious Orders Study and Memory and Aging Project.
Fig 4
Fig 4. The parietal cortex of participants with worse cognitive function exhibited remarkable molecular dysregulation.
(A) Bar plots showing the significant genes detected in each cluster compared to the control. Yellow represents the total number of genes, green represents the cluster-specific genes, and purple depicts the number of genes missed with an unclustered approach (all AD cases vs. control). (B) Same as panel “A” but for proteins. (C) Same as panel “A” but for metabolites. (D) Race track plot showing the percentage of significant features for each cluster compared to other clusters for the 3 omics. (E) Venn diagrams showing the overlap between significant genes in Knight-C4 and synaptic genes (“synaptosome”) from Fei and colleagues [46]. (F) Same as “E” but overlaps with SynGO dataset [47]. The significance of overlap was computed using Fisher’s exact test. (G) Top 20 KEGG pathways associated with Knight-C4. (H) Top 20 GO biological process pathways associated with Knight-C4. The data underlying panels A, B, and C can be found in S1 Data. AD, Alzheimer disease.
Fig 5
Fig 5. DE analyses identified ND genes associated with distinct clusters.
(A) Volcano plot showing the up- and down-regulated genes identified between Knight-C4 vs. other clusters. Genes in red are examples of known ND genes. Genes in black are the top 10 significant genes based on the adjusted p-value and genes with log2(fold change) > 1. (B) Boxplots showing the transcriptomic profiles (in FPKM) of SNAP25 across 4 clusters (right) and for AD cases combined (left) in the Knight ADRC cohort. (C) Same as “B” but for GFAP. (D) Volcano plot showing the up-and down-regulated proteins identified between Knight-C2 vs. other clusters. (E) Boxplots showing the proteomic profiles of CLU across 4 clusters (right) and for all AD cases (left) in the Knight ADRC cohort. (F) Kaplan–Meier plot showing the association of Clusterin (ApoJ) protein concentrations in CSF with an increased risk of dementia progression using CDR change from 0 to 0.5 using the CSF dataset from the Knight ADRC participants. The data underlying panels B, C, and E can be found in S1 Data. AD, Alzheimer disease; CDR, Clinical Dementia Rating; CSF, cerebrospinal fluid; DE, differential expression; ND, neurodegenerative disease.
Fig 6
Fig 6. Differential abundance analyses identified significant metabolites and pathways associated with Knight-C4.
(A) Venn diagrams show the significantly increased and decreased metabolites shared between the Knight-C4 and ROSMAP-C1 compared to the control. The left and right boxes show the names of shared metabolites. (B) Similar to panel “A” but for metabolites shared between Knight-C4 and ROSMAP-C1 compared to the other cases. The significance of overlap was computed using Fisher’s exact test. ROSMAP, Religious Orders Study and Memory and Aging Project.
Fig 7
Fig 7. Integrating single-nuclei data with cross-omics profiles identified cell type-specific genes and pathways.
(A) Bar plots showing the percentage of up- and down-regulated genes (clusters vs. control) identified in each cell type. (B) Top 20 KEGG pathways enriched in astrocytic up-regulated genes. (C) Top 20 GO biological process pathways enriched in neuronal down-regulated genes. (D) Top KEGG pathways enriched in neuronal down-regulated genes. (E) Boxplots show the transcriptomic profiles (in FPKM) of examples of cell type-specific genes identified in the Knight ADRC cohort. (F) The effect size of these examples was generated from single-nuclei data from the Knight ADRC participants. Red bars represent the cell type in which the gene is overexpressed. The data underlying panels A, E, and F can be found in S1 Data. DE, differential expression; OPC, oligodendrocyte precursor cell.
Fig 8
Fig 8. Cross-omics integration identified alpha-synuclein levels down-regulated in AD participants with worse cognitive function common across multiple brain regions.
(A) Transcriptomic profiles (in FPKM) of SNCA across 4 clusters (right) and for all AD cases (left) in the Knight ADRC cohort. (B) Proteomic profiles of SNCA across 4 clusters (right) and all AD cases (left) in the Knight ADRC cohort. (C) Transcriptomic profiles of SNCA across 4 clusters (right) and all AD cases (left) in the MSBB BM36 cohort. (D) Proteomic (TMT) profiles of SNCA across 4 clusters (right) and all AD cases (left) in the MSBB BM36 cohort. (E) Transcriptomic profiles of SNCA across 4 clusters (right) and all AD cases (left) in ROSMAP DLPFC cohort. The data underlying this figure can be found in S1 Data. AD, Alzheimer disease; DLPFC, dorsolateral prefrontal cortex; MSBB, Mount Sinai Brain Bank; ROSMAP, Religious Orders Study and Memory and Aging Project; TMT, tandem mass tag.
Fig 9
Fig 9. Synaptic dysregulation at multiple stages of AD identified CSF synaptic biomarkers for the molecular staging of AD.
(A) Scatterplot showing the correlation of effect size between early-AD (EAD) and late-AD (AD) for common dysregulated synaptic genes in Knight-C4 and RSOSMAP. (B) Heatmap showing the effect size similarity of the most significant synaptic genes detected in early and late-AD. (C) Boxplots showing a consistent expression (transcriptomic) pattern between control, early-AD, and late-AD for genes IGF1, NRXN3, and YWHAZ. (D) Kaplan–Meier plots showing the association between IGF1, NRXN3, and YWHAZ genes and an increased risk of dementia progression using CSF proteomics data. The data underlying panel C can be found in S1 Data. AD, Alzheimer disease; CSF, cerebrospinal fluid.

References

    1. Jellinger KA. Pathobiological subtypes of Alzheimer disease. Dement Geriatr Cogn Disord. 2020;49(4):321–333. doi: 10.1159/000508625 - DOI - PubMed
    1. Tijms BM, Gobom J, Reus L, Jansen I, Hong S, Dobricic V, et al.. Pathophysiological subtypes of Alzheimer’s disease based on cerebrospinal fluid proteomics. Brain. 2020;143(12):3776–3792. doi: 10.1093/brain/awaa325 - DOI - PMC - PubMed
    1. Neff RA, Wang M, Vatansever S, Guo L, Ming C, Wang Q, et al.. Molecular subtyping of Alzheimer’s disease using RNA sequencing data reveals novel mechanisms and targets. Sci Adv. 2021;7(2):eabb5398. doi: 10.1126/sciadv.abb5398 - DOI - PMC - PubMed
    1. Vogel JW, Young AL, Oxtoby NP, Smith R, Ossenkoppele R, Strandberg OT, et al.. Four distinct trajectories of tau deposition identified in Alzheimer’s disease. Nat Med. 2021;27(5):871–881. doi: 10.1038/s41591-021-01309-6 - DOI - PMC - PubMed
    1. Ferreira D, Nordberg A, Westman E. Biological subtypes of Alzheimer disease: A systematic review and meta-analysis. Neurology. 2020;94(10):436–448. doi: 10.1212/WNL.0000000000009058 - DOI - PMC - PubMed

Publication types