

Quantifying effects of blood pressure control on neuroimaging utilization in a large multi-institutional healthcare population
- PMID: 38687816
- PMCID: PMC11060572
- DOI: 10.1371/journal.pone.0298685
Quantifying effects of blood pressure control on neuroimaging utilization in a large multi-institutional healthcare population
Abstract
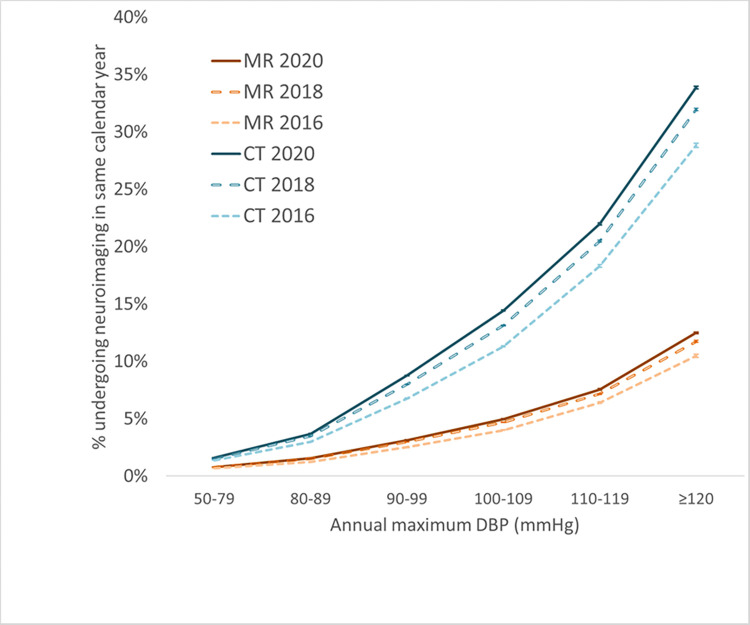
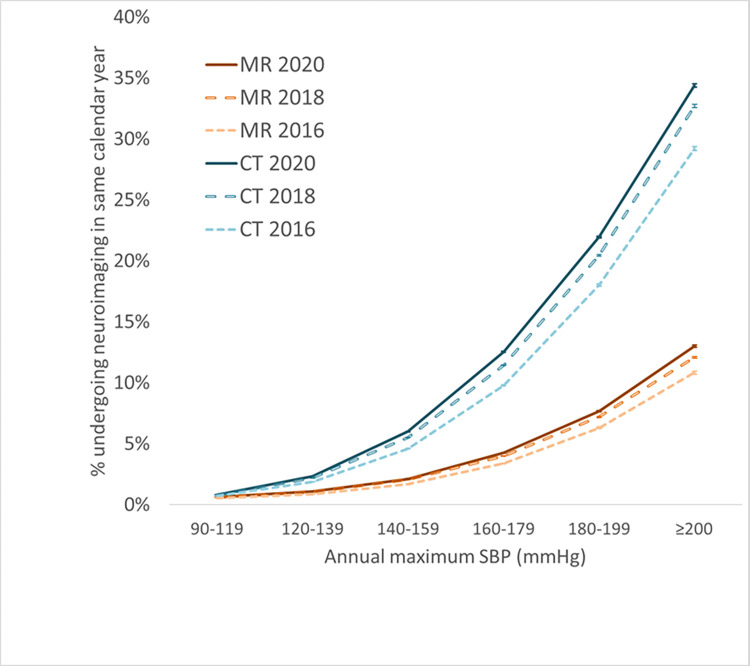
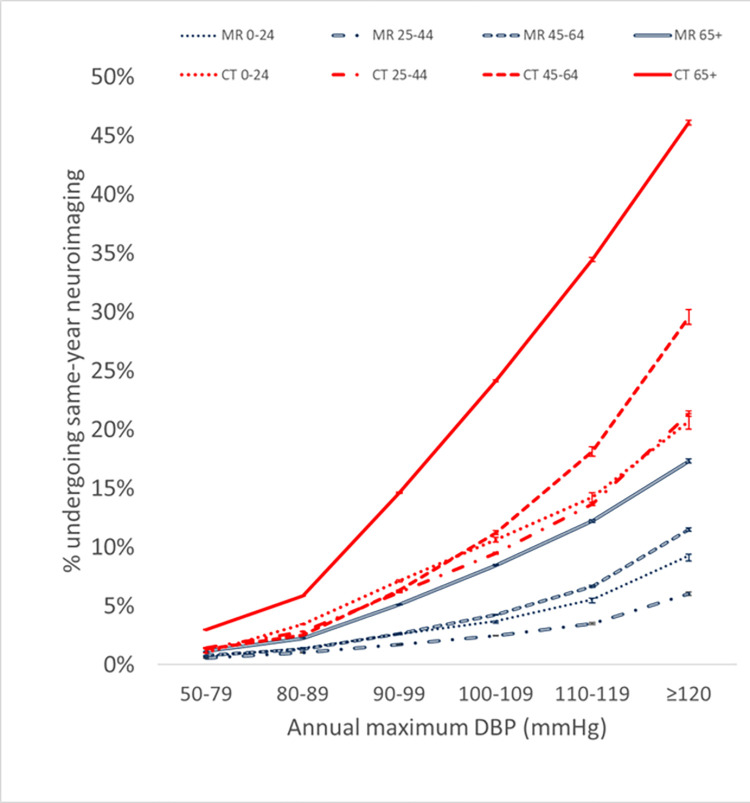
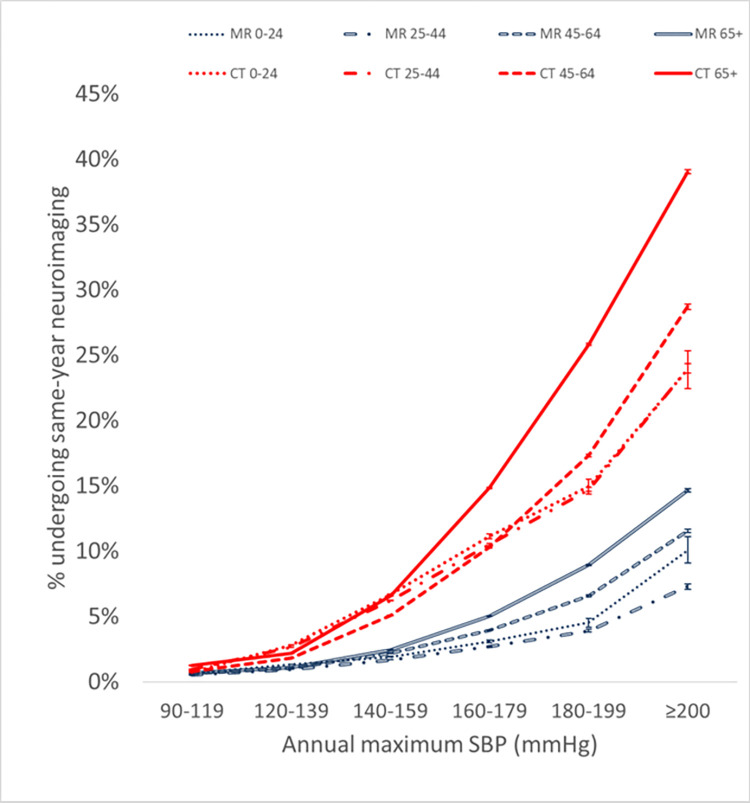
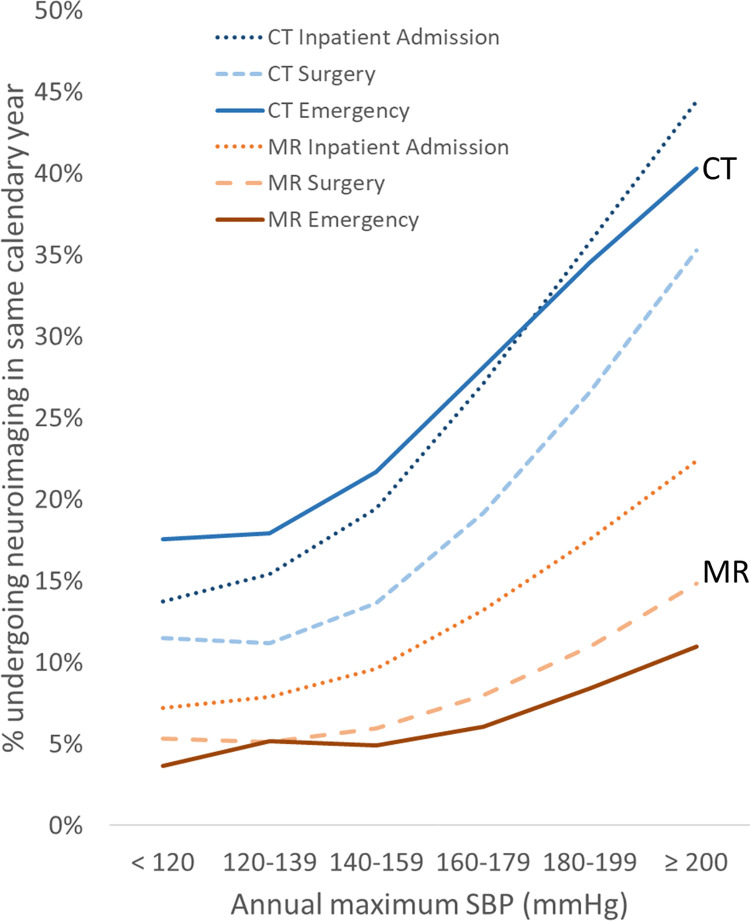
Objectives: Essential hypertension is a common chronic condition that can exacerbate or complicate various neurological diseases that may necessitate neuroimaging. Given growing medical imaging costs and the need to understand relationships between population blood pressure control and neuroimaging utilization, we seek to quantify the relationship between maximum blood pressure recorded in a given year and same-year utilization of neuroimaging CT or MR in a large healthcare population.
Methods: A retrospective population-based cohort study was performed by extracting aggregate data from a multi-institutional dataset of patient encounters from 2016, 2018, and 2020 using an informatics platform (Cosmos) consisting of de-duplicated data from over 140 academic and non-academic health systems, comprising over 137 million unique patients. A population-based sample of all patients with recorded blood pressures of at least 50 mmHg DBP or 90 mmHg SBP were included. Cohorts were identified based on maximum annual SBP and DBP meeting or exceeding pre-defined thresholds. For each cohort, we assessed neuroimaging CT and MR utilization, defined as the percentage of patients undergoing ≥1 neuroimaging exam of interest in the same calendar year.
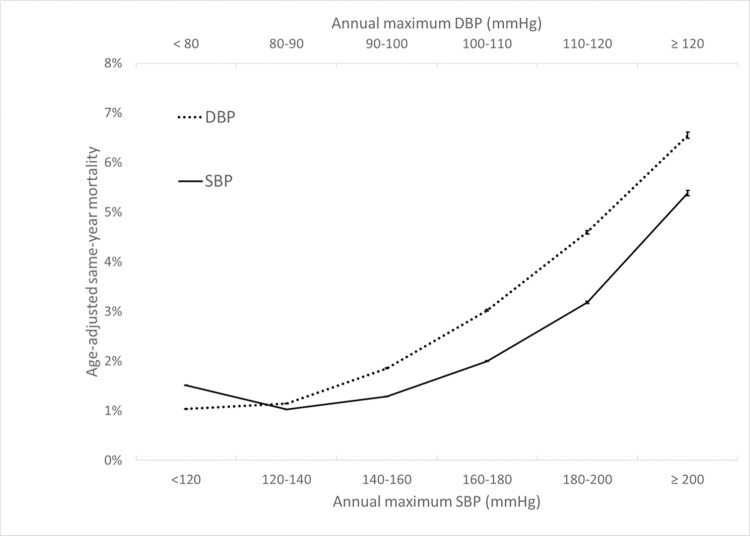
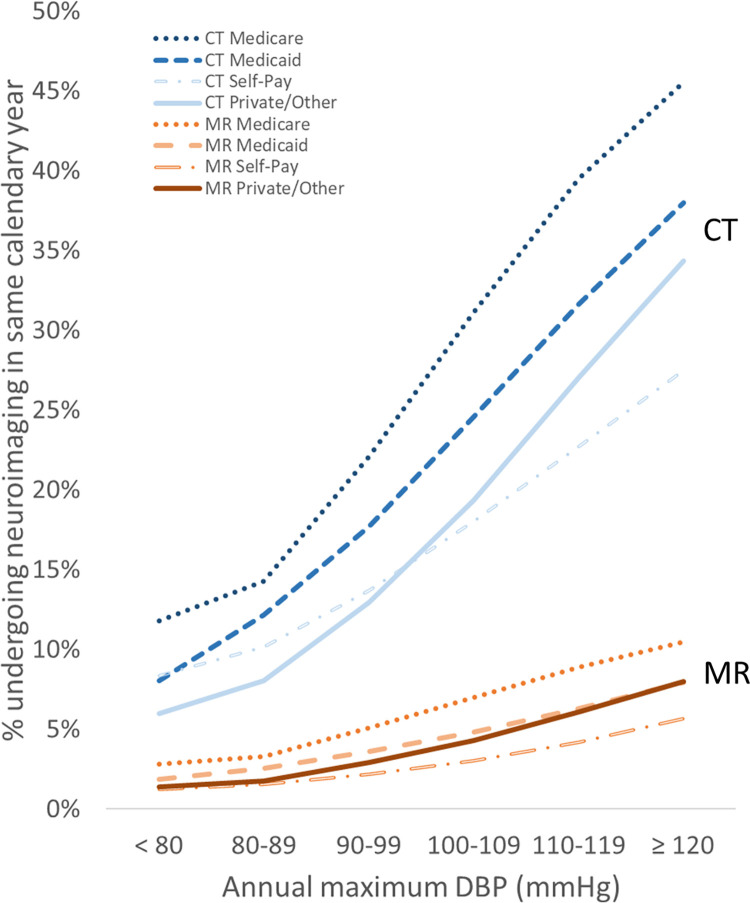
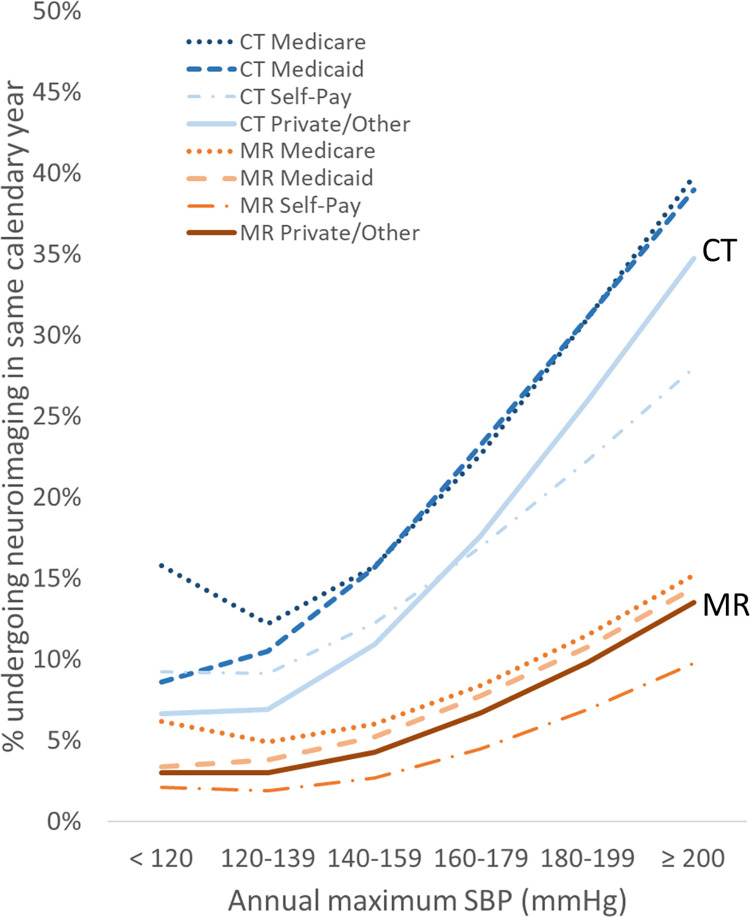
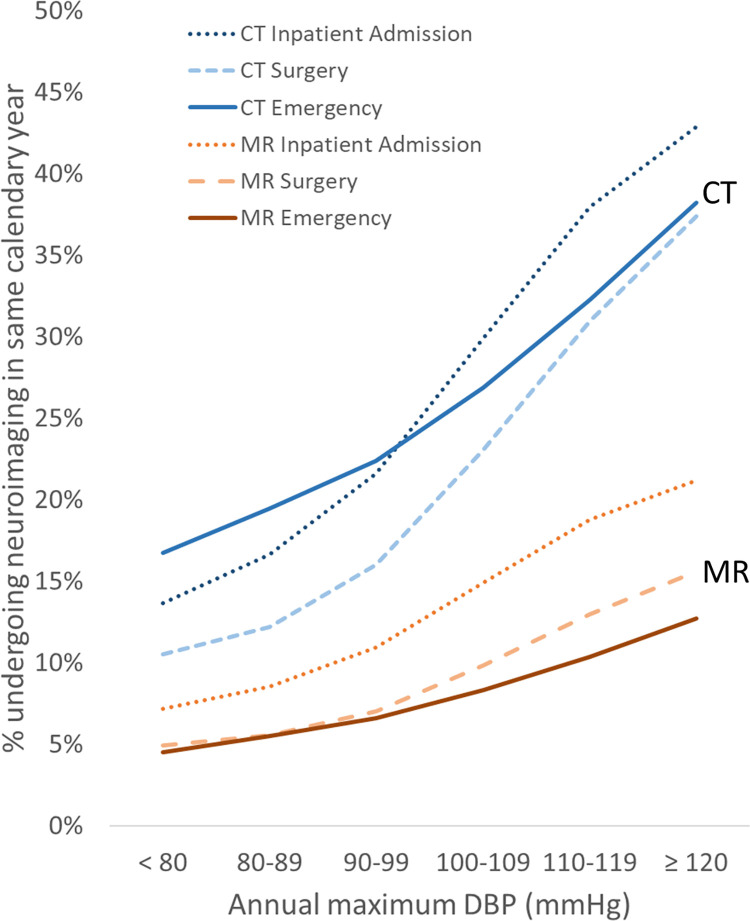
Results: The multi-institutional population consisted of >38 million patients for the most recent calendar year analyzed, with overall utilization of 3.8-5.1% for CT and 1.5-2.0% for MR across the study period. Neuroimaging utilization increased substantially with increasing annual maximum BP. Even a modest BP increase to 140 mmHg systolic or 90 mmHg diastolic is associated with 3-4-fold increases in MR and 5-7-fold increases in CT same-year imaging compared to BP values below 120 mmHg / 80 mmHg.
Conclusion: Higher annual maximum recorded blood pressure is associated with higher same-year neuroimaging CT and MR utilization rates. These observations are relevant to public health efforts on hypertension management to mitigate costs associated with growing imaging utilization.
Copyright: © 2024 Welch et al. This is an open access article distributed under the terms of the Creative Commons Attribution License, which permits unrestricted use, distribution, and reproduction in any medium, provided the original author and source are credited.
Conflict of interest statement
The authors have declared that no competing interests exist.
Figures
Similar articles
-
CT and MR utilization and morbidity metrics across Body Mass Index.PLoS One. 2024 Jun 28;19(6):e0306087. doi: 10.1371/journal.pone.0306087. eCollection 2024. PLoS One. 2024. PMID: 38941332 Free PMC article.
-
Blood pressure levels post mechanical thrombectomy and outcomes in non-recanalized large vessel occlusion patients.J Neurointerv Surg. 2018 Oct;10(10):925-931. doi: 10.1136/neurintsurg-2017-013581. Epub 2018 Jan 11. J Neurointerv Surg. 2018. PMID: 29326379
-
Central blood pressure and pulse wave velocity in young and middle-aged Japanese adults with isolated systolic hypertension.Hypertens Res. 2020 Mar;43(3):207-212. doi: 10.1038/s41440-019-0364-x. Epub 2019 Nov 29. Hypertens Res. 2020. PMID: 31784679
-
[Association between long-term blood pressure change and the incidence of cardiovascular diseases: a population-based cohort study].Zhonghua Xin Xue Guan Bing Za Zhi. 2018 Sep 24;46(9):695-700. doi: 10.3760/cma.j.issn.0253-3758.2018.09.005. Zhonghua Xin Xue Guan Bing Za Zhi. 2018. PMID: 30293375 Chinese.
-
Effects of blood-pressure-lowering treatment on outcome incidence in hypertension: 10 - Should blood pressure management differ in hypertensive patients with and without diabetes mellitus? Overview and meta-analyses of randomized trials.J Hypertens. 2017 May;35(5):922-944. doi: 10.1097/HJH.0000000000001276. J Hypertens. 2017. PMID: 28141660 Review.
References
-
- [Anonymous]. Hypertension. cdc.gov. 2019. Available: https://www.cdc.gov/nchs/fastats/hypertension.htm.
-
- Paramore LC, Halpern MT, Lapuerta P, Hurley JS, Frost FJ, Fairchild DG, et al.. Impact of poorly controlled hypertension on healthcare resource utilization and cost. The American journal of managed care. 2001;7: 389–398. - PubMed
Publication types
MeSH terms
LinkOut - more resources
Full Text Sources
Medical
