Comparative Study
. 2024 May 23;11(5):ENEURO.0151-24.2024.
doi: 10.1523/ENEURO.0151-24.2024. Print 2024 May.

Comparative Anatomy of the Dentate Mossy Cells in Nonhuman Primates: Their Spatial Distributions and Axonal Projections Compared With Mouse Mossy Cells

Affiliations
Comparative Study

Comparative Anatomy of the Dentate Mossy Cells in Nonhuman Primates: Their Spatial Distributions and Axonal Projections Compared With Mouse Mossy Cells

Minseok Jeong et al. eNeuro. .

Abstract

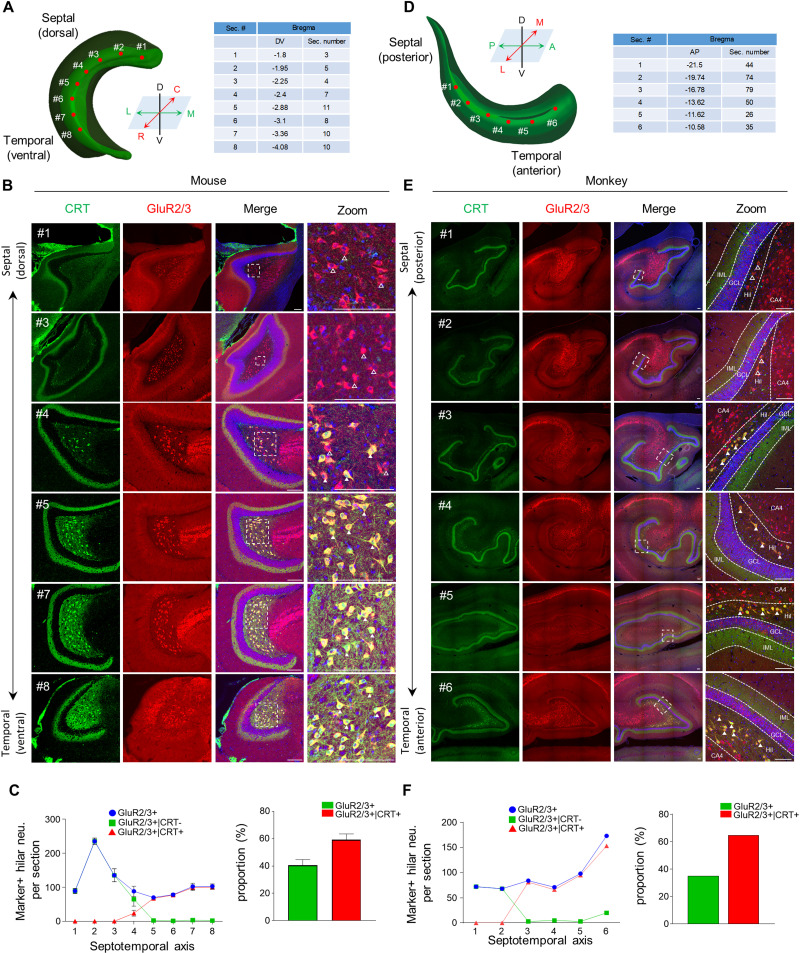
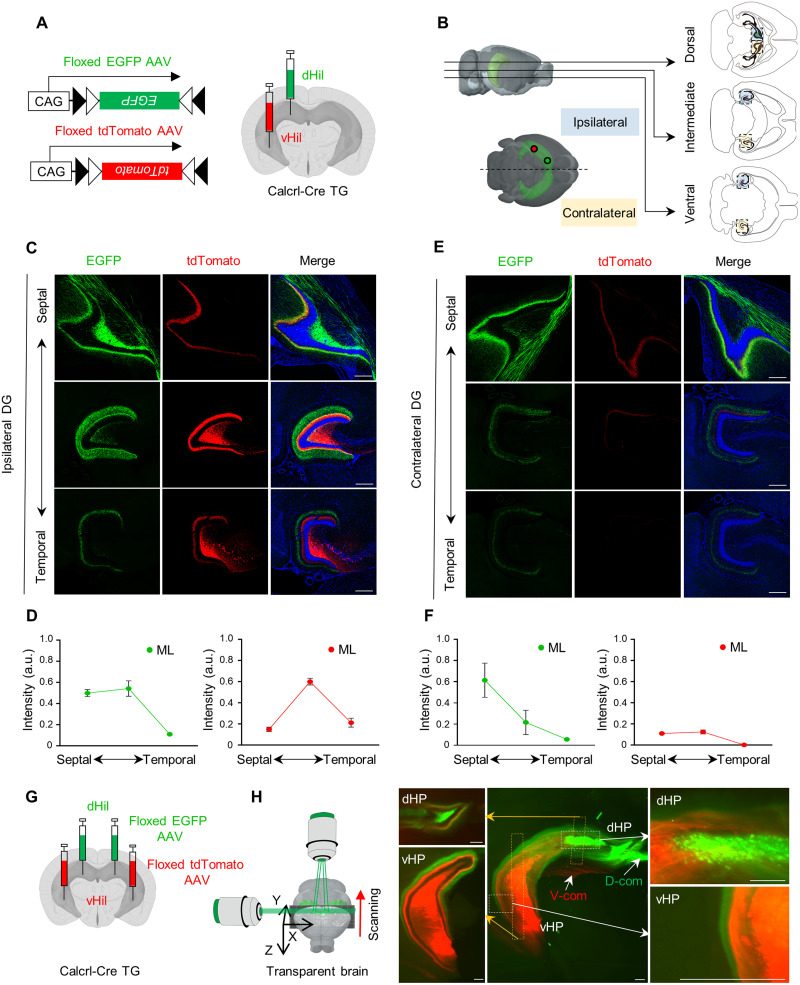
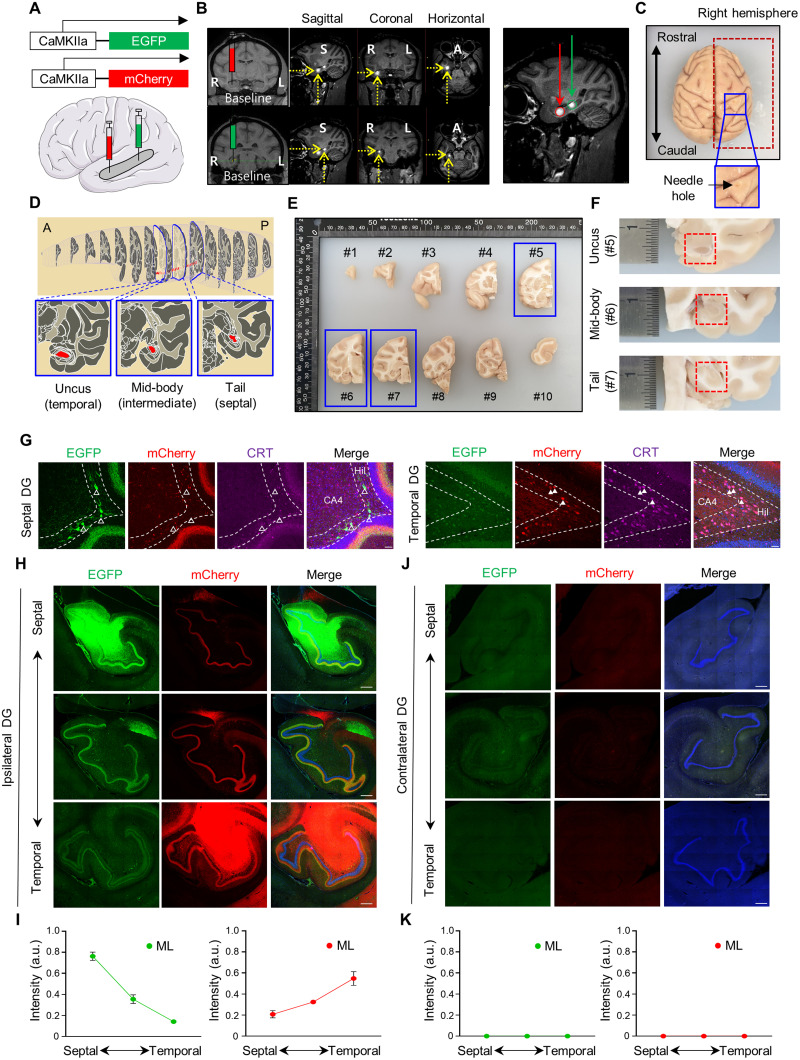
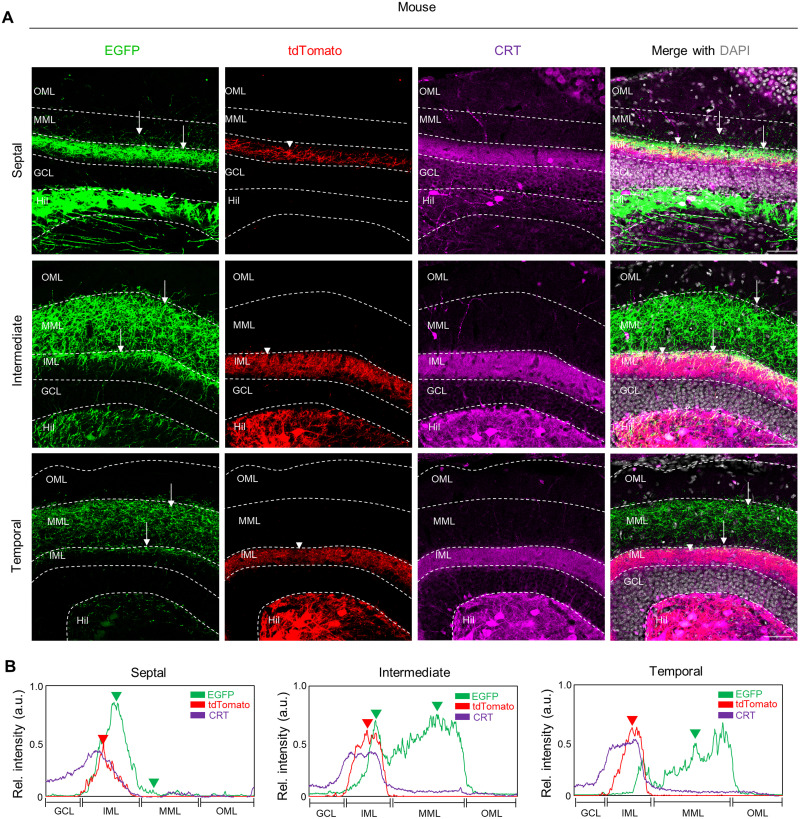
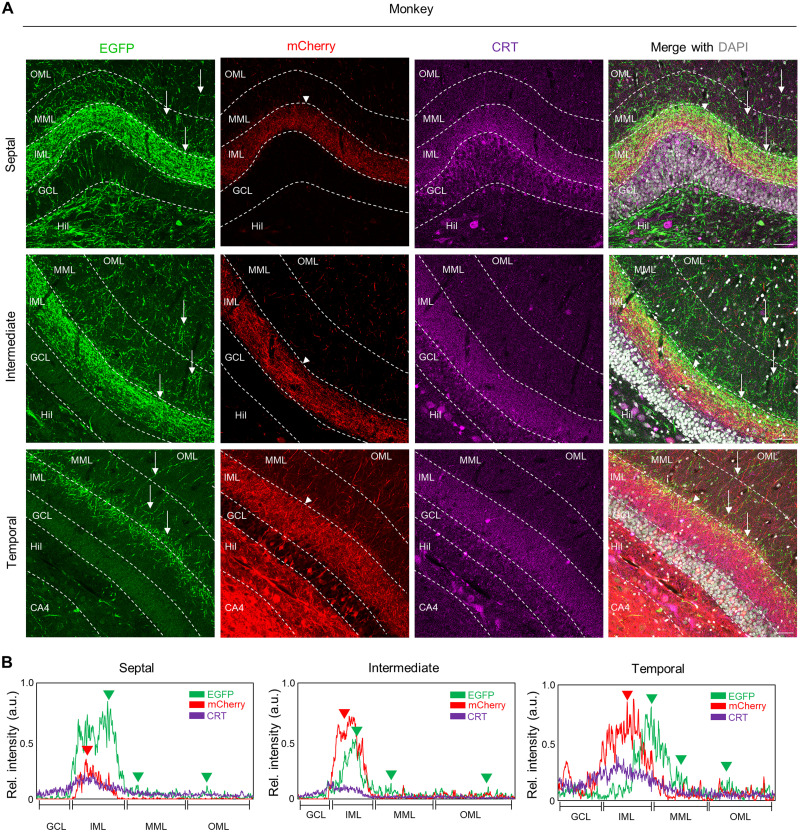
Glutamatergic mossy cells (MCs) mediate associational and commissural connectivity, exhibiting significant heterogeneity along the septotemporal axis of the mouse dentate gyrus (DG). However, it remains unclear whether the neuronal features of MCs are conserved across mammals. This study compares the neuroanatomy of MCs in the DG of mice and monkeys. The MC marker, calretinin, distinguishes two subpopulations: septal and temporal. Dual-colored fluorescence labeling is utilized to compare the axonal projection patterns of these subpopulations. In both mice and monkeys, septal and temporal MCs project axons across the longitudinal axis of the ipsilateral DG, indicating conserved associational projections. However, unlike in mice, no MC subpopulations in monkeys make commissural projections to the contralateral DG. In monkeys, temporal MCs send associational fibers exclusively to the inner molecular layer, while septal MCs give rise to wide axonal projections spanning multiple molecular layers, akin to equivalent MC subpopulations in mice. Despite conserved septotemporal heterogeneity, interspecies differences are observed in the topological organization of septal MCs, particularly in the relative axonal density in each molecular layer along the septotemporal axis of the DG. In summary, this comparative analysis sheds light on both conserved and divergent features of MCs in the DG of mice and monkeys. These findings have implications for understanding functional differentiation along the septotemporal axis of the DG and contribute to our knowledge of the anatomical evolution of the DG circuit in mammals.

Keywords: associational projections; commissural projections; dentate gyrus; heterogeneity; hippocampus; mossy cells.


Conflict of interest statement

The authors declare no competing financial interests.

Figures

Figure 1.
Figure 1.
Two distinct MC subpopulations in mouse and monkey are spatially segregated along the septotemporal axis. A, D, Schematics depicting histological analysis across the septotemporal location in mouse (A) and monkey (D). B, E, Representative images showing GluR2/3 (red, pan-MCs marker) and CRT (green, temporal MCs marker) expressions in MCs along the septotemporal axis of the DG in mouse (B) and monkey (E). Open arrowheads represent only GluR2/3+ neurons, and filled arrowheads indicate colocalization of GluR2/3+ neurons with the CRT+ marker in the DG. C, F, Quantification of the spatial distribution of each MC subpopulation in mouse (C) and monkey (F). Septal and temporal MCs were determined based on marker pattern: GluR2/3+|CRT− as septal MCs and GluR2/3+|CRT+ as temporal MCs. The ratio for each MC subpopulation was determined by dividing the number of each subpopulation by the corresponding total number of MC subpopulations. IML, inner molecular layer; Hil, hilus; GCL, granule cell layer; D, dorsal; V, ventral; R, rostral; C, caudal; L, lateral; M, medial; A, anterior; P, posterior. Scale bars, 100 μm. Data are represented as mean ± SEM.
Figure 2.
Figure 2.
Septal and temporal MCs in mouse extend associational and commissural projections in the DG. A, Schematic of viral injections in either the septal DG or temporal DG of Calcrl-Cre mice. Calcrl-Cre mice were unilaterally injected with Cre-dependent expressing EGFP and tdTomato virus into either the septal or the temporal DG, respectively. B, Schematics depicting fluorescence imaging of the DG along the septotemporal axis of the DG in mouse. C, E, Representative images showing axonal projections of septal MCs (EGFP) and temporal MCs (tdTomato) in the ipsilateral (C) and contralateral (E) DG. D, F, Quantitative analysis of ipsilateral (D) and contralateral (F) of MC axons in the molecular layers. The EGFP+ septal MC axons or tdTomato+ temporal MC axons were measured across the molecular layers (mouse, n = 3). Axonal projections of septal MCs (EGFP) in the ipsilateral DG, F(2,6) = 26.49, p = 0.0011; axonal projections of temporal MCs (tdTomato) in the ipsilateral DG, F(2,6) = 55.8, p = 0.0001; axonal projections of septal MCs (EGFP) in the contralateral DG, F(2,6) = 6.274, p = 0.0339; axonal projections of temporal MCs in the contralateral DG, F(2,6) = 33.71, p = 0.0005. G, Schematic of viral injections in either the septal DG or temporal DG of Calcrl-Cre mice. Calcrl-Cre mice were bilaterally injected with Cre-dependent expressing EGFP and tdTomato virus into either the septal or the temporal DG, respectively. H, Three-dimensional (3D) fluorescence imaging was conducted on a virus-injected transparent brain using light-sheet fluorescence microscopy. This imaging technique allowed for a detailed three-dimensional rendering of MC projections in the hippocampus. dHil, dorsal hilus; vHil, ventral hilus; ML, molecular layer; dHP, dorsal hippocampus; vHP, ventral hippocampus; D-com, dorsal commissural fibers; V-com, ventral commissural fibers; D, dorsal; V, ventral; R, rostral; C, caudal; L, lateral; M, medial. Scale bar, 300 μm. Data are represented as mean ± SEM.
Figure 3.
Figure 3.
Septal and temporal MCs in monkey make associational projections in the ipsilateral DG, but not commissural projections in the contralateral DG. A, Schematics for viral injections in a monkey. The septal and the temporal DG of a rhesus monkey were injected with AAVs expressing EGFP and mCherry under CaMKIIa promotor, respectively. B, MRI imaging with multiple planes showing viral injection in a location-specific manner. To visualize the injection site, an MRI contrast agent was infused with AAVs. C, Imaging showing unilateral viral-injected monkey brain. D, Schematics for the septotemporal axis of the monkey DG. E, Viral-injected monkey brain were cut with a coronal plane interval of 8 mm. The number is an order of the anteroposterior axis by coronal plane. Based on the spatial distribution of MCs, we chose the brain block of #5, #6, and #7. F, Image showing the position of the DG in the uncus (temporal), mid-body (intermediate), and tail (septal) of the hippocampal formation in the monkey. G, Representative image showing fluorescent protein expressions in septal and temporal MCs of the monkey DG. CRT, a temporal MC marker (purple), labeled neurons were colocalized with mCherry-expressing neurons in the temporal DG, but not with EGFP-expressing neurons in the septal DG. Scale bar, 50 μm. Open arrowheads indicate EGFP+ neurons without the CRT+ marker (septal MCs), while filled arrowheads indicate colocalization of mCherry+ neurons with the CRT+ marker in the DG. H, J, Representative images showing axonal projections of septal and temporal MCs in the ipsilateral (H) and contralateral (J) DG. EGFP-labeled axons from septal MCs and mCherry-labeled axons from temporal MCs were observed along the septotemporal axis of the ipsilateral DG (H), but not of contralateral DG (J). Labeling of septal MC, bregma: −19.35 mm, ∼80% in the hilus; labeling of temporal MC, bregma: −11.70 mm, ∼80% in the hilus. I, K, Quantitative analysis of axonal projections density of septal and temporal MCs at the molecular layers of the ipsilateral (I) and the contralateral (K) DG along the septotemporal axis. Relative fluorescence intensity was measured randomly at three different locations of the molecular layers (monkey; n = 1; replicate, 3). Axonal projections of septal MCs (EGFP) in the ipsilateral DG, F(2,6) = 89.02, p < 0.0001; axonal projections of temporal MCs (mCherry) in the ipsilateral DG, F(2,6) = 16.58, p = 0.0036; axonal projections of septal MCs (EGFP) in the contralateral DG, F(2,6) = 0.4705, p = 0.6459; axonal projections of temporal MCs in the contralateral DG, F(2,6) = 1.814, p = 0.2420. Scale bar, 300 μm. ML, molecular layers. Data are represented as mean ± SEM.
Figure 4.
Figure 4.
Septotemporal heterogeneity of MCs in their axonal projections in the DG molecular layers in the mouse. A, Representative images showing axonal projections of septal and temporal MCs along the septotemporal axis of the DG in mouse. Scale bar, 50 μm. B, The distribution pattern of axonal fibers from septal (EGFP) and temporal (tdTomato) MCs in each molecular layer of the mouse. CRT a temporal MC marker (purple) was colocalized with tdTomato-labeled temporal MC soma (red) and their axonal fibers (tdTomato), but not with septal MCs (EGFP). The fluorescence intensity of the axonal projections of the MC subpopulations and CRT expression was measured using line scanning. Arrows and arrowheads indicate axonal fibers from septal and temporal MCs in the DG, respectively. GCL, granule cell layer; IML, inner molecular layer; MML, middle molecular layer; OML, outer molecular layer.
Figure 5.
Figure 5.
Septotemporal heterogeneity of MCs in their axonal projections in the DG molecular layers in the monkey. A, Representative images showing axonal projections of septal and temporal MCs along the septotemporal axis of the DG in monkey. Scale bar, 50 μm. B, The distribution pattern of axonal fibers from septal (EGFP) and temporal (mCherry) MCs in each molecular layer of the monkey DG. CRT a temporal MC marker (purple) was colocalized with tdTomato-labeled temporal MC soma (red) and their axonal fibers (mCherry), but not with septal MCs (EGFP). The fluorescence intensity of the axonal projections of the MC subpopulations and CRT expression was measured using line scanning. Arrowheads indicate a high density of axonal fibers from septal (EGFP) and temporal (tdTomato) MCs at each molecular layer. GCL, granule cell layer; IML, inner molecular layer; MML, middle molecular layer; OML, outer molecular layer. For axonal projection mapping in another monkey subject, please see Extended Data Figure 5-1.

Similar articles

Cited by

References

    1. Abdulmajeed WI, Wang K-Y, Wu J-W, Ajibola MI, Cheng IH-J, Lien C-C (2022) Connectivity and synaptic features of hilar mossy cells and their effects on granule cell activity along the hippocampal longitudinal axis. J Physiol 600:3355–3381. 10.1113/JP282804 - DOI - PubMed
    1. Amaral DG (1978) A Golgi study of cell types in the hilar region of the hippocampus in the rat. J Comp Neurol 182:851–914. 10.1002/cne.901820508 - DOI - PubMed
    1. Amaral DG, Witter MP (1989) The three-dimensional organization of the hippocampal formation: a review of anatomical data. Neuroscience 31:571–591. 10.1016/0306-4522(89)90424-7 - DOI - PubMed
    1. Amaral DG, Insausti R, Cowan WM (1984) The commissural connections of the monkey hippocampal formation. J Comp Neurol 224:307–336. 10.1002/cne.902240302 - DOI - PubMed
    1. Amaral DG, Scharfman HE, Lavenex P (2007) The dentate gyrus: fundamental neuroanatomical organization (dentate gyrus for dummies). Prog Brain Res 163:3–22. 10.1016/S0079-6123(07)63001-5 - DOI - PMC - PubMed

Publication types

LinkOut - more resources