. 2024 Apr 30;15(1):3653.
doi: 10.1038/s41467-024-48100-y.

Mitochondrial genome transfer drives metabolic reprogramming in adjacent colonic epithelial cells promoting TGFβ1-mediated tumor progression

Affiliations

Mitochondrial genome transfer drives metabolic reprogramming in adjacent colonic epithelial cells promoting TGFβ1-mediated tumor progression

Bingjie Guan et al. Nat Commun. .

Abstract

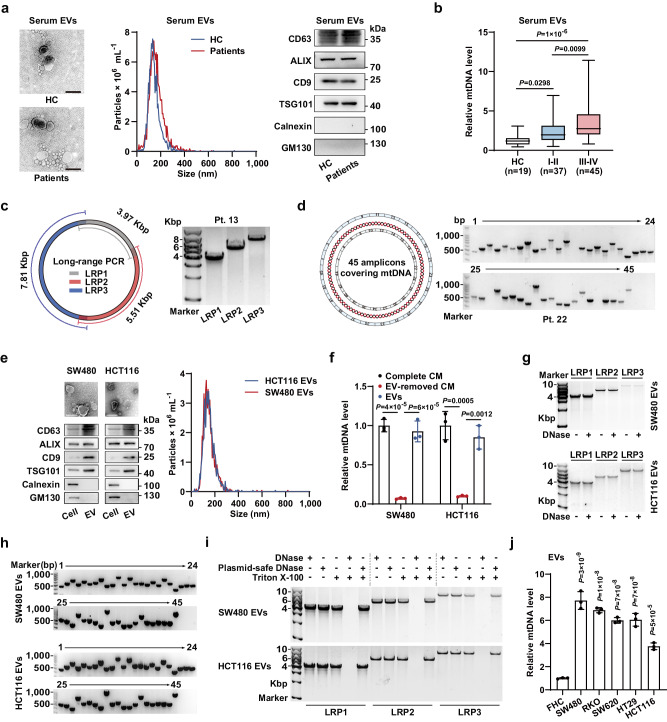
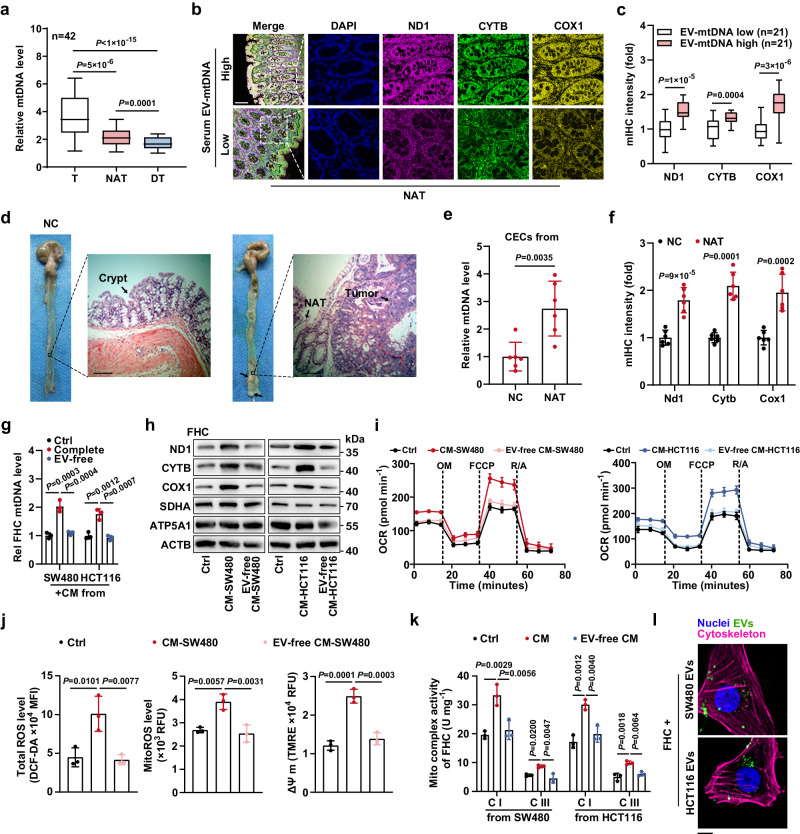
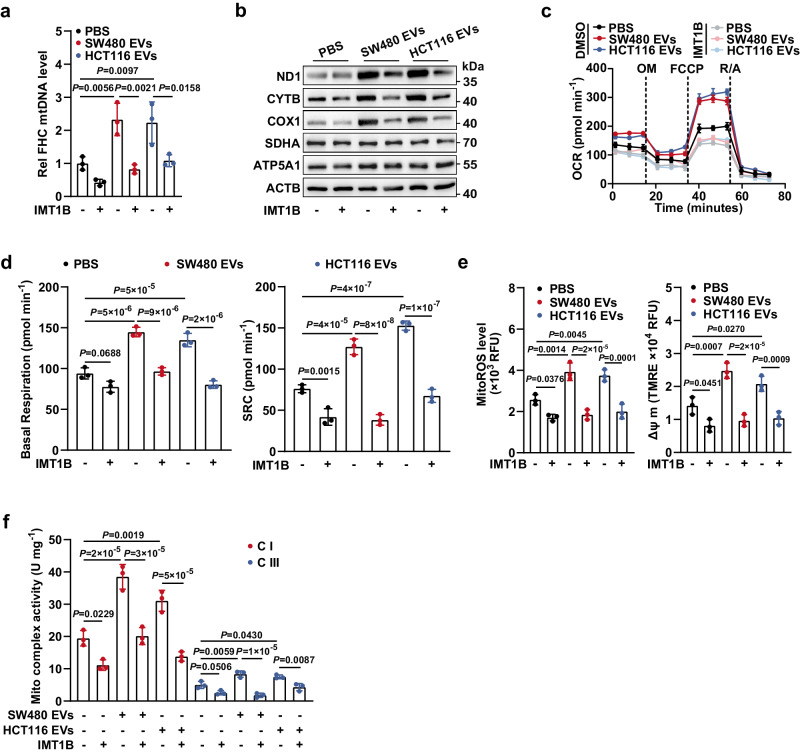
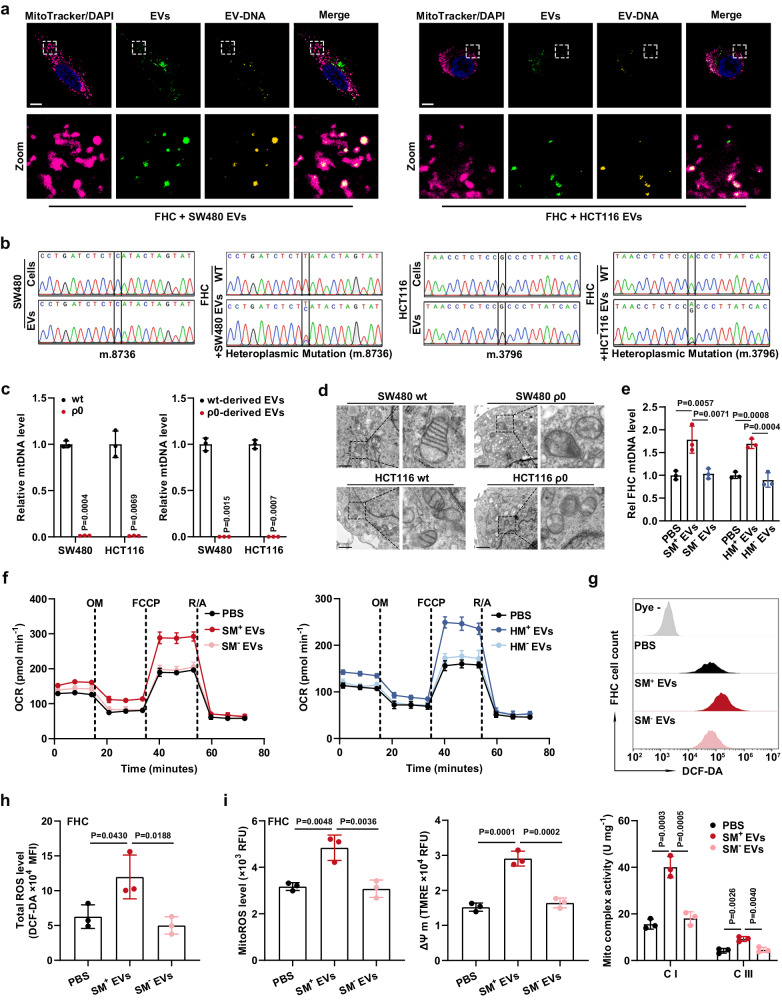
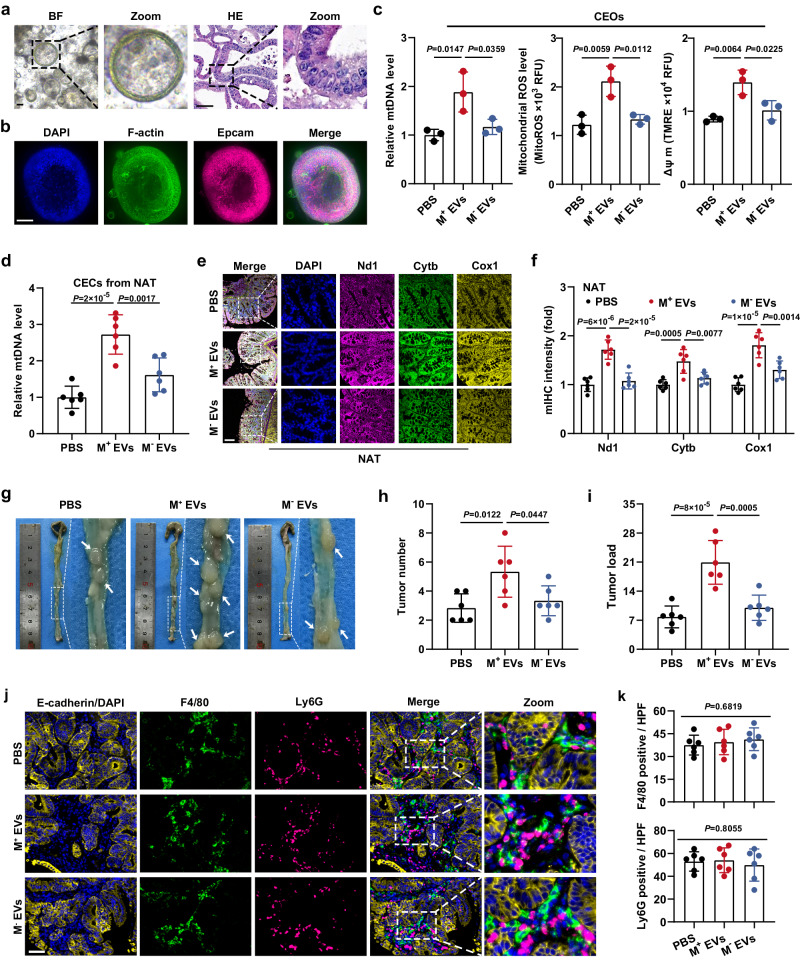
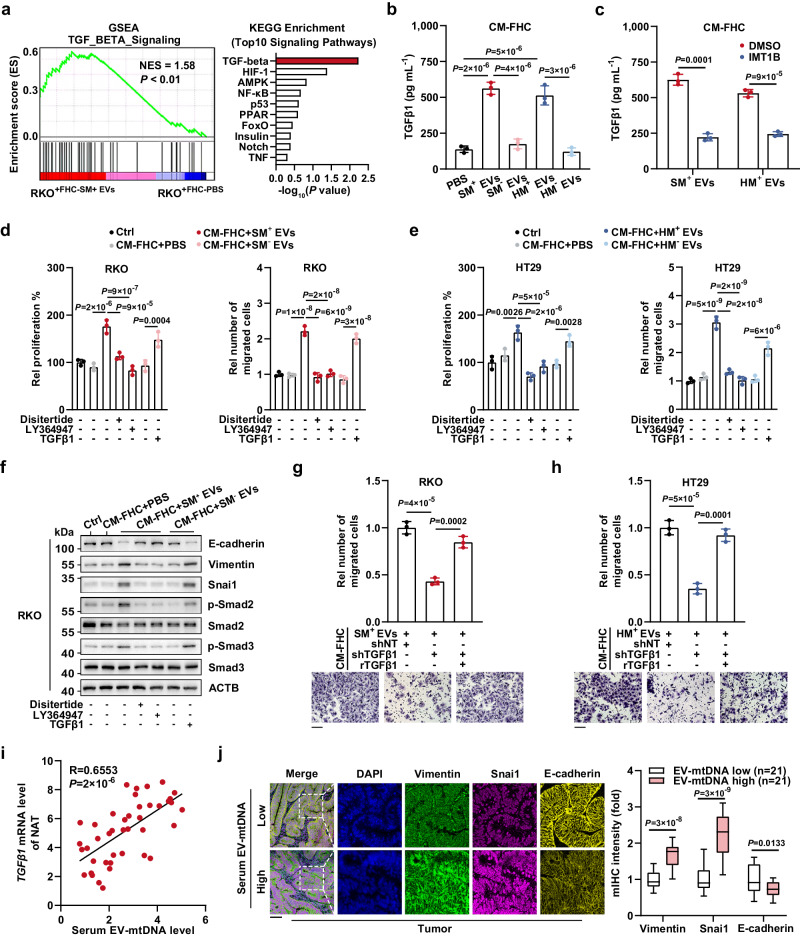
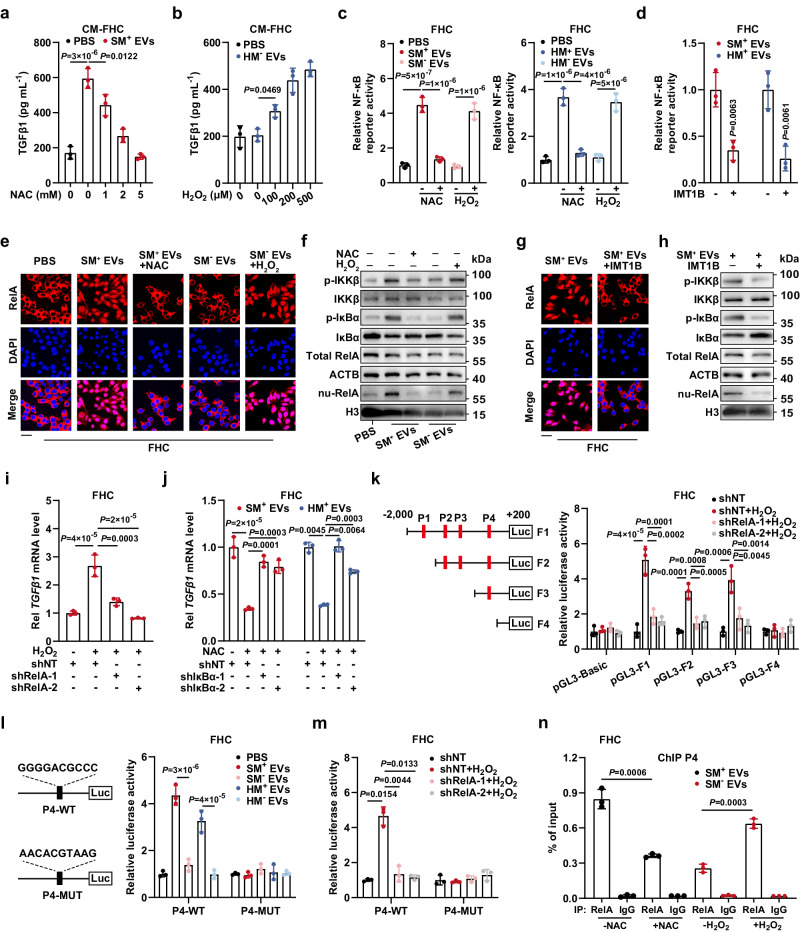
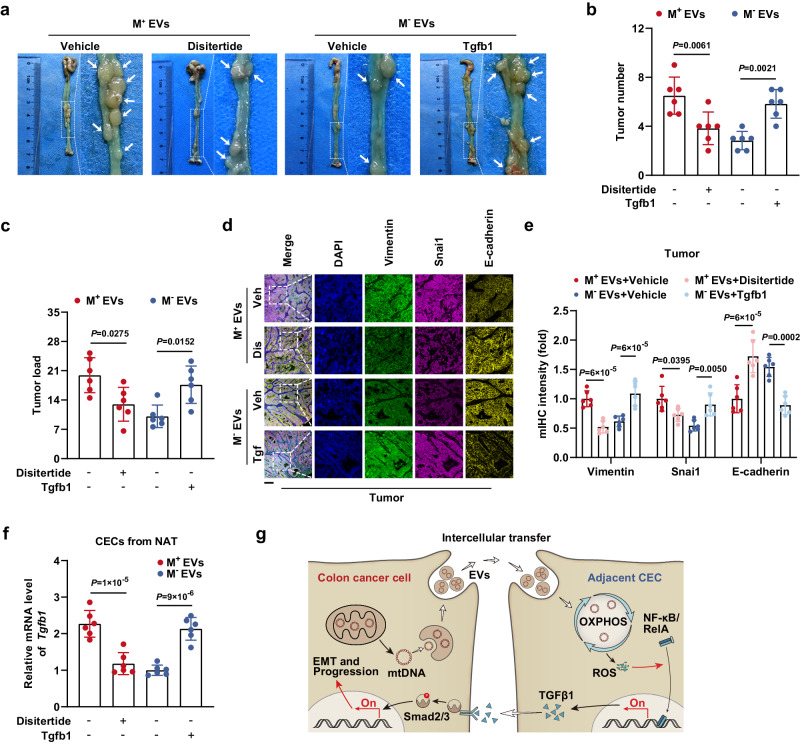
Although nontumor components play an essential role in colon cancer (CC) progression, the intercellular communication between CC cells and adjacent colonic epithelial cells (CECs) remains poorly understood. Here, we show that intact mitochondrial genome (mitochondrial DNA, mtDNA) is enriched in serum extracellular vesicles (EVs) from CC patients and positively correlated with tumor stage. Intriguingly, circular mtDNA transferred via tumor cell-derived EVs (EV-mtDNA) enhances mitochondrial respiration and reactive oxygen species (ROS) production in CECs. Moreover, the EV-mtDNA increases TGFβ1 expression in CECs, which in turn promotes tumor progression. Mechanistically, the intercellular mtDNA transfer activates the mitochondrial respiratory chain to induce the ROS-driven RelA nuclear translocation in CECs, thereby transcriptionally regulating TGFβ1 expression and promoting tumor progression via the TGFβ/Smad pathway. Hence, this study highlights EV-mtDNA as a major driver of paracrine metabolic crosstalk between CC cells and adjacent CECs, possibly identifying it as a potential biomarker and therapeutic target for CC.


Conflict of interest statement

The authors declare no competing interests.

Figures

Fig. 1
Fig. 1. Complete circular mtDNA is enriched in CC cell-derived EVs.
a Identification of EVs from the serum of healthy controls (HCs) or CC patients. The samples derive from the same experiment but different gels for CD63, GM130, and ALIX, another for Calnexin, TSG101, and another for CD9 were processed in parallel. Scale bar, 200 nm. b The relative mtDNA levels in serum EVs from HCs and patients with CC were measured by qPCR targeting the mitochondrial ND1 (2 ng of DNA was used). c Schematic diagram (left) and representative agarose gel image (right) of long-range PCR with three amplicons covering the entire mtDNA obtained from serum EVs of patients (1 ng of DNA per reaction). d Schematic diagram (left) and representative gel image (right) of 45 overlapping amplicons encoding the whole mtDNA from serum EVs of patients (1 ng of DNA per PCR). e Identification of EVs from CC cells. The samples derive from the same experiment but different gels for CD63, GM130, and ALIX, another for Calnexin, TSG101, and another for CD9 were processed in parallel. Scale bar, 200 nm. f The mtDNA levels in SW480 and HCT116 cell-derived complete CM, EV-removed CM, and the corresponding isolated EVs were measured. n = 3 independent experiments. g Representative agarose gel image of long-range PCR using three amplicons covering the entire mtDNA from SW480 and HCT116 cell-derived EVs. h Representative gel image of 45 overlapping amplicons encoding the whole mtDNA from SW480 and HCT116 cell-derived EVs pretreated with DNase. i Representative agarose gel image of long-range PCR with three amplicons covering the whole mtDNA from SW480 and HCT116 cell-derived EVs pretreated as indicated. j The relative mtDNA levels in EVs derived from the human CC cells and FHC normal human CECs were measured. n = 3 independent experiments. Data are means ± SD. The boxplots indicate median (center), 25th and 75th percentiles (bounds of box), and 2.5th and 97.5th percentiles (whiskers). One-way ANOVA with Tukey’s multiple comparisons test (f, j). Kruskal–Wallis test with two-sided Dunn’s multiple comparisons test (b). Source data are provided as a Source Data file.
Fig. 2
Fig. 2. CECs exhibit enhanced OXPHOS upon communication with CC cells in an EV-dependent manner.
a The mtDNA levels in tumor tissues (T), normal tissues adjacent to the tumor (NAT), and paired distant colonic tissues (DT) from 42 CC patients were measured. The boxplots indicate median (center), 25th and 75th percentiles (bounds of box), and 2.5th and 97.5th percentiles (whiskers). b Representative images of mIHC staining for the indicated proteins in sections from NAT of patients. Scale bar, 100 μm. c The coexpression of mitochondrial proteins was evaluated. The boxplots indicate median (center), 25th and 75th percentiles (bounds of box), and 2.5th and 97.5th percentiles (whiskers). d Representative gross view and HE images of normal colonic crypts and NAT from healthy mice (negative control, NC) and murine orthotopic CC model, respectively. Scale bar, 100 μm. e The mtDNA levels in CECs from NC mice or NAT were measured. n = 6 mice per group. f The coexpression of mitochondrial proteins was evaluated. n = 6 mice per group. Changes in the (g) mtDNA content, (h) expression levels of mitochondrial proteins, and (i) oxygen consumption rate (OCR) in FHC cells incubated with SW480 or HCT116 cell-derived complete CM or EV-removed CM. The samples derive from the same experiment but different gels for SDHA, COX1, and ND1, another for ACTB, ATP5A1, and another for CYTB were processed in parallel. Rel, relative. n = 3 independent experiments. j Changes in ROS levels and mitochondrial membrane potential (ΔΨ m) in FHC cells incubated with SW480 cell-derived complete CM or EV-removed CM. n = 3 independent experiments. k Changes in the activities of mitochondrial complexes I and III in FHC cells incubated with SW480 or HCT116 cell-derived complete CM or EV-free CM. n = 3 independent experiments. l Example images of CC cell-derived EV uptake by FHC cells. Scale bar, 10 μm. Data are means ± SD. Two-tailed t test (c, e, and f). One-way ANOVA with Tukey’s multiple comparisons test (g, j, and k). Friedman test with two-sided Dunn’s multiple comparisons test (a). Source data are provided as a Source Data file.
Fig. 3
Fig. 3. EV-induced elevation of mtDNA content is responsible for the enhanced OXPHOS in CECs.
a FHC cells were educated with EVs derived from SW480 or HCT116 cells, in the presence or absence of IMT1B treatment (1 μM, 48 h). Then, the mtDNA content in FHC cells was determined. Rel, relative. n = 3 biological replicates. b Changes in expression levels of mtDNA-encoded proteins (ND1, CYTB, and COX1) and nuclear DNA-encoded mitochondrial proteins (SDHA and ATP5A1) in FHC cells. FHC cells were treated as described in a. The samples derive from the same experiment but different gels for SDHA, COX1, and ND1, another for ACTB, ATP5A1, and another for CYTB were processed in parallel. Changes in (c) OCR and (d) basal/spare respiratory capacities of FHC cells which were treated as described in a. SRC, spare respiratory capacity. n = 3 biological replicates. Changes in (e) mitochondrial ROS levels and ΔΨ m, and (f) activities of mitochondrial complex I and III in FHC cells. FHC cells were treated as described in a. n = 3 biological replicates. Data are means ± SD. One-way ANOVA with Tukey’s multiple comparisons test. Source data are provided as a Source Data file.
Fig. 4
Fig. 4. Transfer of EV-mtDNA leads to enhanced OXPHOS in CECs.
a Confocal images of FHC cells incubated for 24 h with SW480- or HCT116-derived EVs. MitoTracker-labeled mitochondria (magenta), PKH67-labeled EVs (green), EtBr-labeled EV-DNA (yellow), and their co-localization (pale yellow). Scale bar, 10 μm. b Sanger sequencing was performed to detect point mutations in mtDNA purified from CC cells (SW480 and HCT116), their corresponding EVs, and FHC cells with or without tumor cell-derived EV education. c The relative mtDNA levels in SW480, SW480 ρ0, HCT116, and HCT116 ρ0 cells and their corresponding EVs were measured by qPCR. n = 3 biological replicates. d Mitochondrial structure in SW480, HCT116, and their corresponding ρ0 cells was observed using electron microscopy. Scale bar, 1 μm. e, f A subset of FHC cells was educated with mtDNA-sufficient EVs derived from wild-type SW480 cells (SM+ EVs) or HCT116 cells (HM+ EVs), and another subset of FHC cells was educated with mtDNA-depleted EVs derived from SW480 ρ0 cells (SM EVs) or HCT116 ρ0 cells (HM EVs). After incubation for 7 days, the (e) mtDNA copy number and (f) oxygen consumption rate (OCR) in these processed FHC cells were determined. Rel, relative. n = 3 independent experiments. g Representative flow cytometric plot and h statistical results of total ROS levels in FHC cells educated with SM+ EVs or SM EVs for 7 days. n = 3 biological replicates. i Changes in mitochondrial ROS levels, mitochondrial membrane potential (ΔΨ m), and the activities of mitochondrial complexes I and III in FHC cells educated with SM+ EVs or SM EVs for 7 days. n = 3 independent experiments. Data are means ± SD. Two-tailed t test (c). One-way ANOVA with Tukey’s multiple comparisons test (e, h, and i). Source data are provided as a Source Data file.
Fig. 5
Fig. 5. EV-mtDNA-educated CECs contribute to tumor progression.
Murine colonic epithelial organoids (CEOs) were authenticated using (a) bright-field (BF) pictures, HE staining, and (b) immunofluorescence staining. Scale bar, 50 μm. c Changes in mtDNA content, mitochondrial ROS levels, and mitochondrial membrane potential (ΔΨ m) in CEOs incubated with murine mtDNA-enriched EVs (M+ EVs) or mtDNA-depleted EVs (M EVs). n = 3 independent experiments. d Determination of mtDNA content in CECs isolated from NAT in the murine orthotopic CC model treated with intraperitoneal injections of EVs derived from wild-type MC38 cells (M+ EVs) or mtDNA-depleted MC38 ρ0 cells (M EVs). n = 6 mice per group. e Representative images of mIHC staining for DAPI (blue), Nd1 (magenta), Cytb (green), and Cox1 (yellow) in sections from NAT in the murine orthotopic CC model treated with intraperitoneal injections of M+ EVs or M EVs. Scale bar, 100 μm. f The coexpression of Nd1, Cytb, and Cox1 was evaluated by quantification of the fluorescence intensity in e. n = 6 mice per group. g Representative gross view and statistical results of the (h) tumor number and (i) tumor load in the murine orthotopic CC model treated with intraperitoneal injections of M+ EVs or M EVs. n = 6 mice per group. j Representative images of mIHC staining for DAPI (blue), epithelial marker (E-cadherin, yellow), macrophage marker (F4/80, green), and neutrophil marker (Ly6G, magenta) in sections from tumors in the murine orthotopic CC model treated with M+ EVs or M EVs. k Statistical analysis of the number of F4/80-positive or Ly6G-positive cells per high power field (HPF) was then performed. Scale bar, 50 μm. n = 6 mice per group. Data are means ± SD. One-way ANOVA with Tukey’s multiple comparisons test. Source data are provided as a Source Data file.
Fig. 6
Fig. 6. TGFβ1 upregulation by EV-mtDNA education results in CEC-enhanced tumor malignancy.
a A 0.4-μm Transwell membrane was used to coculture RKO cells with FHC cells prestimulated with SM+ EVs or PBS. Then, the RKO cells were processed for transcriptome sequencing. GSEA using a two-sided permutation test and KEGG pathway enrichment analysis using a two-sided hypergeometric test were performed. b ELISAs were performed to quantify TGFβ1 in CM from FHC. n = 3 independent experiments. c TGFβ1 in CM from EV-educated FHC cells with or without IMT1B treatment (1 μM, 48 h) was quantified. n = 3 independent experiments. d RKO and e HT29 were incubated with CM from FHC cells pretreated with mtDNA-rich or mtDNA-depleted EVs and treated with disitertide (10 μM), LY364947 (1 μM), or TGFβ1 (1 ng mL−1). Then, the proliferation and migration abilities were determined. Rel, relative. n = 3 independent experiments. f The levels of phosphorylated Smad2/3 and EMT markers were examined. The samples derive from the same experiment but different gels for E-cadherin, Vimentin, and Snai1, another for ACTB, p-Smad2, another for Smad2, p-Smad3, and another for Smad3 were processed in parallel. g, h FHC cells expressing shNT or shTGFβ1 were infected with lentivirus expressing rTGFβ1, followed by education with SM+ EVs or HM+ EVs. Then, (g) RKO and (h) HT29 cells were incubated with CM from the processed FHC cells for 48 h. A Transwell migration assay was performed. Rel, relative. Scale bar, 100 μm. n = 3 independent experiments. i The correlation between the serum EV-mtDNA and TGFβ1 mRNA levels in NAT from CC patients (n = 42) was analyzed using two-sided Pearson correlation analysis. j Representative images of mIHC staining in sections of tumor tissues from CC patients. Scale bar, 100 μm. The coexpression of EMT markers was evaluated. Data are means ± SD. The boxplots indicate median (center), 25th and 75th percentiles (bounds of box), and 2.5th and 97.5th percentiles (whiskers). Two-tailed t test (c, j). One-way ANOVA with Tukey’s multiple comparisons test (b, d, e, g, and h). Source data are provided as a Source Data file.
Fig. 7
Fig. 7. EV-mtDNA transfer promotes TGFβ1 transcription via ROS-mediated activation of the NF-κB pathway.
a ELISAs were performed to quantify TGFβ1 in CM from FHC. n = 3 independent experiments. b TGFβ1 in CM from FHC in the presence or absence of H2O2 stimulation was quantified. n = 3 independent experiments. c NF-κB reporter activity was measured. Subsets of FHC cells were treated with NAC (5 mM) or H2O2 (500 μM). n = 3 independent experiments. d NF-κB reporter activity in FHC with or without IMT1B treatment (1 μM) was measured. n = 3 independent experiments. The RelA activation was evaluated by (e) immunofluorescence and (f) immunoblotting. Scale bar, 30 μm. The RelA activation was evaluated by (g) immunofluorescence and (h) immunoblotting. Scale bar, 30 μm. i FHC cells expressing shNT or shRelA were stimulated with H2O2. TGFβ1 mRNA levels were then determined. Rel, relative. n = 3 independent experiments. j FHC cells expressing shNT or shIκBα were treated with NAC. Subsequently, TGFβ1 mRNA levels were determined. Rel, relative. n = 3 independent experiments. k The binding site truncation mutants inserted into the pGL3 vector were transfected into FHC cells. The luciferase activity was monitored. n = 3 independent experiments. l The luciferase activity of reporters containing the wild-type or mutated P4 binding site was determined. n = 3 independent experiments. m Luciferase reporter plasmids containing the wild-type or mutated P4 binding site were transfected into FHC cells. Then, luciferase activity was measured. n = 3 independent experiments. n ChIP assays were performed to evaluate RelA enrichment on P4. n = 3 independent experiments. As shown in f and h, the total protein samples derive from the same experiment but different gels for IKKβ, p-IκBα, and another for p-IKKβ, total RelA, ACTB, and IκBα were processed in parallel. The nuclear protein samples for detecting nu-RelA and H3 were processed on the same gel. Data are means ± SD. Two-tailed t test (d, n). One-way ANOVA with Tukey’s (ac, il) or Games-Howell’s (j, m) multiple comparisons test (two-sided). Source data are provided as a Source Data file.
Fig. 8
Fig. 8. TGFβ1 expression driven by EV-mtDNA transfer promotes tumor progression in vivo.
a Representative gross view and statistical results of (b) tumor number and (c) tumor load in mice in the disitertide- or Tgfb1-treated murine orthotopic CC model, which received intraperitoneal injections of M+ EVs or M EVs. n = 6 mice per group. d Representative images of mIHC staining for DAPI (blue), Vimentin (green), Snai1 (magenta), and E-cadherin (yellow) in sections from tumor tissues in the murine orthotopic CC model treated as indicated. Veh Vehicle, Dis Disitertide, Tgf Tgfb1. Scale bar, 100 μm. e The coexpression of E-cadherin, Vimentin, and Snai1 was then evaluated by quantification of the fluorescence intensity. n = 6 mice per group. f The Tgfb1 mRNA levels in CECs isolated from NAT in the murine orthotopic CC model treated as indicated were measured. n = 6 mice per group. g Schematic model showing the mechanism by which the crosstalk between CC cells and normal CECs contributes to tumor progression. Data are means ± SD. One-way ANOVA with Tukey’s multiple comparisons test. Source data are provided as a Source Data file.

References

    1. Sung H, et al. Global cancer statistics 2020: GLOBOCAN estimates of incidence and mortality worldwide for 36 cancers in 185 countries. CA Cancer J. Clin. 2021;71:209–249. doi: 10.3322/caac.21660. - DOI - PubMed
    1. André T, et al. Pembrolizumab in microsatellite-instability-high advanced colorectal cancer. N. Engl. J. Med. 2020;383:2207–2218. doi: 10.1056/NEJMoa2017699. - DOI - PubMed
    1. Zhao S, et al. LncRNA MIR17HG promotes colorectal cancer liver metastasis by mediating a glycolysis-associated positive feedback circuit. Oncogene. 2021;40:4709–4724. doi: 10.1038/s41388-021-01859-6. - DOI - PMC - PubMed
    1. Davidson S, et al. Fibroblasts as immune regulators in infection, inflammation and cancer. Nat. Rev. Immunol. 2021;21:704–717. doi: 10.1038/s41577-021-00540-z. - DOI - PubMed
    1. Morrissey SM, et al. Tumor-derived exosomes drive immunosuppressive macrophages in a pre-metastatic niche through glycolytic dominant metabolic reprogramming. Cell Metab. 2021;33:2040–2058.e10. doi: 10.1016/j.cmet.2021.09.002. - DOI - PMC - PubMed

Publication types

MeSH terms