. 2024 Apr 30;15(1):3342.
doi: 10.1038/s41467-024-47456-5.

Dopamine signaling enriched striatal gene set predicts striatal dopamine synthesis and physiological activity in vivo

Affiliations

Dopamine signaling enriched striatal gene set predicts striatal dopamine synthesis and physiological activity in vivo

Leonardo Sportelli et al. Nat Commun. .

Abstract

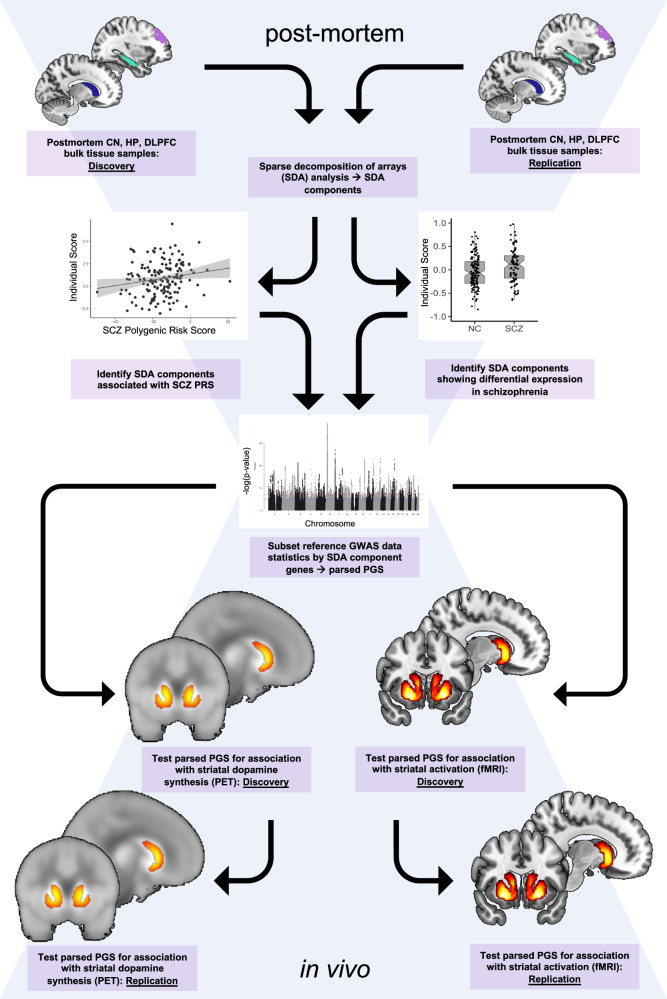
The polygenic architecture of schizophrenia implicates several molecular pathways involved in synaptic function. However, it is unclear how polygenic risk funnels through these pathways to translate into syndromic illness. Using tensor decomposition, we analyze gene co-expression in the caudate nucleus, hippocampus, and dorsolateral prefrontal cortex of post-mortem brain samples from 358 individuals. We identify a set of genes predominantly expressed in the caudate nucleus and associated with both clinical state and genetic risk for schizophrenia that shows dopaminergic selectivity. A higher polygenic risk score for schizophrenia parsed by this set of genes predicts greater dopamine synthesis in the striatum and greater striatal activation during reward anticipation. These results translate dopamine-linked genetic risk variation into in vivo neurochemical and hemodynamic phenotypes in the striatum that have long been implicated in the pathophysiology of schizophrenia.


Conflict of interest statement

E.D. and G.P. received lecture fees from Lundbeck. A.R. received travel fees from Lundbeck. A.B. received consulting fees from Biogen and lecture fees from Otsuka, Janssen, and Lundbeck. O.D.H. has received investigator-initiated research funding from and/or participated in advisory/speaker meetings organized by Angelini, Autifony, Biogen, Boehringer Ingelheim, Eli Lilly, Heptares, Global Medical Education, Invicro, Janssen, Lundbeck, Neurocrine, Otsuka, Sunovion, Recordati, Roche and Viatris/Mylan and was a part-time employee of H Lundbeck A/s. O.D.H. and M.V. have a patent for the use of dopaminergic imaging. D.R.W. serves on the Scientific Advisory Boards of Sage Therapeutics and Pasithea Therapeutics. The remaining authors declare no competing interests.

Figures

Fig. 1
Fig. 1
Graphic summary of the study design.
Fig. 2
Fig. 2. Sparse decomposition of arrays (SDA) component characterization.
a Notched box plots show SDA component C80 and C109 scores for post-mortem data samples in SCZ and NC groups (n  =  229 individuals; 145 NC and 84 SCZ). These were the only components showing a significant group effect. Group medians (horizontal line), 95% confidence intervals (notches), interquartile range (box edges), and whiskers (25th/75th percentiles or extrema) are shown. The scatter plot demonstrates SDA component C80 and C109 scores as a function of polygenic risk for schizophrenia and includes a regression fit line with mean fitted values and related shaded 95% confidence interval shown (n = 103 individuals; 64 NC and 39 SCZ). C80 is the only one with a significant PRS association consistent with diagnosis direction. Source data are provided as a Source Data file. b Gene enrichment analysis results are shown for the C80 component. From the bottom, the first (GWAS), second (MAGMA), and third orange grids (H-MAGMA) show enrichment results for schizophrenia risk genes, other psychiatric illness risk genes, and immune condition risk genes. Enrichment testing results are shown for differentially expressed genes, differentially methylated genes, and loss of function variant intolerant genes in the green grid. The final light-blue grid shows C80 tissue specificity as determined by the tissue scores generated during the SDA process and reflects the relative contribution of component gene networks within each of the sampled regions to the overall component. Adjusted p-values shown are empirical p-values obtained from permutation tests (overrepresentation analysis: one-sided Fisher exact test). c Venn diagram shows the intersection between C80 genes and SCZ, MDD, and ADHD GWAS risk genes. Blank regions indicate no common genes. In the case of a single gene result, that gene is listed. d Cell-type specificity of C80 component using human (left) and mouse (right) single-cell atlases. Mean-rank Gene Set Test in the limma R package was used to obtain the enrichment p-values shown. y-axes show FDR-adjusted p-values after correcting for multiple comparisons across components (N = 69) and cell types (human atlas = 10; mouse atlas = 24). Red dashed lines represent α[FDR] = 0.05. Individual data points are shown using overlaid dot plots. Barplots demonstrate a higher specificity for GABAergic, medium spiny, and dopaminergic neurons. Source data are provided as a Source Data file. ADHD attention deficit hyperactivity disorder, ASC astrocytes, ASD autism spectrum disorder, BD bipolar disorder, CD Crohn’s disease, CN Caudate Nucleus, DEGs differentially expressed genes, DLPFC dorsolateral prefrontal cortex, DMGs differentially methylated genes, END endothelial cells, HP hippocampus, exCA pyramidal neurons from the hippocampal CA region, exDG granule neurons from the hippocampal dentate gyrus, exPFC pyramidal neurons from the prefrontal cortex, GABA GABAergic interneurons, LoF loss of function intolerant genes, MDD major depressive disorder, MG microglia, NC Neurotypical controls, NSC neuronal stem cells, OCD obsessive-compulsive disorder, ODC oligodendrocytes, OPC oligodendrocyte precursor cells, PRS polygenic risk score as reported by the third wave (primary) analyses of the Psychiatric Genetics Consortium; PTSD posttraumatic stress disorder, SA suicide attempt, SCZ Patients with schizophrenia, UC ulcerative colitis.
Fig. 3
Fig. 3. Synaptic dopaminergic specificity of C80.
a, b Gene ontology (cellular compartment) and KEGG enrichment of C80 for both pre and post-synaptic compartments as well as dopaminergic, GABAergic, and glutamatergic synapses. Overrepresentation analysis was performed using the clusterProfiler R package and FDR-adjusted p-values are reported. Diamonds represent fold enrichment (x-axis) for each Gene ontology category (y-axis) and are colored based on the respective adjusted p-value. c Venn Diagram shows the intersection between C80 genes and genes expressed in subpopulations of D1- and D2-expressing MSNs in the nucleus accumbens as defined by Tran, Maynard. A larger intersection is found with D2-MSN than D1-MSN. d Overlap between SDA components generated from the LIBD and GTEx datasets that are significantly replicated (one-sided permutation test; empirical p-value < 0.001) using JI or gene loading correlation. Discovery C80 and replication C18 are one of the 4 pairs of components consistent with both JI and gene loading. JI jaccard index, MSN medium spiny neurons.
Fig. 4
Fig. 4. C80-PRS association with neuroimaging parameters: striatal dopamine synthesis capacity ([18F]-FDOPA PET) and reward anticipation-related fMRI activation (fMRI BOLD).
a Associations between C80-PRS and both PET cohorts are shown. First row (PET discovery; n = 84 individuals; 64 NC and 20 SCZ): on the left whole-striatum region of interest (ROI) coverage (red) is shown overlaid on a grayscale standardized [18F]-FDOPA PET activity map; on the right graphs shows standardized individual mean Ki values for this ROI plotted against C80-PRS for the neurotypical control and SCZ subjects (upper) as well as the forest plot of the metanalysis (lower). Second row (PET replication; n = 150 NC): Region of a positive association between C80-PRS and presynaptic dopamine synthesis capacity ([18F]-FDOPA Ki) is shown as a statistic parametric map (color indicates t-statistic value) overlaid on a grayscale standardized [18F]-FDOPA PET activity map (p < 0.005, uncorrected for display). The scatter plot shows standardized individual mean Ki values for a 2 mm sphere around the peak voxel plotted against C80-PRS. Mean fitted values and related shaded 95% confidence interval are shown in the scatterplots. Fisher’s r-to-z transformed correlation coefficients and related 99.5% confidence interval are shown in the forest plot. Source data are provided as a Source Data file. b Associations between C80-PRS and both fMRI cohorts are shown. First (fMRI discovery; n = 86 NC) and second (fMRI replication; n = 55 NC) rows: Regions of positive association between C80-PRS and fMRI BOLD response during reward anticipation are shown as statistic parametric maps (color indicates the threshold-free cluster enhancement (TFCE) statistics expressed in the –log10 scale). All results meet thresholds of p[TFCE-FDR] < 0.05 and cluster extent >20 voxels. Scatter plots show standardized individual MID-related fMRI BOLD contrasts plotted against C80-PRS with mean fitted values and related shaded 95% confidence interval shown. Source data are provided as a Source Data file.

References

    1. Harrison PJ, Weinberger DR. Schizophrenia genes, gene expression, and neuropathology: on the matter of their convergence. Mol. Psychiatry. 2005;10:40–68. doi: 10.1038/sj.mp.4001558. - DOI - PubMed
    1. Trubetskoy V, et al. Mapping genomic loci implicates genes and synaptic biology in schizophrenia. Nature. 2022;604:502–508. doi: 10.1038/s41586-022-04434-5. - DOI - PMC - PubMed
    1. Fromer M, et al. Gene expression elucidates functional impact of polygenic risk for schizophrenia. Nat. Neurosci. 2016;19:1442–1453. doi: 10.1038/nn.4399. - DOI - PMC - PubMed
    1. Parikshak NN, Gandal MJ, Geschwind DH. Systems biology and gene networks in neurodevelopmental and neurodegenerative disorders. Nat. Rev. Genet. 2015;16:441–458. doi: 10.1038/nrg3934. - DOI - PMC - PubMed
    1. Gandal MJ, Leppa V, Won H, Parikshak NN, Geschwind DH. The road to precision psychiatry: translating genetics into disease mechanisms. Nat. Neurosci. 2016;19:1397–1407. doi: 10.1038/nn.4409. - DOI - PMC - PubMed

Publication types