

Improved biomass burning emissions from 1750 to 2010 using ice core records and inverse modeling
- PMID: 38688918
- PMCID: PMC11061293
- DOI: 10.1038/s41467-024-47864-7
Improved biomass burning emissions from 1750 to 2010 using ice core records and inverse modeling
Abstract
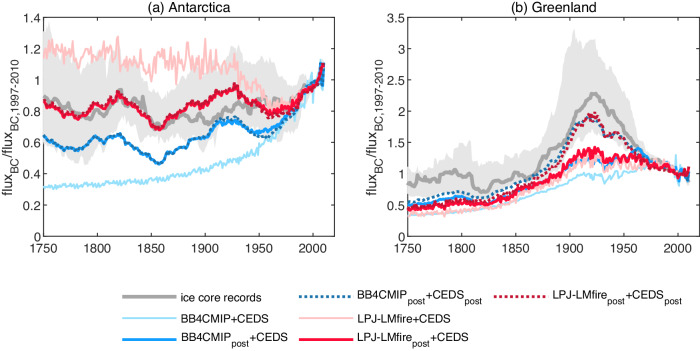
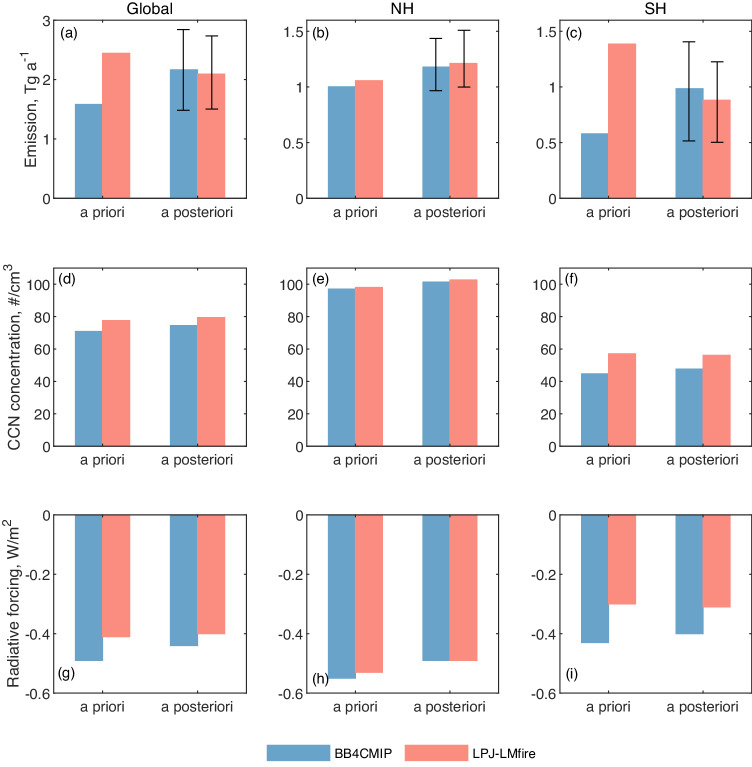
Estimating fire emissions prior to the satellite era is challenging because observations are limited, leading to large uncertainties in the calculated aerosol climate forcing following the preindustrial era. This challenge further limits the ability of climate models to accurately project future climate change. Here, we reconstruct a gridded dataset of global biomass burning emissions from 1750 to 2010 using inverse analysis that leveraged a global array of 31 ice core records of black carbon deposition fluxes, two different historical emission inventories as a priori estimates, and emission-deposition sensitivities simulated by the atmospheric chemical transport model GEOS-Chem. The reconstructed emissions exhibit greater temporal variabilities which are more consistent with paleoclimate proxies. Our ice core constrained emissions reduced the uncertainties in simulated cloud condensation nuclei and aerosol radiative forcing associated with the discrepancy in preindustrial biomass burning emissions. The derived emissions can also be used in studies of ocean and terrestrial biogeochemistry.
© 2024. The Author(s).
Conflict of interest statement
The authors declare no competing interests.
Figures

References
-
- Giglio L, Randerson JT, van der Werf GR. Analysis of daily, monthly, and annual burned area using the fourth-generation global fire emissions database (GFED4) J. Geophys. Res.: Biogeosciences. 2013;118:317–328. doi: 10.1002/jgrg.20042. - DOI
-
- Giglio L, et al. Assessing variability and long-term trends in burned area by merging multiple satellite fire products. Biogeosciences. 2010;7:1171–1186. doi: 10.5194/bg-7-1171-2010. - DOI
-
- Lentile LB, et al. Remote sensing techniques to assess active fire characteristics and post-fire effects. Int. J. Wildland Fire. 2006;15:319–345. doi: 10.1071/WF05097. - DOI
-
- Giglio L, van der Werf GR, Randerson JT, Collatz GJ, Kasibhatla P. Global estimation of burned area using MODIS active fire observations. Atmos. Chem. Phys. 2006;6:957–974. doi: 10.5194/acp-6-957-2006. - DOI
Grants and funding
- 2102917/NSF | GEO | Division of Atmospheric and Geospace Sciences (AGS)
- 2102918/NSF | GEO | Division of Atmospheric and Geospace Sciences (AGS)
- 2117844/NSF | GEO | Division of Atmospheric and Geospace Sciences (AGS)
- 1702814/NSF | GEO | Division of Atmospheric and Geospace Sciences (AGS)
- start-up funding/Georgia Institute of Technology (Georgia Tech)
LinkOut - more resources
Full Text Sources
