. 2024 Apr 30;15(1):3554.
doi: 10.1038/s41467-024-46966-6.

Genomic deletion of Bcl6 differentially affects conventional dendritic cell subsets and compromises Tfh/Tfr/Th17 cell responses

Affiliations

Genomic deletion of Bcl6 differentially affects conventional dendritic cell subsets and compromises Tfh/Tfr/Th17 cell responses

Hongkui Xiao et al. Nat Commun. .

Abstract

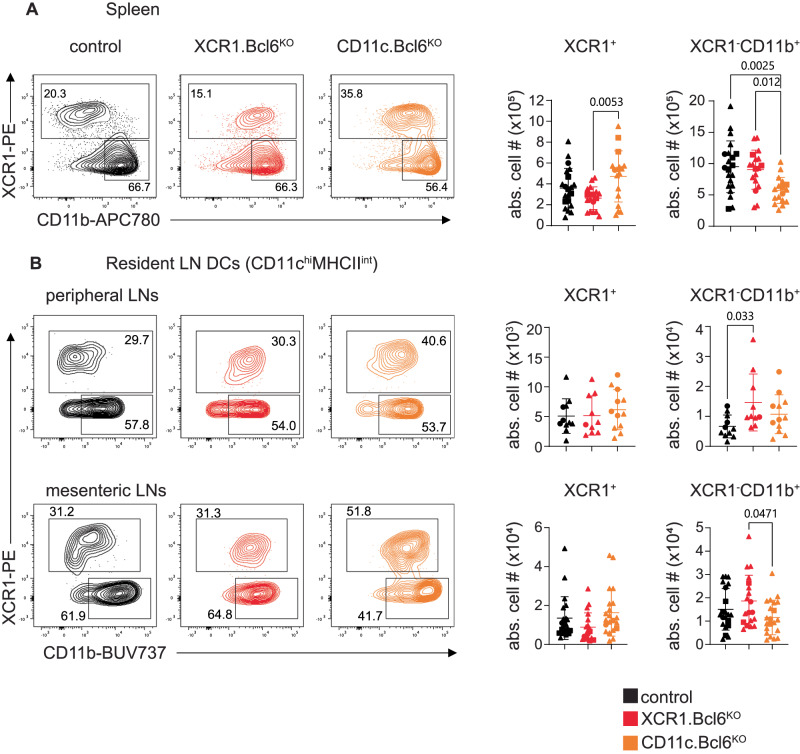
Conventional dendritic cells (cDC) play key roles in immune induction, but what drives their heterogeneity and functional specialization is still ill-defined. Here we show that cDC-specific deletion of the transcriptional repressor Bcl6 in mice alters the phenotype and transcriptome of cDC1 and cDC2, while their lineage identity is preserved. Bcl6-deficient cDC1 are diminished in the periphery but maintain their ability to cross-present antigen to CD8+ T cells, confirming general maintenance of this subset. Surprisingly, the absence of Bcl6 in cDC causes a complete loss of Notch2-dependent cDC2 in the spleen and intestinal lamina propria. DC-targeted Bcl6-deficient mice induced fewer T follicular helper cells despite a profound impact on T follicular regulatory cells in response to immunization and mounted diminished Th17 immunity to Citrobacter rodentium in the colon. Our findings establish Bcl6 as an essential transcription factor for subsets of cDC and add to our understanding of the transcriptional landscape underlying cDC heterogeneity.


Conflict of interest statement

The authors declare no competing interests.

Figures

Fig. 1
Fig. 1. Phenotype and abundance of lymphoid tissue-resident cDC lacking Bcl6.
A Left: Splenic XCR1+ and XCR1CD11b+ dendritic cell (DC) subsets in control (black), XCR1.Bcl6KO (red), and CD11c.Bcl6KO (orange) mice. Plots show representative staining profiles of gated live, single lineage- (CD3, CD19, CD64, B220, NK1.1), MHCII+, and CD11chi splenocytes. Right: Absolute numbers of splenic XCR1+ and XCR1CD11b+ DC from control, XCR1.Bcl6KO, and CD11c.Bcl6KO mice. Statistical analysis by one-way ANOVA, exact P values are annotated. Data points represent values from individual mice pooled from 8 to 9 experiments with 1–5 mice per group, and lines represent means ± SD. B Left: Flow cytometry plots showing resident XCR1+ and XCR1CD11b+ DC subsets in the peripheral and mesenteric lymph nodes (pLN and mLN) of control, XCR1.Bcl6KO, and CD11c.Bcl6KO mice. Plots show representative staining profiles of gated single live, CD45+, lineage (CD3, CD19, CD64, B220, NK1.1), CD11chiMHCIIint resident DC. Right: Absolute numbers of resident cDC subsets in the pLN and mLN of control, XCR1.Bcl6KO, and CD11c.Bcl6KO mice. Statistical analysis by one-way ANOVA, exact P values are annotated. Data points represent values from individual mice pooled from 4 (pLN) and 8 (mLN) experiments with 2–3 (pLN) and 1–6 mice (mLN) per group, and lines represent means ± SD. Circles: females; triangles: males; squares: sex-information missing.
Fig. 2
Fig. 2. Phenotype and abundance of migratory cDC subsets lacking Bcl6.
A Left: Flow cytometry plots showing migratory XCR1+ and XCR1CD11b+ dendritic cell (DC) subsets in the peripheral lymph nodes (LN) (pLN, top) and mediastinal LN (mLN, middle) of control (black), XCR1.Bcl6KO (red), and CD11c.Bcl6KO (orange) mice. mLN XCR1 DC are further sub-divided into CD103+ and CD103 (bottom). Plots show representative staining profiles of live single, CD45+, lineage (CD3, CD19, CD64, B220, NK1.1), CD11cintMHCIIhi migratory DC. Right: Absolute numbers of migratory cDC subsets from pLN and mLN of control, XCR1.Bcl6KO, and CD11c.Bcl6KO mice. Statistical analysis by one-way ANOVA, exact P values are annotated. Data points represent values from individual mice pooled from 4 (pLN) and 8 (mLN) experiments with 2–3 (pLN) and 1–6 mice (mLN) per group, and lines represent means ± SD. B Left: Flow cytometry plots showing SILP XCR1+ and XCR1CD11b+ DC subsets from control, XCR1.Bcl6KO, and CD11c.Bcl6KO mice. Plots show representative staining profiles of live, CD45+, lineage (CD3, CD19, CD64, B220, NK1.1), MHCII+, CD11chi gated single cells. Right: Absolute numbers of XCR1+ and XCR1CD11b+ DC subsets from control, XCR1.Bcl6KO, and CD11c.Bcl6KO mice. Statistical analysis was performed by one-way ANOVA, exact P values are annotated. Data points represent values from individual mice pooled from 2 to 3 experiments with 2–3 mice per group, and lines represent means ± SD. Circles: females; triangles: males; squares: sex-information missing.
Fig. 3
Fig. 3. Lineage identity of splenic Bcl6-deficient cDC subsets.
A Principal component analysis (PCA) plot of gene expression data obtained from bulk RNA-seq using DESeq2 (PRJNA834905). Color-coded icons show classical dendritic cells (cDC)1 and cDC2 from the spleen of control, XCR1.Bcl6KO, and XCR1.Bcl6KO mice. Three replicates were included in each group. B Heatmap of selected highly expressed cDC1 or cDC2 associated genes in all RNA-Seq samples (50 most differentially expressed genes between cDC1 and cDC2 chosen from the 100 genes with highest expression level among total differentially expressed genes (fold change ≥ 2, padj: 0.01, calculated by DESeq2 using Benjamini–Hochberg corrections of two-sided Wald test P values) in control samples). The color scale represents the row Z score. C Volcano plots showing the global transcriptional differences between splenic cDC2 and cDC1 in control (left), XCR1.Bcl6KO (middle) and CD11c.Bcl6KO mice (right). Each circle represents one gene. The log2FoldChange (LFC) is represented on the x-axis. The y-axis shows the −(log10 of the p adjust value). A padj value of 0.01 (calculated by DEseq2 using Benjamini–Hochberg corrections of two-sided Wald test P values) and an absolute LFC of 1 is indicated by dashed lines. The upregulated or downregulated genes are shown in red or blue dots, respectively, and the top-ranked gene symbols with the lowest padj value were annotated in the plot. D VENN diagram showing significantly elevated differentially expressed genes (DEG) (|Log2foldchange | ≥1 and padj < 0.01) between XCR1.Bcl6KO cDC1 (red) and control cDC1 (blue), and between CD11c.Bcl6KO cDC2 (orange) and control cDC2 (green).
Fig. 4
Fig. 4. Phenotype and cross-presentation abilities by cDC1 deficient in Bcl6.
A Flow cytometric analysis of classical dendritic cells (cDC)1 in the spleen of control and XCR1.Bcl6KO mice. Representative histograms show indicated protein expression by control (black) and XCR1.Bcl6KO (red) cDC1, with fluorescent minus one (FMO) staining shown in gray, and control cDC2 is shown as a dashed line. Dot plots show FMO-subtracted mean fluorescent intensity (MFI) values. Pre-gating on cDC1 and cDC2 was performed as in 1A. Histograms are representative of 3 independent experiments with 3 mice each MFI plots show 2 out of 3 experiments, and lines represent means ± SD. Statistical analysis using the Mann–Whitney test, exact P values are annotated. B Representative flow cytometry plots showing cell tracer violet (CTV) dilution and CD44 expression on OT-I cells (gated on live, CD3+CD8+CD45.1+ single cells) in the spleen (top) and mesenteric lymph nodes (mLN, bottom) of control and XCR1.Bcl6KO recipient mice 3 days after i.p. immunization with heat-shocked ovalbumin-expressing mouse embryonic fibroblasts (OVA-MEF). Data are representative of 3 independent experiments with 2–5 mice each. C Total number of OT-I cells in the spleen (right) and mLN (left) of immunized control and XCR1.Bcl6KO mice. Data are pooled from 3 independent experiments with 1–4 mice each. Data points represent values from individual mice mouse, and lines represent means ± SD. Statistical analysis using the Mann–Whitney test, exact P values are annotated. Circles: females; triangles: males; squares: sex-information missing.
Fig. 5
Fig. 5. Differentially expressed genes in Bcl6-deficient splenic cDC1.
A Gene ontology (GO) term enrichment analysis of differentially expressed genes (DEG) in XCR1.Bcl6KO and control cDC1 (PRJNA834905). The p value calculated from GO term enrichment analysis is represented on the x-axis, and the y-axis shows the GO Biological Process (BP) terms. P-values were calculated by using enrichGO function from R package clusterProfiler with the one-sided hypergeometric test. B KEGG (Kyoto Encyclopedia of Genes and Genomes) term enrichment analysis of DEGs in XCR1.Bcl6KO vs control cDC1. The GeneRatio value calculated from KEGG term enrichment analysis is represented on the x-axis, and the y-axis shows the KEGG enriched terms. C Heatmap of all genes contributing to the enriched KEGG pathways depicted in (B). The color scale represents the row Z score. D IL-6 levels in the serum of XCR1.Bcl6KO vs control mice injected intraperitoneally with poly(I:C) 2 h before analysis. Data are pooled from 6 experiments with 1–6 mice each (2 experiments without untreated controls), and lines represent means ± SD. Statistical analysis was performed by one-way ANOVA (and Tukey’s multiple comparison test), and exact P values were annotated. Circles: females; triangles: males; squares: sex-information missing.
Fig. 6
Fig. 6. Phenotype and gene expression profiles of splenic Bcl6-deficient cDC2.
A Representative flow cytometric analysis of classical dendritic cells (cDC)2 in the spleen of control and CD11c.Bcl6KO mice, showing expression of CD11c vs MHCII (top panels) and XCR1 vs CD11b (lower panels) by live, lineage (CD3, CD19, CD64, B220, NK1.1), CD11c+ single cell-gated splenocytes. Data are representative of at least 8 independent experiments with 1–3 mice each. Reported mean fluorescent intensity (MFI) levels of MHCII are raw values and average deviation from 3 experiments with 3 mice each. B Representative flow cytometric analysis of ESAMhi and ESAMlo cDC2 in the spleen of control and CD11c.Bcl6KO mice. Cells were pre-gated as XCR1CD11b+ cDC2 from live, lineage (CD3, CD19, CD64, B220, NK1.1), CD11c+, MHCII+ single cells. Data are representative of 3 independent experiments with 1–3 mice each. C Representative flow cytometric analysis of cDC2 in the spleen of control and Clec9a.Bcl6KO mice, showing expression of CD11c vs MHCII (top panels) and XCR1 vs CD11b (lower panels, gated on CD11c+, MHCII+) by live, lineage (CD3, CD19, CD64, B220, NK1.1) single cell-gated splenocytes. Data are representative of 2 independent experiments with 3 mice each. D Representative flow cytometric analysis of ESAMhi and ESAMlo cDC2 in the spleen of control and Clec9a.Bcl6KO mice. Cells were pre-gated as XCR1CD11b+ cDC2 from live, lineage (CD3, CD19, CD64, B220, NK1.1), CD11c+, MHCII+ single cells (top). Data are representative of 2 independent experiments with 3 mice each, and lines represent means ± SD. E Same data as in D, but pre-gated on YFP+ instead of CD11c+ (see Suppl. Fig. 4 for full gating strategy). Data are representative of 2 independent experiments with 3 mice each, and lines represent means ± SD. F Representative flow cytometric analysis of expression of CD11c, 33D1, CD4, CD11b, and IRF4 by splenic XCR1CD11b+ cDC2 from control (ESAMhi: black, ESAMlo: blue) or CD11c.Bcl6KO mice (orange). FMO controls are depicted in gray. Gates correspond to those depicted in Fig. 6B. Results are representative of at least 2 (CD11c) or 3 (all others) independent experiments with 3 mice each, and lines represent means ± SD. Statistical analysis was performed by one-way ANOVA. *P < 0.05, **P < 0.01, ***P < 0.001 and ****P < 0.0001. Circles: females; triangles: males.
Fig. 7
Fig. 7. Gene signature comparisons between ESAMhi and ESAMlo cDC2 with Bcl6-deficient cDC2.
A Gene set enrichment plots following CD11c.Bcl6KO vs control classical dendritic cells (cDC)2 in an ESAMhi cDC2 related gene set (top) vs an ESAMlo cDC2 related gene set (bottom) (ESAMhi and ESAMlo gene set derived from GSE76132). NES normalized enrichment score. False discovery rate (FDR) q-value: 0.0. B The top 50 genes associated with spleen ESAMhi cDC2 (left) or ESAMlo cDC2 (right) were derived from GSE76132. Heatmaps show the expression of these genes in the RNA-Seq analysis of cDC2 from control and CD11c.Bcl6KO spleen. The color scale represents the row Z score (Expression Z-scale).
Fig. 8
Fig. 8. Impact of Bcl6 deficiency in splenic cDC on Tfh cell and antibody responses.
A Confocal microscopy of spleens from CD11c.Bcl6KO and control mice. TLR3 (gray), CD11c (green), Sirpα (red), B220 (blue). Scale bar = 50 µm. Arrows indicate marginal zone bridging channels. Images are representative of 4 (CD11c.Bcl6KO), or 3 (control) replicates from individual mice. B Confocal microscopy of spleens from Clec9a.Bcl6WT and Clec9a.Bcl6KO mice, each carrying homozygous Rosa26fl-Stop-fl-YFP alleles. TLR3 (gray), YFP (green), CD11c (red), B220 (blue). Scale bar = 50 µm. Single channel figures show areas in the yellow boxes. Images are representative of 4 replicates from individual mice. C Experimental design. D Representative flow cytometry of splenic OT-II (CD45.1/2) cells from Clec9a.Bcl6WT and Clec9a.Bcl6KO recipients 7 days after i.p. immunization with NP-OVA. Tfh cells were gated as CXCR5+PD-1+ live CD4+CD19 lymphocytes. Statistical analysis was performed by two-way Mann–Whitney, exact P values are annotated. Each symbol represents one biological replicate (n = 4–5), and lines represent means ± SD. Data are representative of 2 independent experiments. E Experimental design. F Total cellularity and number of CD4+Foxp3 and CD4+Foxp3+ cells in Clec9a.Bcl6KO and control mice 14 days after i.p. injection with NP-KLH and alum. Data are pooled from 2 independent experiments with 4-5 mice per group, and lines represent means ± SD. G Representative flow cytometry of Foxp3 (left) and Foxp3+ (right) CD4+ T cell-gated splenocytes 14 days post-NP-KLH/alum i.p. immunization of Clec9a.Bcl6KO and control mice. Foxp3: T follicular helper cells (Tfh) are gated as CXCR5intPD-1int, and germinal center Tfh are gated as CXCR5hiPD-1hi. Foxp3+: T follicular regulatory cells are gated as CXCR5hiPD-1hi. H Quantification of data shown in (G). Statistical analysis was performed by the Mann–Whitney test and exact P values were annotated. Data are pooled from two independent experiments with 4–5 mice per group, and lines represent means ± SD. I Experimental design. J NP-specific total IgG in the serum from NP-KLH and alum immunized Clec9a.Bcl6KO and control mice at indicated time-points as determined by ELISA for low (NP36)- and high (NP2)-affinity antibodies. Data are representative of two independent experiments with 4–5 mice, and lines represent means ± SED. Two-way ANOVA with Bonferroni post-hoc, exact P values are annotated. Circles: females; triangles: males.
Fig. 9
Fig. 9. Citrobacter rodentium infection in mice with Bcl6 deletion in cDC.
A Left: Flow cytometry plots showing cLP XCR1+ and XCR1CD11b+ DC subsets gated on all dendritic cells (DC) (live, CD45+, lineage (CD3, CD19, CD64, B220, NK1.1), MHCII+, CD11chi single cells. Right: XCR1 DC is further subdivided into CD103+ and CD103 classical DC2 (cDC2) from control and CD11c.Bcl6KO mice. B Absolute numbers (top) and proportions (bottom) of colon lamina propria XCR1+, XCR1CD103+CD11b+, and XCR1CD103CD11b+ DC subsets from control and CD11c.Bcl6KO mice. Data points represent values from individual mice pooled from 3 experiments with 2–3 mice each, and lines represent means ± SD. Statistical analysis using the Mann–Whitney test, exact P values are annotated. C Percentage of weight loss of mock and C. rodentium infected control and CD11c.Bcl6KO mice. Each symbol represents the mean weight loss of all mice within the group at the indicated time point post-infection versus their starting weight, and error bars represent SD; statistical analysis using two-way ANOVA (and Tukey’s multiple comparison test) with Geisser–Greenhouse correction, *P < 0.05 and **P < 0.01 (top left). Colon lengths in mock and infected mice at 9 or 21 days post inoculation; statistical analysis by one-way ANOVA (and Tukey’s multiple comparison test), exact P values are annotated (bottom left). C. rodentium titers in feces were measured as colony-forming units (CFU) of infected control and CD11c.Bcl6KO mice at indicated days post-infection; statistical analysis using Mann–Whitney test, not significant (ns, right). All data points represent values from individual mice, lines represent means ± SD, and data is pooled from 2 to 3 experiments with 3–5 mice per mock/C. rodentium-infected group. D H&E-stained sections of the distal colon of mock and C. rodentium infected control and CD11c.Bcl6KO mice 21 days post-inoculation. Scale bar, 100 µm. Symbols: # epithelial lining; ¤ leukocyte infiltration; % goblet cell destruction; & villus length. Representative of 4–5 mice per group from one experiment.
Fig. 10
Fig. 10. T cell responses to Citrobacter rodentium infection in mice with Bcl6 deletion in cDC.
A Numbers of total CD4+ T cells, IL-17A+IL-22, IL-17A+IL-22+, IL-17A+IFNγ+, IFNγ+IL-17 and Foxp3+ CD4+ T cells in the cLP of mock and C. rodentium infected control and CD11c.Bcl6KO mice at day 9 post-inoculation. Data points represent values from individual mice pooled from 2 to 4 experiments with 2–4 mice per group, and lines represent means  ± SD. Statistical analysis is performed by one-way ANOVA, and exact P values are annotated. B Numbers of total CD4+ T cells, IL-17A+IL-22, IL-17A+IL-22+, IL-17A+IFNγ, IFNγ+IL-17 and Foxp3+ T cells in the cLP of mock and C. rodentium infected control and CD11c.Bcl6KO mice at day 21 post-inoculation. Data points represent values from individual mice pooled from 2 experiments with 4–5 mice per group, and lines represent means ± SD. Statistical analysis is performed by one-way ANOVA, and exact P values are annotated. Circles: females; triangles: males.

References

    1. Guilliams M, et al. Dendritic cells, monocytes and macrophages: a unified nomenclature based on ontogeny. Nat. Rev. Immunol. 2014;14:571–578. doi: 10.1038/nri3712. - DOI - PMC - PubMed
    1. Steinman RM. The dendritic cell system. Annu. Rev. Immunol. 1991;9:271–296. doi: 10.1146/annurev.iy.09.040191.001415. - DOI - PubMed
    1. Durai V, Murphy KM. Functions of murine dendritic cells. Immunity. 2016;45:719–736. doi: 10.1016/j.immuni.2016.10.010. - DOI - PMC - PubMed
    1. Allenspach EJ, Lemos MP, Porrett PM, Turka LA, Laufer TM. Migratory and lymphoid-resident dendritic cells cooperate to efficiently prime naive CD4 T cells. Immunity. 2008;29:795–806. doi: 10.1016/j.immuni.2008.08.013. - DOI - PMC - PubMed
    1. Lewis SM, Williams A, Eisenbarth SC. Structure and function of the immune system in the spleen. Sci. Immunol. 2019;4:eaau6085. doi: 10.1126/sciimmunol.aau6085. - DOI - PMC - PubMed

Publication types

MeSH terms

Substances