. 2024 Apr 30;7(1):515.
doi: 10.1038/s42003-024-06196-4.

Cold-shock proteome of myoblasts reveals role of RBM3 in promotion of mitochondrial metabolism and myoblast differentiation

Affiliations

Cold-shock proteome of myoblasts reveals role of RBM3 in promotion of mitochondrial metabolism and myoblast differentiation

Paulami Dey et al. Commun Biol. .

Abstract

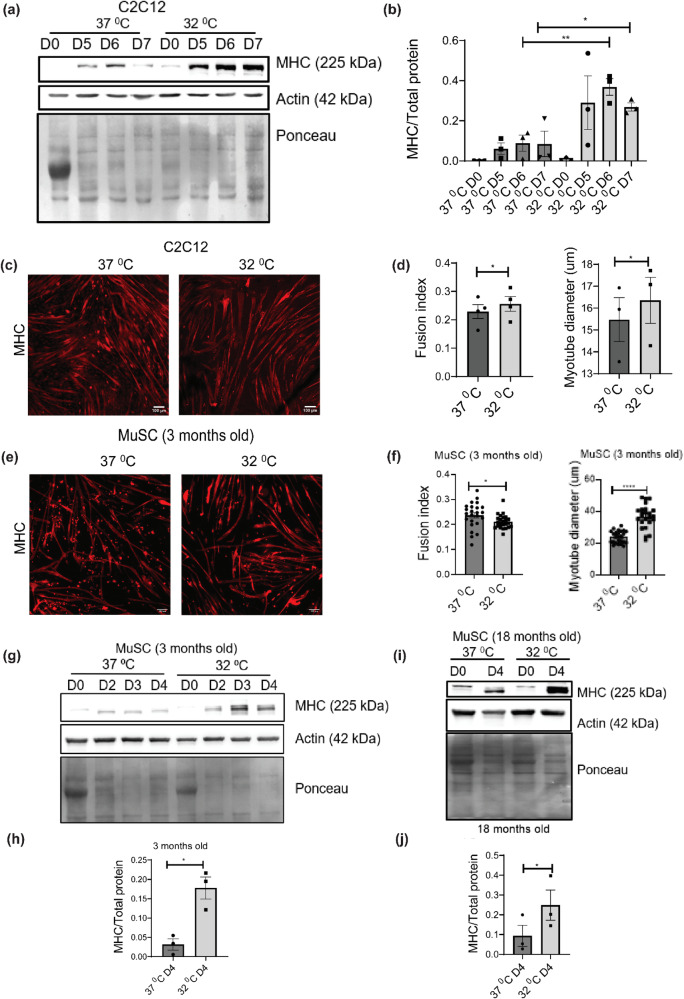
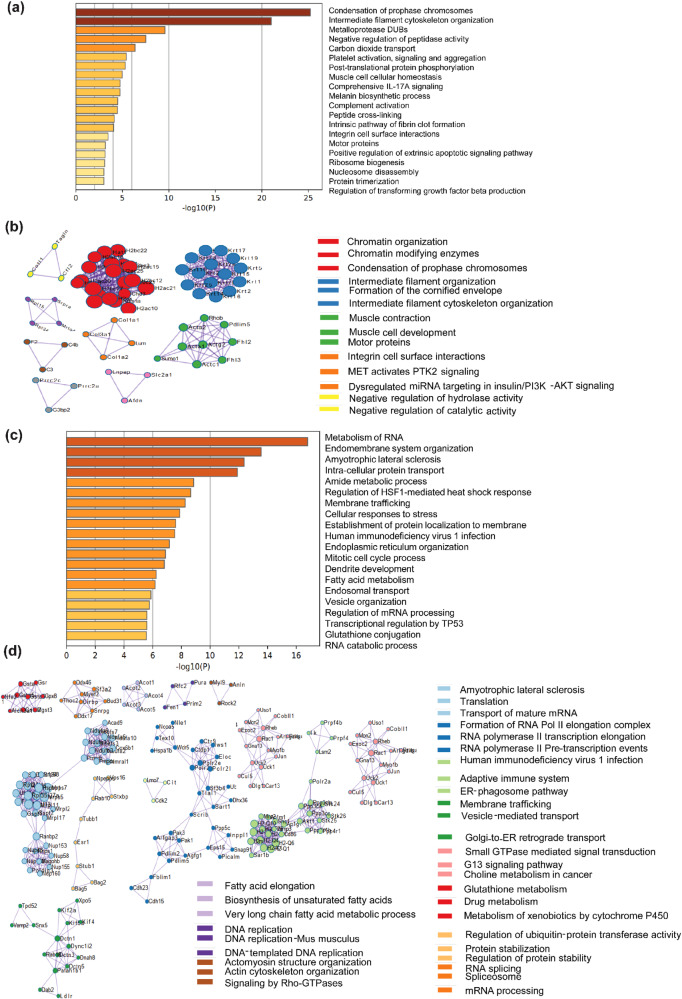
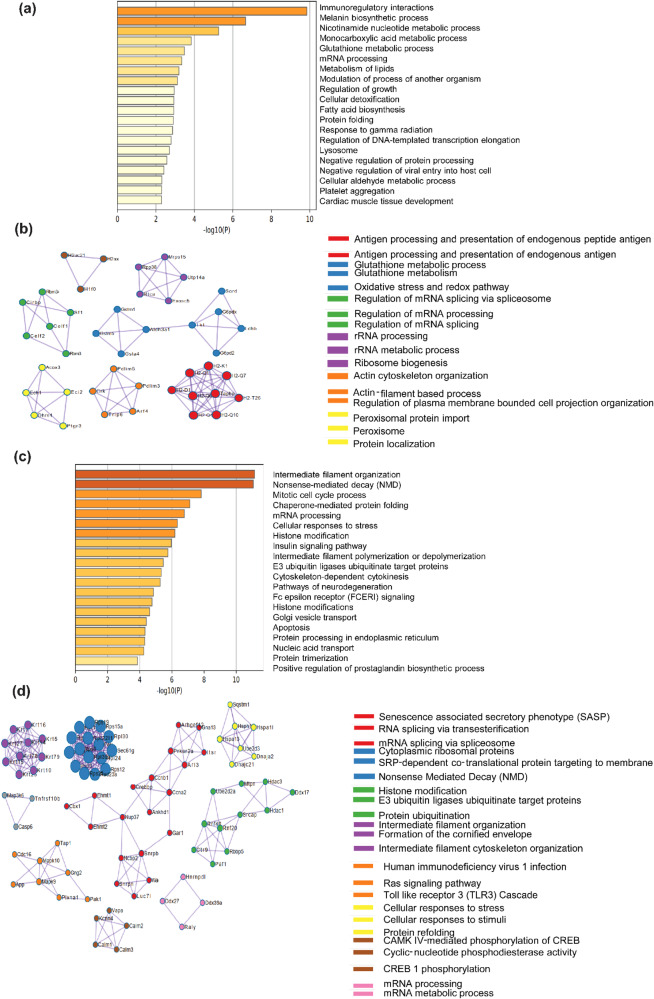
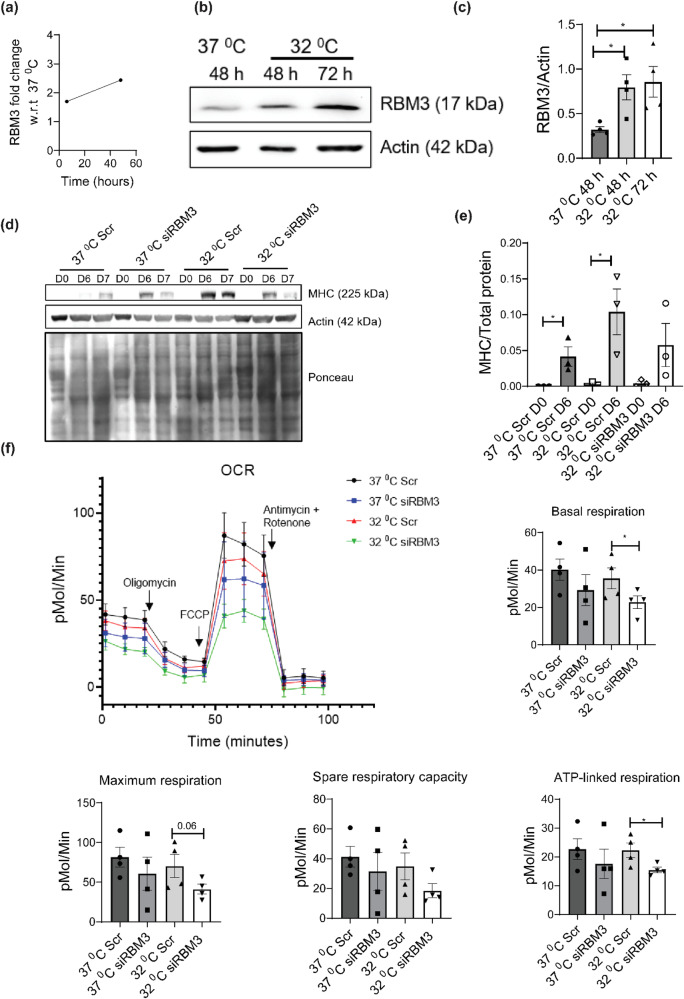
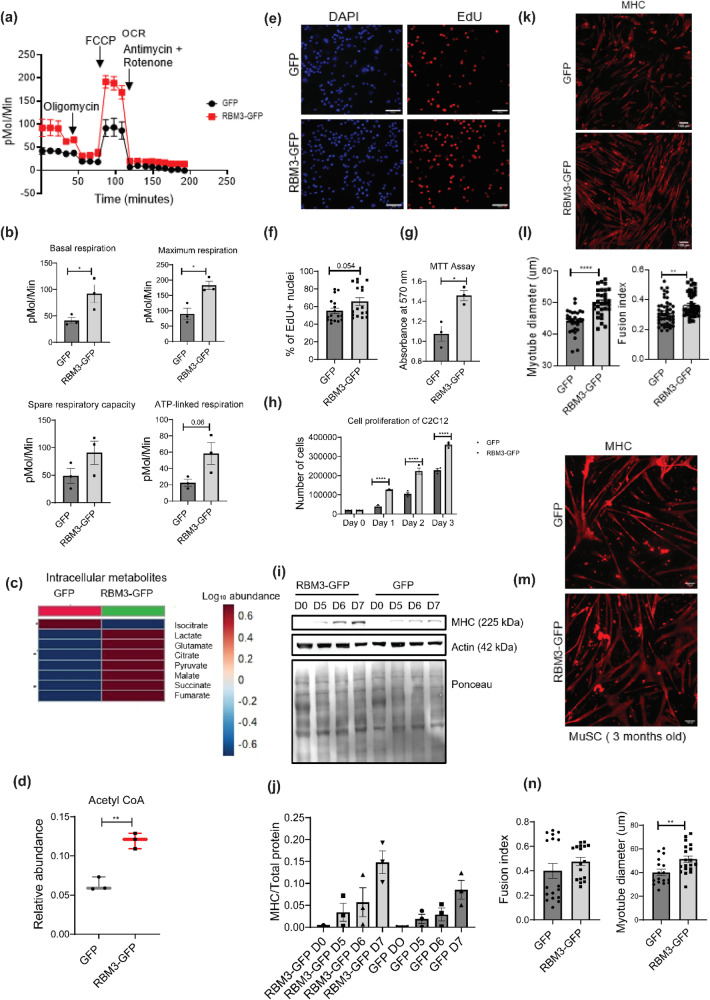
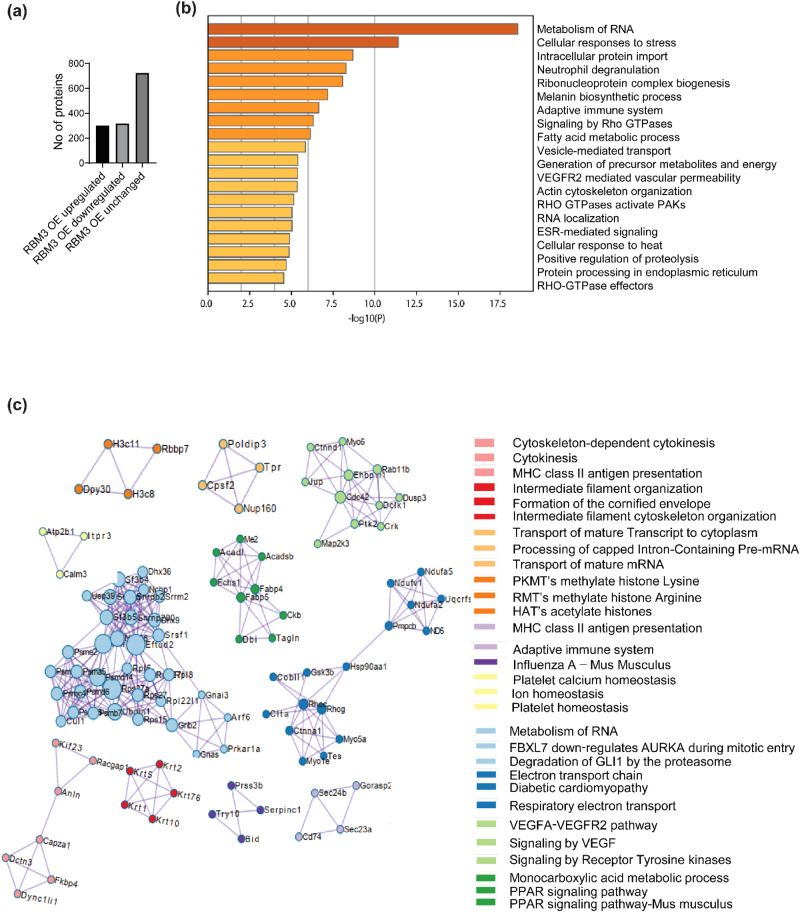
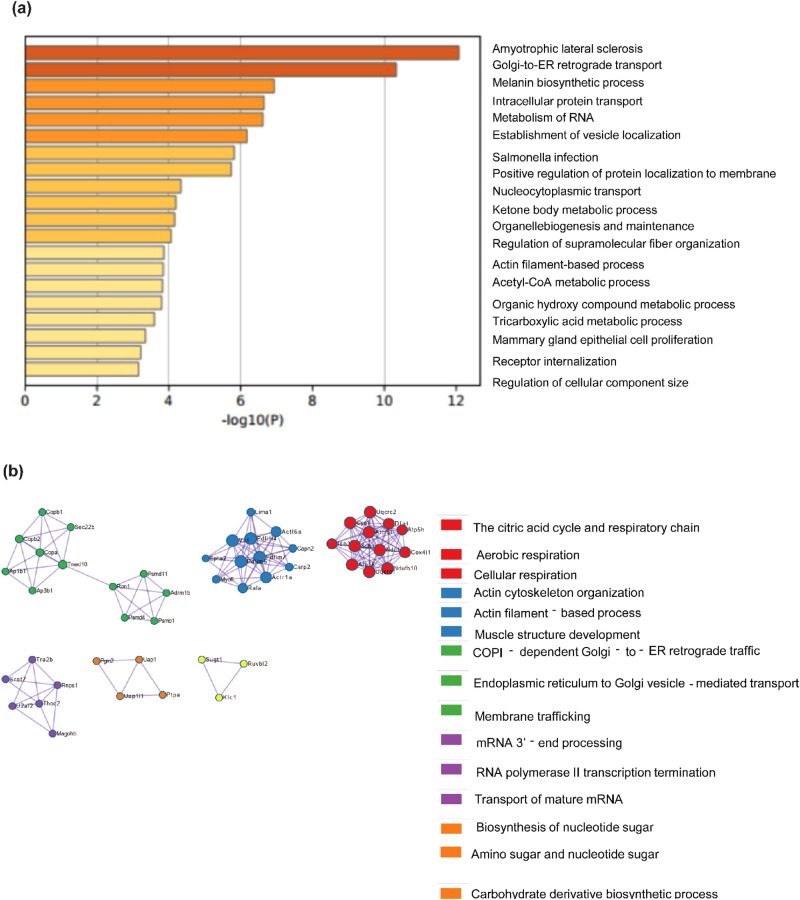
Adaptation to hypothermia is important for skeletal muscle cells under physiological stress and is used for therapeutic hypothermia (mild hypothermia at 32 °C). We show that hypothermic preconditioning at 32 °C for 72 hours improves the differentiation of skeletal muscle myoblasts using both C2C12 and primary myoblasts isolated from 3 month and 18-month-old mice. We analyzed the cold-shock proteome of myoblasts exposed to hypothermia (32 °C for 6 and 48 h) and identified significant changes in pathways related to RNA processing and central carbon, fatty acid, and redox metabolism. The analysis revealed that levels of the cold-shock protein RBM3, an RNA-binding protein, increases with both acute and chronic exposure to hypothermic stress, and is necessary for the enhanced differentiation and maintenance of mitochondrial metabolism. We also show that overexpression of RBM3 at 37 °C is sufficient to promote mitochondrial metabolism, cellular proliferation, and differentiation of C2C12 and primary myoblasts. Proteomic analysis of C2C12 myoblasts overexpressing RBM3 show significant enrichment of pathways involved in fatty acid metabolism, RNA metabolism and the electron transport chain. Overall, we show that the cold-shock protein RBM3 is a critical factor that can be used for controlling the metabolic network of myoblasts.


Conflict of interest statement

All authors declare no competing interests.

Figures

Fig. 1
Fig. 1. Hypothermic pre-conditioning of skeletal muscle myoblasts at 32 °C for 72 h followed by differentiation.
a Western blot of protein levels of myosin heavy chain (MHC) in C2C12 cells differentiated for 5, 6, and 7 days at 37  °C after hypothermic pre-conditioning (b) Bar graph quantifying the western blot in a, where y-axis represents the intensity of MHC normalized to total protein (n = 3). Significance tested by two-tailed student’s t test (unpaired). c C2C12 cells differentiated for 6 days at 37 °C after hypothermic preconditioning and immunostained with MHC antibody. d Bar graph showing the myotube fusion index (n = 4) and myotube diameter quantified from C2C12 myotubes shown in (c) (n = 3). Significance tested by two-tailed student’s t test (paired). e Primary myoblasts (from 3-month-old mice) differentiated for 4 days at 37  °C after hypothermic preconditioning and immunostained with MHC antibody. f Bar graph showing the myotube fusion index and myotube diameter quantified from (e) (24 individual data points taken from 3 separate experiments). Significance tested by two-tailed student’s t test (unpaired). g Western blot of protein levels of MHC using primary myoblasts (from 3-month-old mice) differentiated for 4 days at 37 °C after hypothermic pre-conditioning. h Bar graph quantifying the western blot in (g), where the y-axis represents the intensity of MHC normalized to total protein, (n = 3). Significance tested by two-tailed student’s t test (unpaired). i Western blot of protein levels of primary myoblasts (from 18-month-old mice) differentiated for 4 days at 37 °C after hypothermic preconditioning. j Bar graph quantifying the western blot in i where the y-axis represents the intensity of MHC normalized to total protein (n = 3). Significance tested by two-tailed student’s t test (paired). Error bar in the bar graphs represents standard error of mean (SEM). *, **, ***p < 0.05, 0.01 and 0.001.
Fig. 2
Fig. 2. Proteomic analysis of C2C12 myoblasts after 6 h of hypothermia at 32 °C.
a GO enrichment pathway analysis of upregulated proteins at 32  °C. b GO enrichment analysis of protein-protein interaction networks of upregulated proteins at 32 °C (n = 3). c GO enrichment pathway analysis of downregulated proteins at 32  °C. d GO enrichment analysis of protein-protein interaction networks of downregulated proteins at 32 °C (n = 3).
Fig. 3
Fig. 3. Proteomic analysis of C2C12 myoblasts after 48 h of hypothermia at 32 °C.
a GO enrichment pathway analysis of upregulated proteins at 32  °C. b GO enrichment analysis of protein-protein interaction networks of upregulated proteins at 32 °C (n = 3). c GO enrichment pathway analysis of downregulated proteins at 32 °C. d GO enrichment analysis of protein-protein interaction networks of downregulated at 32 °C (n = 3).
Fig. 4
Fig. 4. Hypothermic pre-conditioning of C2C12 myoblasts at 32 °C for 72 h followed by differentiation and respirometric analysis, with or without knockdown of RBM3.
a Line graph showing the fold change of protein levels of RBM3 upon hypothermic treatment at 32 °C with respect to 37 °C at different time points (6 h and 48 h). b Western blot of protein levels of RBM3 using C2C12 cells cultured at 37  °C and 32  °C for 48 h and 72 h respectively. c Bar graph quantifying the western blot image in b, where the y-axis represents the intensity of RBM3 normalized to Actin (n = 4). Significance tested by two-tailed student’s t test (unpaired). d Western blot of protein levels of MHC using C2C12 cells transfected with scrambled (Scr) or siRBM3 and differentiated for 6 days at 37  °C after hypothermic pre-conditioning. e Bar graph quantifying the western blot image in d, where y-axis represents the intensity of MHC normalized to total protein, (n = 3). Significance tested by two-tailed student’s t-test (unpaired). f Line graph showing the mitochondrial oxygen consumption rate (OCR) of C2C12 cells transfected with Scr or siRBM3 and incubated at 37 °C and 32 °C (72 h) respectively. X-axis represents time in minutes and the y-axis represents oxygen consumption rate in pMol/min. Bar graph quantifying the basal respiration, maximum respiration, spare respiratory capacity and ATP-linked respiration of the cells (n = 4). Error bar in the bar graphs represent standard error of mean (SEM). Significance tested by two-tailed student’s t test (unpaired). *, **, *** p < 0.05, 0.01 and 0.001.
Fig. 5
Fig. 5. Analysis of metabolism, proliferation and differentiation of skeletal muscle myoblasts overexpressing RBM3 at 37 °C.
a Line graph showing the mitochondrial OCR of C2C12 cells overexpressing RBM3-GFP and GFP (control) and respectively. X-axis represents time in minutes and the y-axis represents oxygen consumption rate in pMol/min. b Bar graph quantifying the basal respiration, maximum respiration, spare respiratory capacity and ATP-linked respiration of C2C12 cells overexpressing RBM3-GFP and GFP respectively. Y-axis represents oxygen consumption rate in pMol/Min (n = 3). Significance tested by two-tailed student’s t test (unpaired). c Heat map showing the intracellular levels of TCA metabolites in C2C12 cells overexpressing RBM3-GFP and GFP respectively (n = 3). d Box plot showing the intracellular levels of acetyl-CoA in C2C12 cells overexpressing RBM3-GFP and GFP respectively (n = 3). e EdU staining of C2C12 cells overexpressing RBM3-GFP and GFP respectively. Red color indicates EdU stained nucleus and blue color indicates DAPI staining. f Bar graph representing the quantitation of EdU staining where the y-axis represents the % of EdU positive nucleus (17 data points taken from 2 individual experiments). g Bar graph quantifying the % viability of C2C12 cells overexpressing RBM3-GFP and GFP respectively at 37 °C (n = 3). h Bar graph indicating cell proliferation of C2C12 cells overexpressing RBM3-GFP and GFP respectively at 37 °C where the y-axis represents the total number of cells, and the x-axis represents time in days (n = 3). Significance tested by two-tailed student’s t test (paired). i Western blot showing protein levels of MHC after 5, 6 and 7 days of differentiation using C2C12 myoblasts overexpressing RBM3-GFP and GFP respectively. j Bar graph quantifying the western blot in (i), where the y-axis represents the intensity of MHC normalized to the total protein (n = 3). k C2C12 myoblasts overexpressing RBM3-GFP and GFP respectively, differentiated for 6 days and immunostained with MHC antibody. l Bar graph quantifying the myotube fusion index (48 individual data points from 3 individual experiments) and myotube diameter of cells shown in (k) (28 individual data points from 2 individual experiments). m Primary myoblasts (from 3-month-old mice) overexpressing RBM3-GFP and GFP respectively, differentiated for 4 days and immunostained with MHC antibody. n Bar graph showing the myotube fusion index and myotube diameter quantified from the images shown in m (17 individual data points from 2 individual experiments). Error bar in the bar graphs represent standard error of mean (SEM). Significance tested by two-tailed student’s t test (unpaired). *, **, *** p < 0.05, 0.01, and 0.001 respectively.
Fig. 6
Fig. 6. Proteomic analysis of C2C12 myoblasts overexpressing RBM3 at 37°C.
a Bar graph showing the number of upregulated, downregulated and unchanged proteins in C2C12 myoblasts overexpressing RBM3. b GO enrichment pathway analysis of upregulated proteins (n = 3). c GO enrichment analysis of protein-protein interaction networks of upregulated proteins (n = 3).
Fig. 7
Fig. 7. Proteomic analysis of C2C12 myoblasts overexpressing RBM3 at 37°C.
a GO enrichment pathway analysis of downregulated proteins (n = 3). b GO enrichment analysis of protein-protein interaction networks of downregulated proteins (n = 3).

References

    1. Andresen M, Gazmuri JT, Marín A, Regueira T, Rovegno M. Therapeutic hypothermia for acute brain injuries. Scand. J. Trauma Resusc. Emerg. Med. 2015;23:42. doi: 10.1186/s13049-015-0121-3. - DOI - PMC - PubMed
    1. Kochanek, P. M. The brain, the heart, and therapeutic hypothermia. Cleve. Clin. J. Med.76, S8–12 (2009). - PubMed
    1. Gocoł R, et al. The role of deep hypothermia in cardiac surgery. Int. J. Environ. Res. Public Health. 2021;18:7061. doi: 10.3390/ijerph18137061. - DOI - PMC - PubMed
    1. Matsuzaki M, et al. Impact of induced therapeutic hypothermia by intravenous infusion of ice-cold fluids after hospital arrival in comatose survivors of out-of-hospital cardiac arrest with initial shockable rhythm. Circ. J. 2021;85:1842–1848. doi: 10.1253/circj.CJ-20-0793. - DOI - PubMed
    1. Park Y, et al. Therapeutic hypothermia reduces inflammation and oxidative stress in the liver after asphyxial cardiac arrest in rats. Acute Crit. Care. 2020;35:286–295. doi: 10.4266/acc.2020.00304. - DOI - PMC - PubMed

Publication types

LinkOut - more resources