. 2024 May;56(5):778-791.
doi: 10.1038/s41588-024-01714-w. Epub 2024 Apr 30.

Genome-wide analysis in over 1 million individuals of European ancestry yields improved polygenic risk scores for blood pressure traits

Jacob M Keaton #  1   2 Zoha Kamali #  3   4 Tian Xie #  3 Ahmad Vaez  5   6 Ariel Williams  1 Slavina B Goleva  1 Alireza Ani  3   4 Evangelos Evangelou  7   8   9 Jacklyn N Hellwege  10   11   12 Loic Yengo  13 William J Young  14   15 Matthew Traylor  14   16 Ayush Giri  2   17 Zhili Zheng  13   18 Jian Zeng  13 Daniel I Chasman  19   20 Andrew P Morris  21 Mark J Caulfield  14   22 Shih-Jen Hwang  23   24 Jaspal S Kooner  25 David Conen  26 John R Attia  27 Alanna C Morrison  28 Ruth J F Loos  29   30   31 Kati Kristiansson  32 Reinhold Schmidt  33 Andrew A Hicks  34   35 Peter P Pramstaller  34   35 Christopher P Nelson  36   37 Nilesh J Samani  36   37 Lorenz Risch  38   39 Ulf Gyllensten  40 Olle Melander  41   42 Harriette Riese  43 James F Wilson  44   45 Harry Campbell  44 Stephen S Rich  46 Bruce M Psaty  47 Yingchang Lu  48 Jerome I Rotter  49 Xiuqing Guo  49 Kenneth M Rice  50 Peter Vollenweider  51 Johan Sundström  52   53 Claudia Langenberg  54   55   56 Martin D Tobin  57   58 Vilmantas Giedraitis  59 Jian'an Luan  54 Jaakko Tuomilehto  32   60   61 Zoltan Kutalik  62   63 Samuli Ripatti  64   65 Veikko Salomaa  32 Giorgia Girotto  66   67 Stella Trompet  68   69 J Wouter Jukema  69   70 Pim van der Harst  71   72 Paul M Ridker  19   20 Franco Giulianini  19 Veronique Vitart  45 Anuj Goel  73   74 Hugh Watkins  73   74 Sarah E Harris  75 Ian J Deary  75 Peter J van der Most  3 Albertine J Oldehinkel  76 Bernard D Keavney  77   78 Caroline Hayward  45   79 Archie Campbell  79   80 Michael Boehnke  81 Laura J Scott  81 Thibaud Boutin  45 Chrysovalanto Mamasoula  82 Marjo-Riitta Järvelin  83   84   85 Annette Peters  86   87 Christian Gieger  88 Edward G Lakatta  89 Francesco Cucca  90 Jennie Hui  91   92 Paul Knekt  93 Stefan Enroth  94 Martin H De Borst  95 Ozren Polašek  96   97 Maria Pina Concas  67 Eulalia Catamo  67 Massimiliano Cocca  67 Ruifang Li-Gao  98 Edith Hofer  99   100 Helena Schmidt  101 Beatrice Spedicati  66 Melanie Waldenberger  88   102 David P Strachan  103 Maris Laan  104 Alexander Teumer  105   106 Marcus Dörr  106   107 Vilmundur Gudnason  108   109 James P Cook  110 Daniela Ruggiero  111   112 Ivana Kolcic  97   113 Eric Boerwinkle  28   114 Michela Traglia  115 Terho Lehtimäki  116   117 Olli T Raitakari  118   119 Andrew D Johnson  23   120 Christopher Newton-Cheh  18   121 Morris J Brown  14 Anna F Dominiczak  122 Peter J Sever  123 Neil Poulter  124 John C Chambers  125 Roberto Elosua  126   127   128 David Siscovick  129 Tõnu Esko  130 Andres Metspalu  130 Rona J Strawbridge  131   132   133 Markku Laakso  134   135 Anders Hamsten  133 Jouke-Jan Hottenga  136 Eco de Geus  136   137 Andrew D Morris  138   139 Colin N A Palmer  140 Ilja M Nolte  3 Yuri Milaneschi  141 Jonathan Marten  79 Alan Wright  79 Eleftheria Zeggini  142   143 Joanna M M Howson  16   144 Christopher J O'Donnell  145 Tim Spector  146 Mike A Nalls  147   148   149 Eleanor M Simonsick  150 Yongmei Liu  151 Cornelia M van Duijn  152 Adam S Butterworth  144   153   154   155   156 John N Danesh  144   153   154   155   156   157 Cristina Menni  158 Nicholas J Wareham  54 Kay-Tee Khaw  159 Yan V Sun  160   161 Peter W F Wilson  162   163 Kelly Cho  164   165   166 Peter M Visscher  13 Joshua C Denny  1 Million Veteran ProgramLifelines Cohort StudyCHARGE consortiumICBP ConsortiumDaniel Levy  23   119 Todd L Edwards  167 Patricia B Munroe  14   22 Harold Snieder  3 Helen R Warren  168   169
Collaborators, Affiliations

Genome-wide analysis in over 1 million individuals of European ancestry yields improved polygenic risk scores for blood pressure traits

Jacob M Keaton et al. Nat Genet. 2024 May.

Abstract

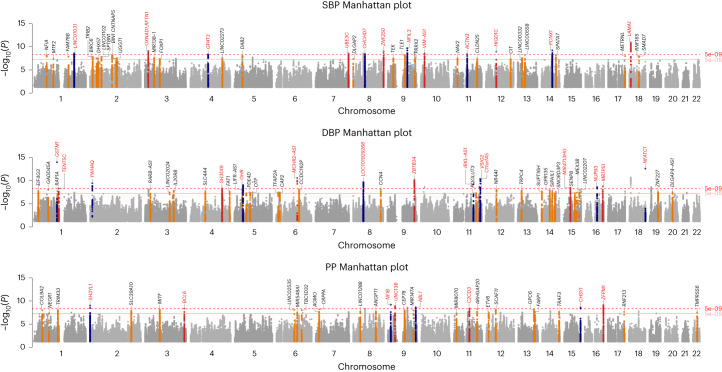
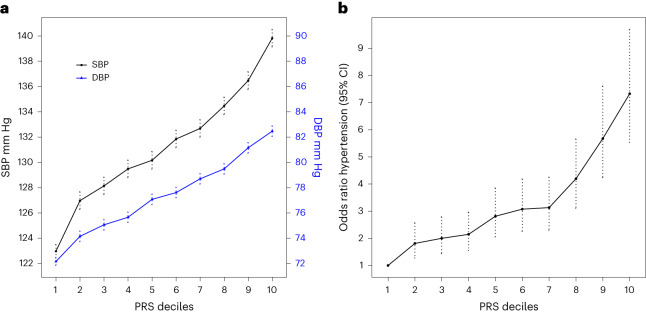
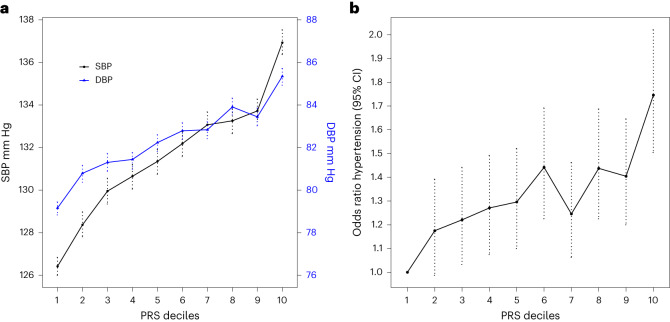
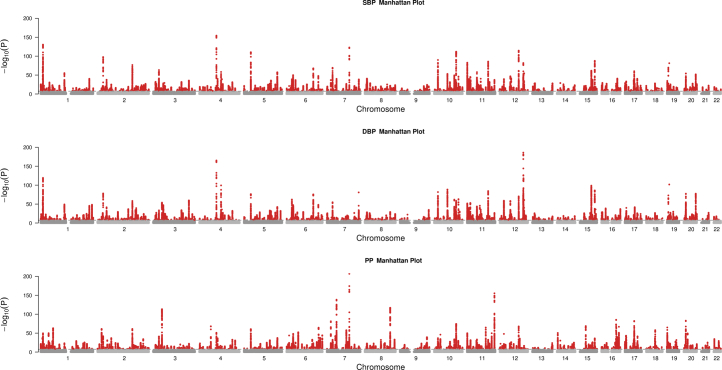
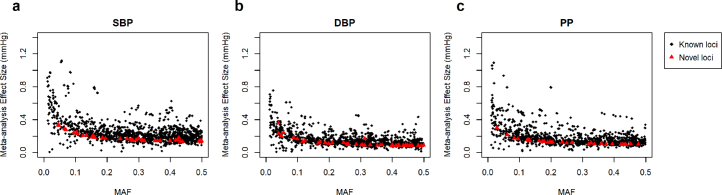
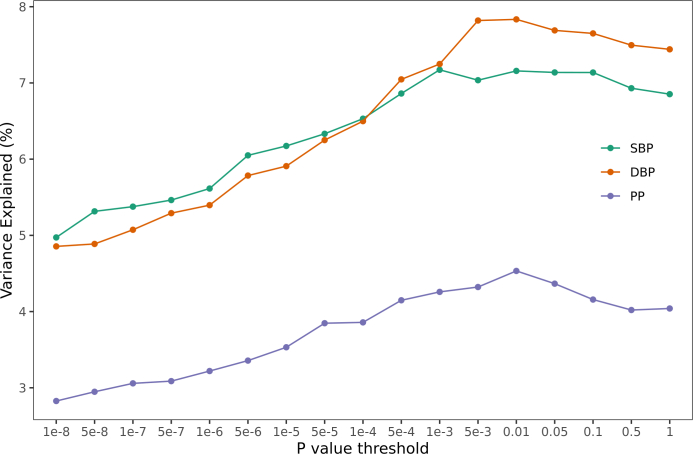
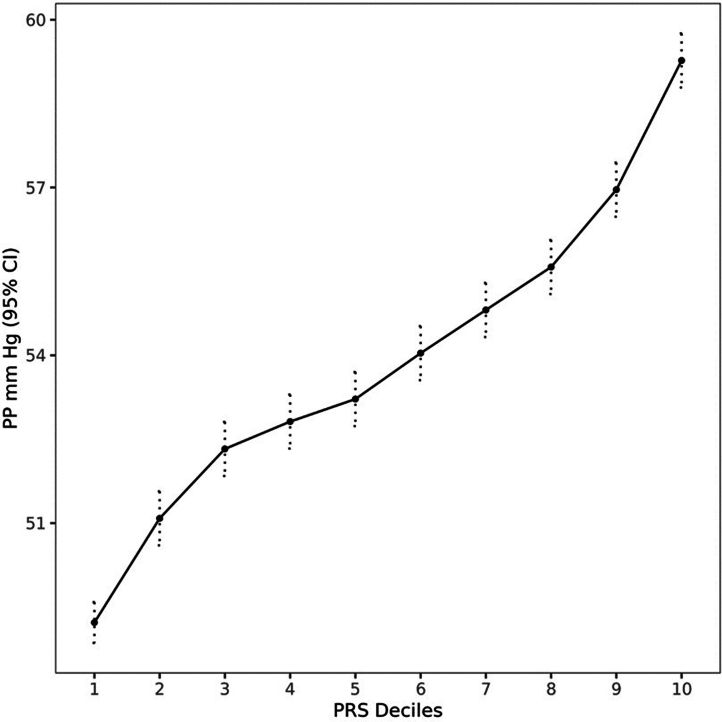
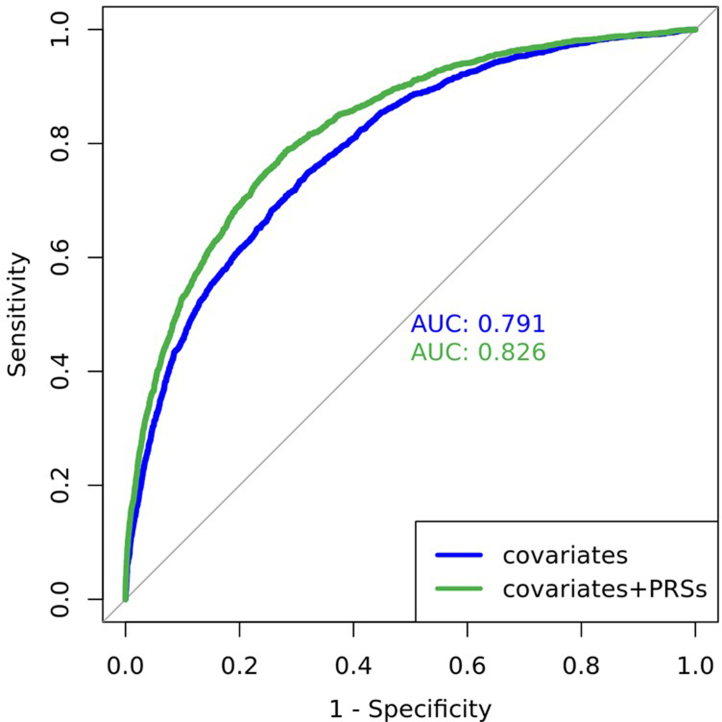
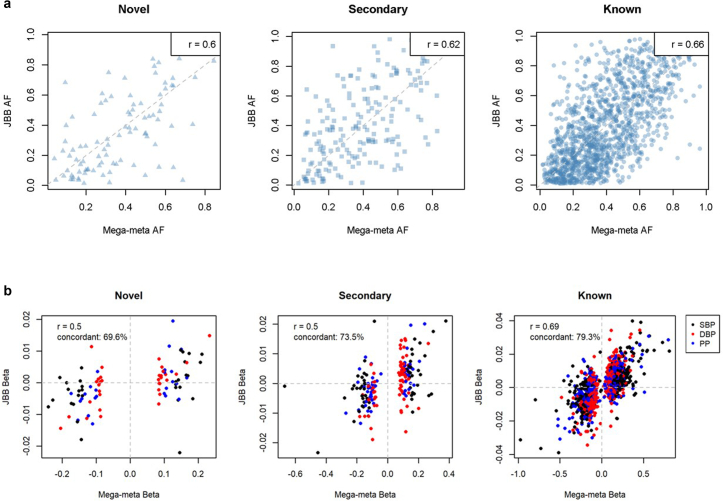
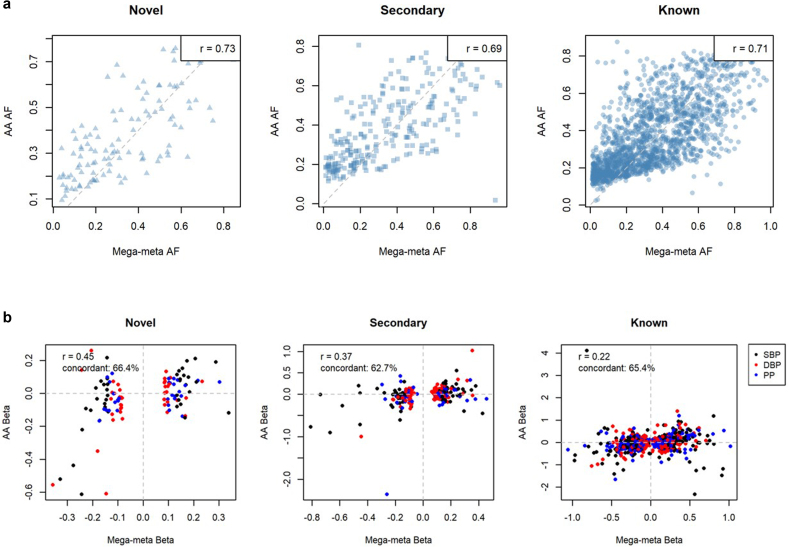
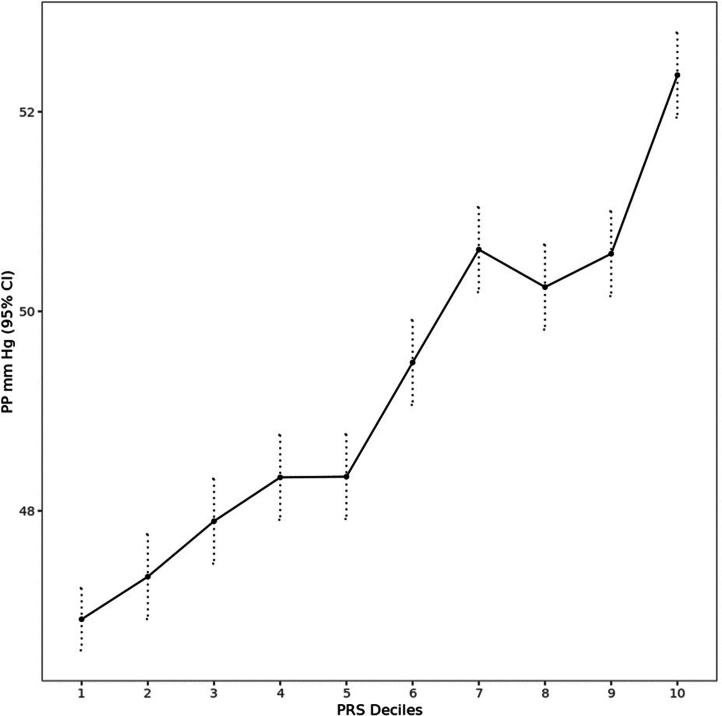
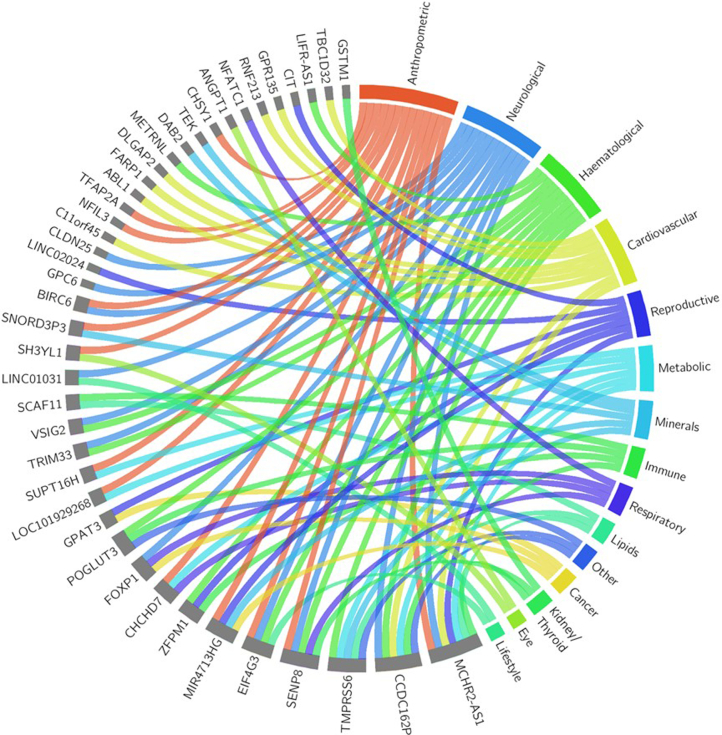
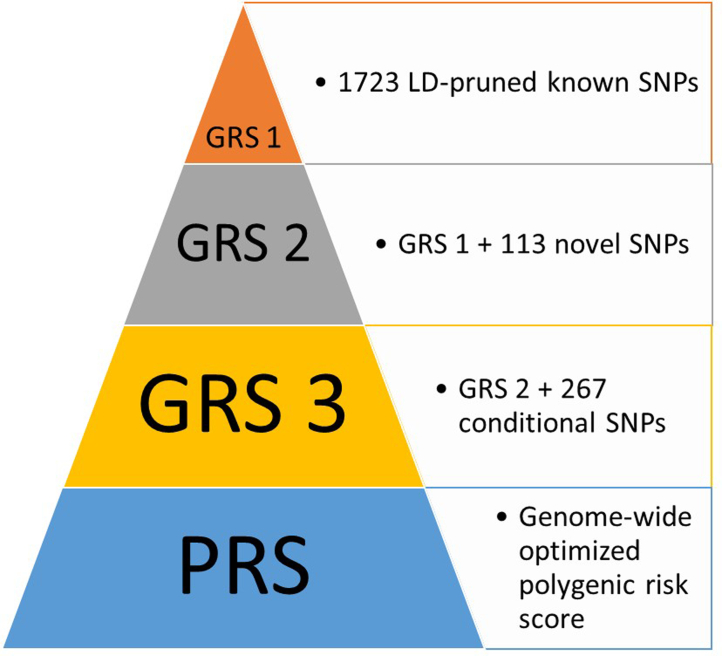
Hypertension affects more than one billion people worldwide. Here we identify 113 novel loci, reporting a total of 2,103 independent genetic signals (P < 5 × 10⁻⁸) from the largest single-stage blood pressure (BP) genome-wide association study to date (n = 1,028,980 European individuals). These associations explain more than 60% of single nucleotide polymorphism-based BP heritability. Comparing top versus bottom deciles of polygenic risk scores (PRSs) reveals clinically meaningful differences in BP (16.9 mmHg systolic BP, 95% CI, 15.5-18.2 mmHg, P = 2.22 × 10-126) and more than a sevenfold higher odds of hypertension risk (odds ratio, 7.33; 95% CI, 5.54-9.70; P = 4.13 × 10-44) in an independent dataset. Adding PRS into hypertension-prediction models increased the area under the receiver operating characteristic curve (AUROC) from 0.791 (95% CI, 0.781-0.801) to 0.826 (95% CI, 0.817-0.836, ∆AUROC, 0.035, P = 1.98 × 10⁻³⁴). We compare the 2,103 loci results in non-European ancestries and show significant PRS associations in a large African-American sample. Secondary analyses implicate 500 genes previously unreported for BP. Our study highlights the role of increasingly large genomic studies for precision health research.


Conflict of interest statement

The participation of M.A.N. in this project was part of a competitive contract awarded to Data Tecnica International by the National Institutes of Health to support open science research. He also currently serves on the scientific advisory board for Clover Therapeutics and is an advisor to Neuron23 as a data science fellow. B.M.P. serves on the steering committee of the Yale Open Data Access Project funded by Johnson & Johnson. P.V. received an unrestricted grant from GlaxoSmithKline to build the CoLaus study (2003). V.S. has received honoraria for consulting from Novo Nordisk and Sanofi and has ongoing research collaboration with Bayer (all unrelated to this project). R.L. is a part-time consultant of Metabolon. M.J.C. is Chief Scientist for Genomics England, a UK Government company. M. Traylor and J.M.M.H. are employees and stockholders of Novo Nordisk. C.J.O. is currently employed by Novartis Institutes for Biomedical Research (unrelated to this project) and remains credentialed as a ‘without compensation’ researcher with the Veterans Administration. T.S. is co-founder of Zoe Ltd. A.S.B. reports institutional grants from AstraZeneca, Bayer, Biogen, BioMarin, Bioverativ, Novartis, Regeneron and Sanofi. J.N.D. reports grants, personal fees and non-financial support from Merck Sharp & Dohme (MSD), grants, personal fees and non-financial support from Novartis, grants from Pfizer and grants from AstraZeneca outside the submitted work. J.N.D. sits on the International Cardiovascular and Metabolic Advisory Board for Novartis (since 2010); the Steering Committee of UK Biobank (since 2011); the MRC International Advisory Group (ING) member, London (since 2013); the MRC High Throughput Science Omics Panel Member, London (since 2013); the Scientific Advisory Committee for Sanofi (since 2013); the International Cardiovascular and Metabolism Research and Development Portfolio Committee for Novartis; and the AstraZeneca Genomics Advisory Board (2018). E.E was co-founder and has received consultation fees from Open DNA (unrelated to this project). The other authors declare no competing interests.

Figures

Fig. 1
Fig. 1. Manhattan plots of SBP, DBP and PP GWAS meta-analyses, illustrating 113 novel loci.
Manhattan plots from top to bottom show novel results of SBP, DBP and PP GWAS meta-analysis, respectively, using inverse variance-weighted method. All loci are reported at genome-wide significance threshold (5 × 10−8). Annotated in red are loci reaching the more stringent P value of 5 × 10−9.
Fig. 2
Fig. 2. Relationship of deciles of the SBayesRC PRSs with SBP and DBP and risk of hypertension in European ancestry individuals from Lifelines cohort (n = 10,210).
a,b, Plots show sex-adjusted SBP and DBP (a) and sex-adjusted odds ratios of hypertension (b) comparing each of the upper nine PRS deciles with the lowest decile. Dotted lines represent mean; error bars, s.e.m. in a and 95% CI in b.
Fig. 3
Fig. 3. Relationship of deciles of the SBayesRC PRSs with SBP and DBP and risk of hypertension in African-American ancestry individuals from All-Of-Us cohort (n = 21,843).
a,b, Plots show sex-adjusted mean SBP and DBP (a) and sex-adjusted odds ratios of hypertension (b) comparing each of the upper nine PRS deciles with the lowest decile. Dotted lines represent mean; error bars, s.e.m. in a and 95% CI in b.
Extended Data Fig. 1
Extended Data Fig. 1. Manhattan plots of meta-analysis full results.
Manhattan plots of meta-analysis full results using inverse variance-weighted method, showing 1,495, 1,504, and 1,318 significant loci for systolic (SBP, top plot), diastolic (DBP, middle plot), and pulse pressure (PP, bottom plot) in total (r2 < 0.05 and 1 Mb distance).
Extended Data Fig. 2
Extended Data Fig. 2. Comparison of the newly discovered loci with the known loci in effect size distribution.
Comparison of the newly discovered loci with the known loci in effect size distribution, plotting Minor Allele Frequency (MAF) on the x-axis, vs GWAS effect estimate size on the y-axis, from the meta-analysis for SBP (a), DBP (b), PP (c).
Extended Data Fig. 3
Extended Data Fig. 3. Variance explained by Polygenic Risk Scores (PRSs) at different P value thresholds.
Variance explained by clumping and threshold Polygenic Risk Scores (PRSs) at different P value thresholds of inverse variance- weighted meta-analysis results, for SBP, DBP and PP, in the independent Lifelines cohort data.
Extended Data Fig. 4
Extended Data Fig. 4. Relationship of deciles of the SBayesRC PRS with Pulse Pressure (PP) in Lifelines.
Relationship of deciles of the SBayesRC PRS with Pulse Pressure (PP) in Lifelines of European ancestry (n = 10,210). Plot shows sex-adjusted mean PP comparing each of the upper nine PRS deciles with the lowest decile. Dotted lines represent 95% confidence intervals.
Extended Data Fig. 5
Extended Data Fig. 5. Area under the ROC curve of the two models for Hypertension prediction in Lifelines.
Area under the ROC curve (AUROC) of the two models (covariates only and covariates plus SBayesRC PRS) for Hypertension prediction in Lifelines (n = 10,210) cohort of European ancestry.
Extended Data Fig. 6
Extended Data Fig. 6. Pairwise allele frequency and effect size comparisons of 2103 GRS SNPs between our Mega-meta results and Japan Biobank.
Pairwise allele frequency (a) and effect size (b) comparisons of 2103 GRS SNPs between our Mega-meta results and Japan Biobank (JBB) (n∼145k). Comparisons are separately made for the 113 novel SNPs (‘Novel’), 267 additional novel SNPs from conditional analysis (‘Secondary’), and 1723 known SNPs (‘Known’). Black, red and blue represent SNPs with SBP, DBP, and PP as the best associated traits, respectively. r = Pearson’s Correlation coefficient. ‘concordant’ means the proportion of SNPs showing directional concordance between European and Japanese populations. Please note that JBB effect sizes are standardized by Z-score transformation.
Extended Data Fig. 7
Extended Data Fig. 7. Pairwise allele frequency and effect size comparisons of 2103 GRS SNPs between our Mega-meta results and a meta-analysis of African-American ancestry individuals.
Pairwise allele frequency (a) and effect size (b) comparisons of 2103 GRS SNPs between our Mega-meta results and a meta-analysis of African-American ancestry individuals (N = 83,890). Comparisons are separately made for the 113 novel SNPs (‘Novel’), 267 additional novel SNPs from conditional analysis (‘Secondary’), and 1723 known SNPs (‘Known’). Black, red and blue represent SNPs with SBP, DBP, and PP as the best associated traits, respectively. r = Pearson’s Correlation coefficient. ‘concordant’ means the proportion of SNPs showing directional concordance between European and African-American populations.
Extended Data Fig. 8
Extended Data Fig. 8. PRS for PP in AA.
Relationship of deciles of the SBayesRC PRS with PP in African-American Ancestry individuals from All-Of-Us Cohort (n = 21,843). Plots show sex-adjusted mean PP comparing each of the upper nine PRS deciles with the lowest decile. Dotted lines represent 95% confidence intervals.
Extended Data Fig. 9
Extended Data Fig. 9. Cross-trait associations for 41 Blood Pressure novel loci with other diseases/traits.
Cross-trait associations for 41 of the 113 Blood Pressure novel loci with other disease/trait categories from lookups within GWAS Catalog and Phenoscanner. Segment size depends on the number of locus-trait category associations.
Extended Data Fig. 10
Extended Data Fig. 10. GRSs and PRS tested for percent variance explained in Lifelines cohort.
Two PRSs were calculated: 1) a standard ‘benchmark’ clumping and thresholding PRS, and; 2) an ‘optimized’ PRS based on SBayesRC. GRS = Genetic Risk Score; PRS = Polygenic Risk Score; SNP = Single Nucleotide Polymorphism.

Similar articles

Cited by

References

    1. Mills KT, et al. Global disparities of hypertension prevalence and control: a systematic analysis of population-based studies from 90 countries. Circulation. 2016;134:441–450. doi: 10.1161/CIRCULATIONAHA.115.018912. - DOI - PMC - PubMed
    1. GBD 2017 Causes of Death Collaborators. Global, regional, and national age-sex-specific mortality for 282 causes of death in 195 countries and territories, 1980–2017: a systematic analysis for the Global Burden of Disease Study 2017. Lancet. 2018;392:1736–1788. doi: 10.1016/S0140-6736(18)32203-7. - DOI - PMC - PubMed
    1. GBD 2017 Risk Factor Collaborators. Global, regional, and national comparative risk assessment of 84 behavioural, environmental and occupational, and metabolic risks or clusters of risks for 195 countries and territories, 1990–2017: a systematic analysis for the Global Burden of Disease Study 2017. Lancet. 2018;392:1923–1994. doi: 10.1016/S0140-6736(18)32225-6. - DOI - PMC - PubMed
    1. Giri A, et al. Trans-ethnic association study of blood pressure determinants in over 750,000 individuals. Nat. Genet. 2019;51:51–62. doi: 10.1038/s41588-018-0303-9. - DOI - PMC - PubMed
    1. Evangelou E, et al. Genetic analysis of over 1 million people identifies 535 new loci associated with blood pressure traits. Nat. Genet. 2018;50:1412–1425. doi: 10.1038/s41588-018-0205-x. - DOI - PMC - PubMed