. 2024 Jun;26(6):859-867.
doi: 10.1038/s41556-024-01413-y. Epub 2024 Apr 30.

Oncogenic Kras induces spatiotemporally specific tissue deformation through converting pulsatile into sustained ERK activation

Affiliations

Oncogenic Kras induces spatiotemporally specific tissue deformation through converting pulsatile into sustained ERK activation

Tianchi Xin et al. Nat Cell Biol. 2024 Jun.

Abstract

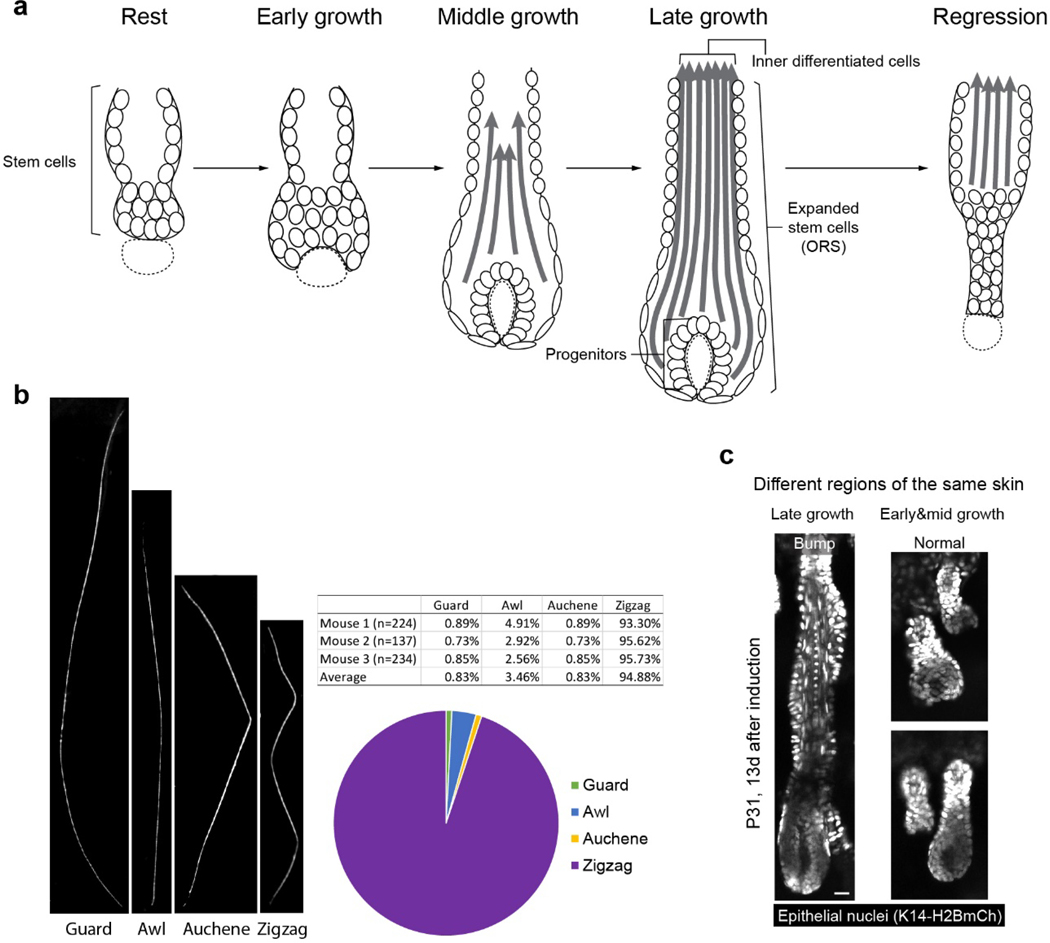
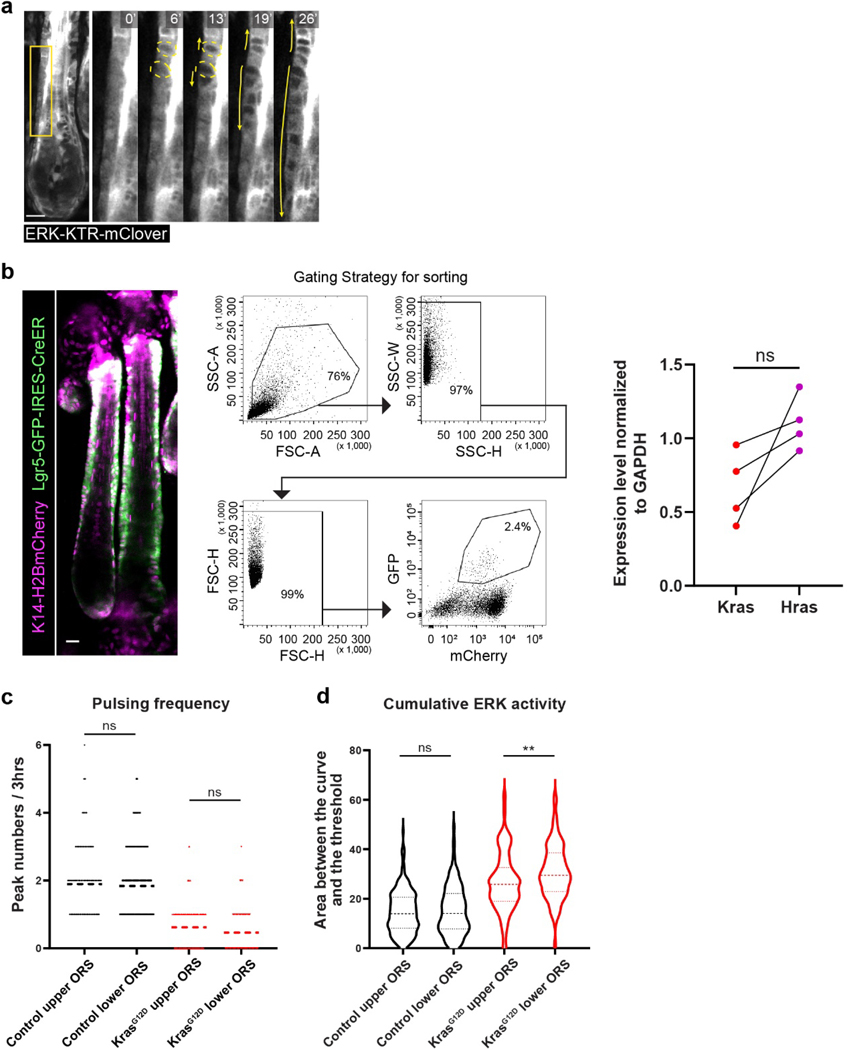
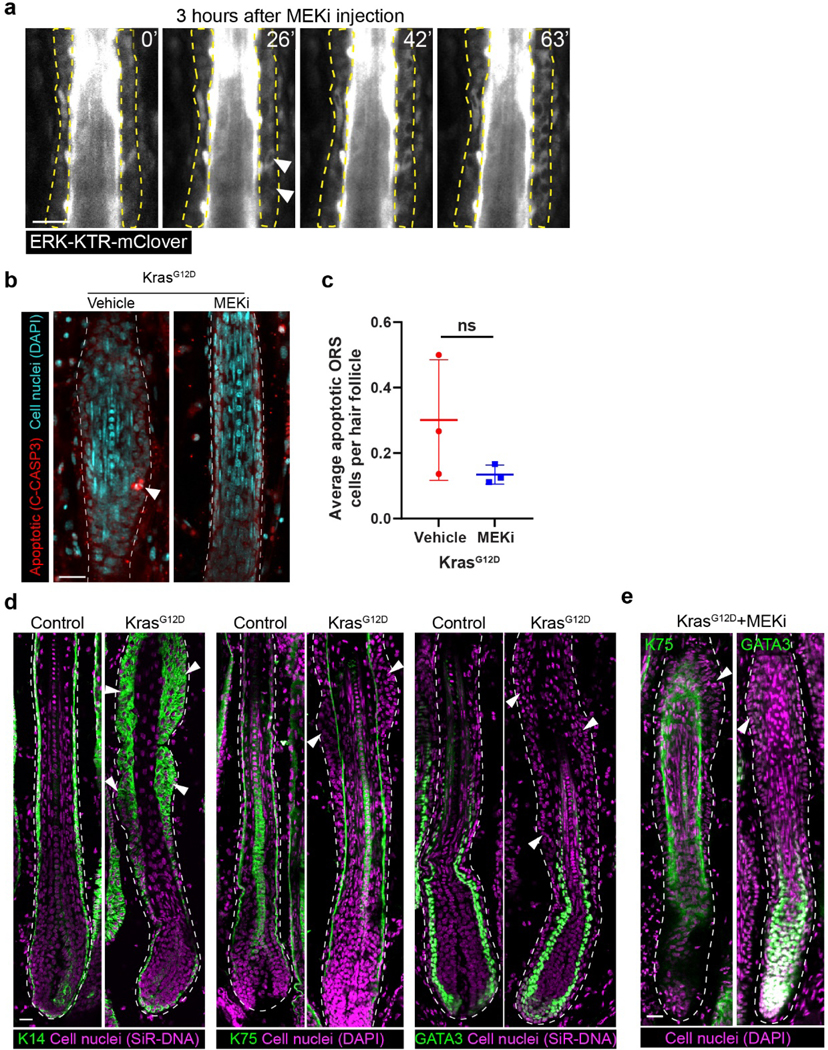
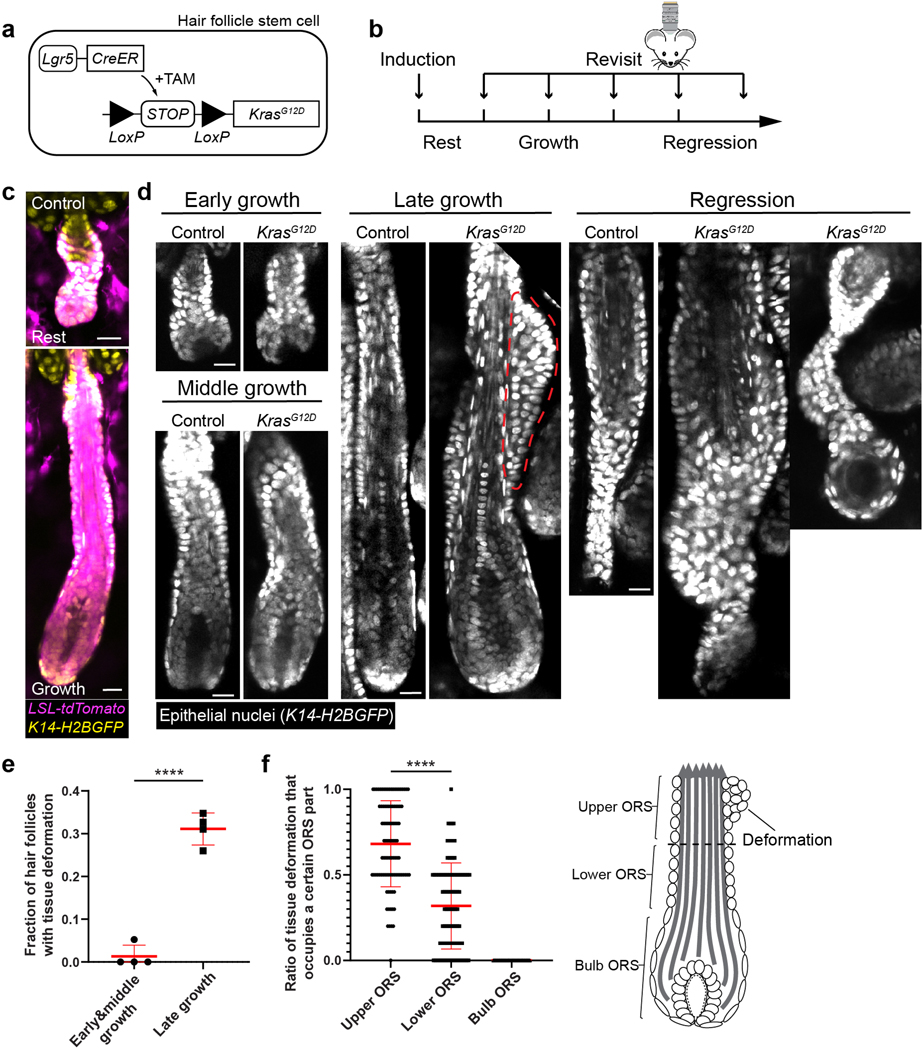
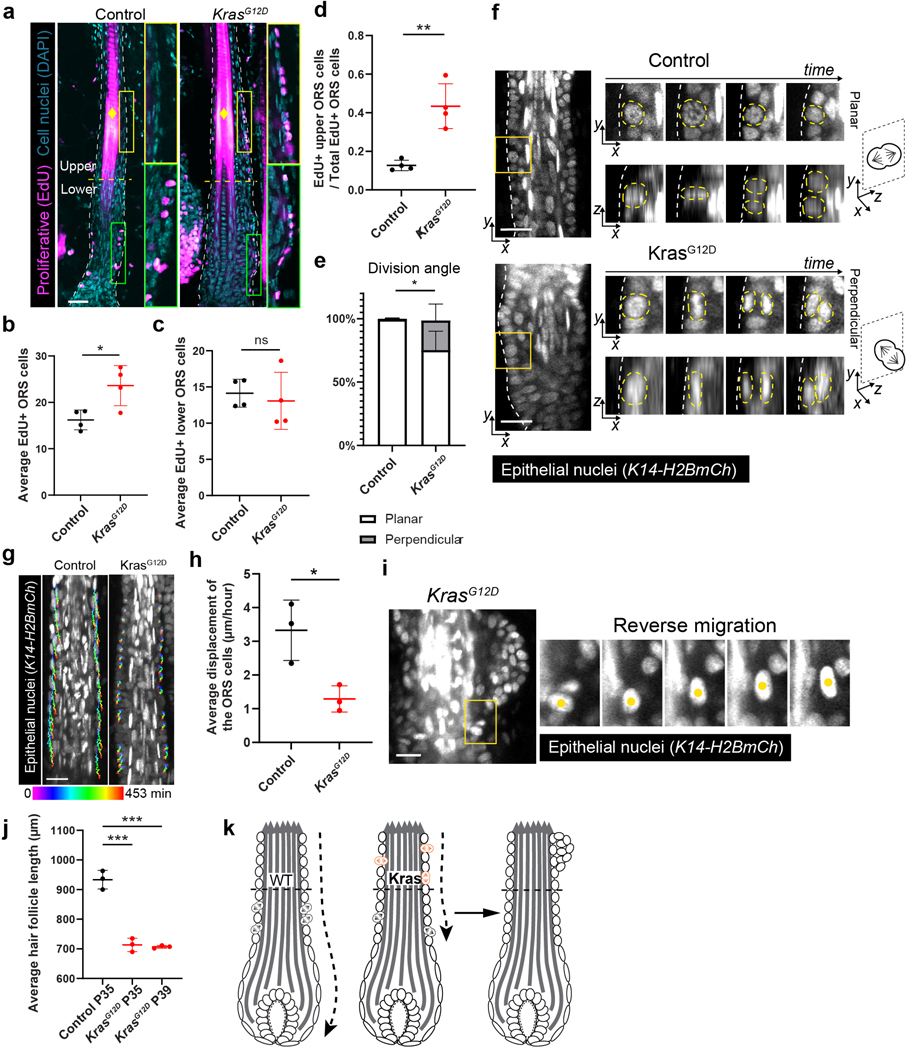
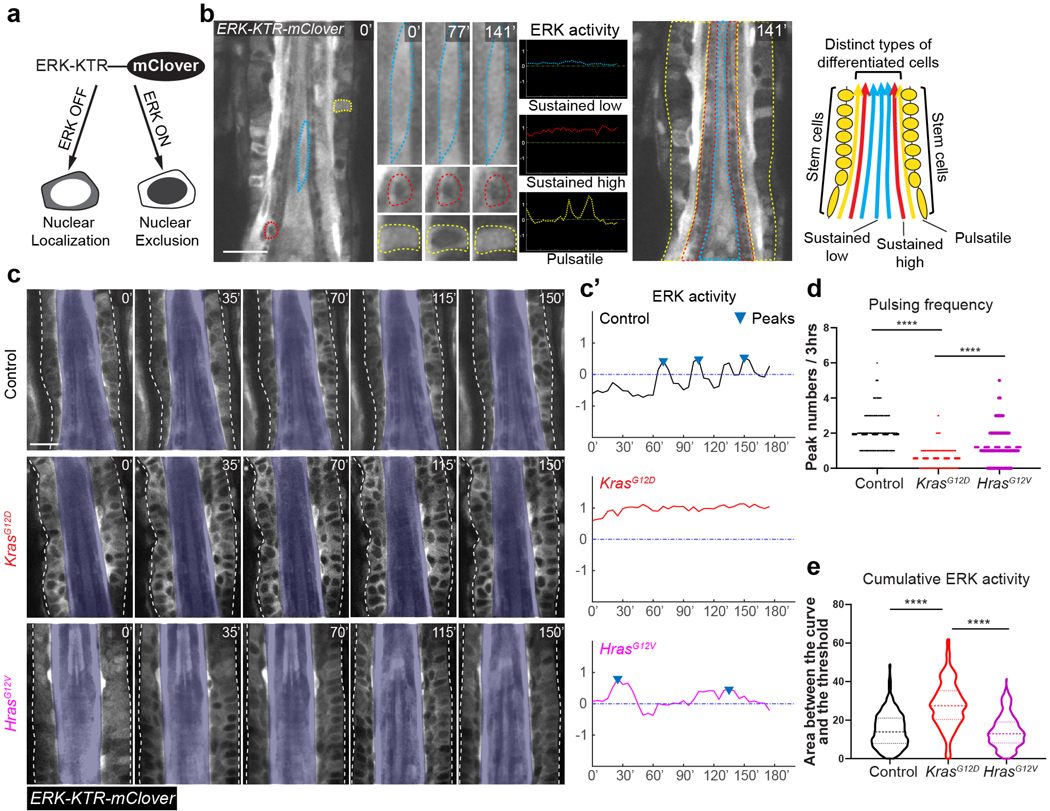
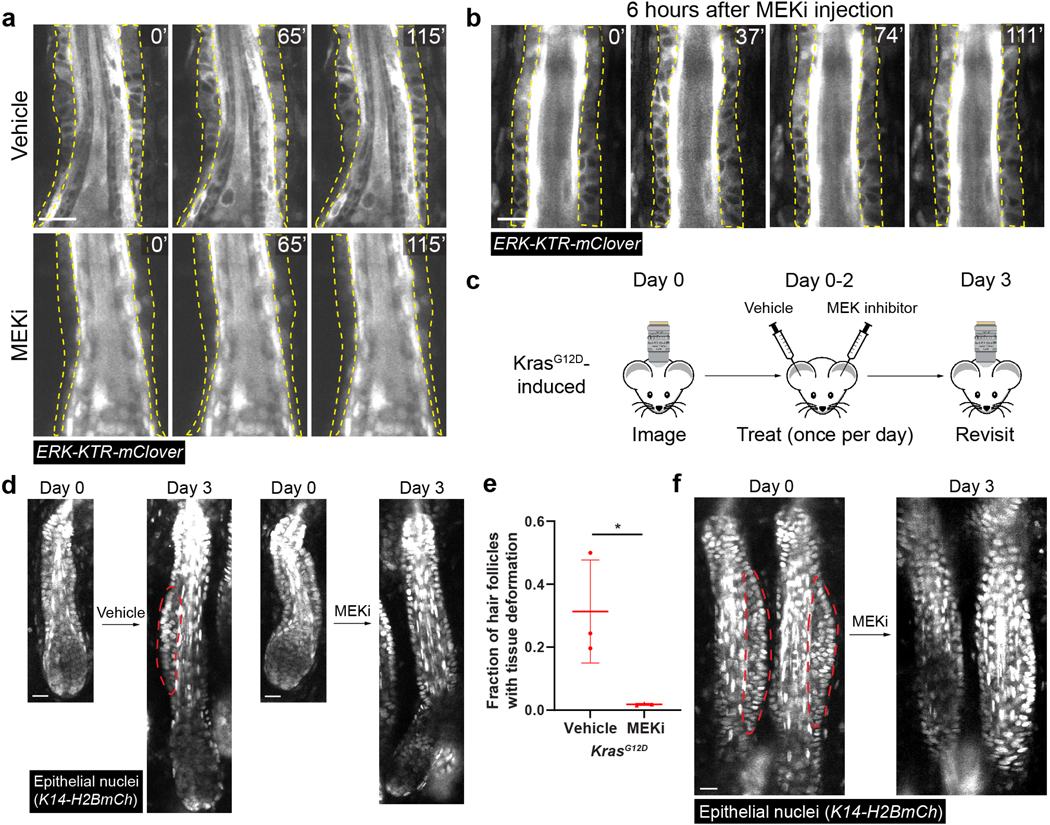
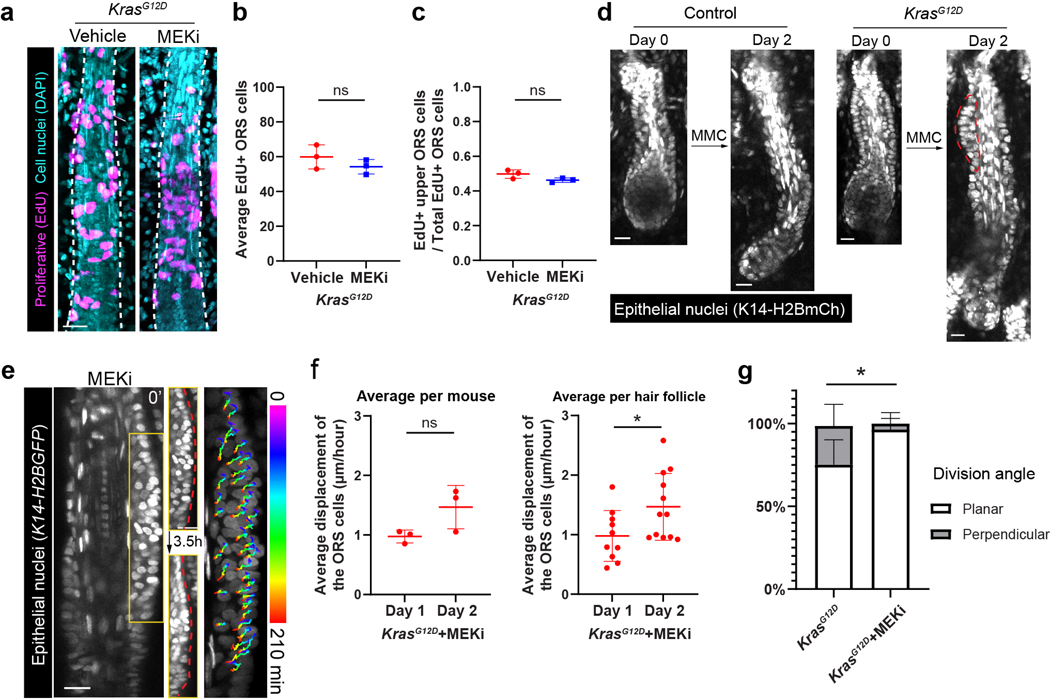
Tissue regeneration and maintenance rely on coordinated stem cell behaviours. This orchestration can be impaired by oncogenic mutations leading to cancer. However, it is largely unclear how oncogenes perturb stem cells' orchestration to disrupt tissue. Here we used intravital imaging to investigate the mechanisms by which oncogenic Kras mutation causes tissue disruption in the hair follicle. Through longitudinally tracking hair follicles in live mice, we found that KrasG12D, a mutation that can lead to squamous cell carcinoma, induces epithelial tissue deformation in a spatiotemporally specific manner, linked with abnormal cell division and migration. Using a reporter mouse capture real-time ERK signal dynamics at the single-cell level, we discovered that KrasG12D, but not a closely related mutation HrasG12V, converts ERK signal in stem cells from pulsatile to sustained. Finally, we demonstrated that interrupting sustained ERK signal reverts KrasG12D-induced tissue deformation through modulating specific features of cell migration and division.


Conflict of interest statement

Competing Interests

The authors declare no competing financial or non-financial interests.

Figures

Extended Data Fig. 1.
Extended Data Fig. 1.. Information on hair cycle and hair type for data interpretation.
a, Schematic showing different stages of the hair follicle regeneration cycle. b, Representative images and percentages of each hair type in the region of the mouse ear skin where intravital imaging was conducted. c, Representative two-photon images of the KrasG12D hair follicles in the same mouse 13 days after induction. In the skin region that hair follicles entered late growth stages, bump-like deformation emerged in the ORS, while in the area of early and middle growth stages, hair follicles were normal. Scale bar, 20 µm.
Extended Data Fig. 2.
Extended Data Fig. 2.. Characteristics of ERK signal dynamics and expression levels of Kras and Hras.
a, Representative two-photon time lapse frames of the wild type late growth hair follicle expressing the ERK biosensor showing wave-like ERK signal propagation in the ORS. In this example, the wave initiated from the middle ORS and propagated towards both the upper and lower ORS. Scale bar, 20 µm. b, Back skin cells at Anagen were processed for flow cytometry and gated for ORS cells using Lgr5-GFP and K14-H2BmCherry. Sorted ORS cells were then used to conduct qRT-PCR to compare the expression levels between Kras and Hras. n=4 mice. ns, not significant, p=0.0852. Two-sided paired t-test was used to calculate p value. Scale bar, 20 µm. c, Pulsing frequency of the ERK signal in the upper and lower ORS cells of the control and KrasG12D hair follicles. n=236 upper and 162 lower ORS cells in 3 wild type mice, 1666 upper and 91 lower ORS cells in KrasG12D mice. ns, not significant, p=0.6385 and 0.0571. Two-sided unpaired t-test was used to calculate p value. d, Cumulative ERK activity of the upper and lower ORS cells of the control and KrasG12D hair follicles. The same cells in c were analyzed. ns, not significant, p=0.5064, **, p=0.0058. Two-sided unpaired t-test was used to calculate p value. Data are presented as mean with individual data points in c and violin plots with median and quartiles in d. Scale bar, 20 µm.
Extended Data Fig. 3.
Extended Data Fig. 3.. MEKi injection temporarily inhibits ERK without promoting apoptosis or differentiation.
a, Representative two-photon time lapse frames of the wild type late growth hair follicles expressing the ERK biosensor 3 hours after intradermal injection of MEKi. Note that ERK activation began to emerge in the ORS (arrowheads) shortly after the time lapse started. b, Representative KrasG12D hair follicles treated with vehicle or MEKi in the whole mount skin stained for cleaved-Caspase3 (C-CASP3, red) and cell nuclei (DAPI, cyan). Apoptotic cell is indicated by arrowhead. c, Average numbers of apoptotic cells in the KrasG12D hair follicles treated with vehicle or MEKi. n=3 mice (102 hair follicles from the skin treated with vehicle and 115 hair follicles from the skin treated with MEKi). ns, not significant, p=0.1964. d, Representative images of the control and KrasG12D hair follicles stained for basal marker K14 or differentiation markers K75 and GATA3 (green). Cell nuclei were labeled by SiR-DNA or DAPI (magenta). Representative tissue deformations in the ORS are indicated by arrowheads. e, Representative images of the KrasG12D hair follicles after MEKi treatment stained for differentiation markers K75 and GATA3 (green). Cell nuclei were labeled by DAPI (magenta). Representative tissue deformations in the ORS are indicated by arrowheads. Border of the hair follicle is marked by white dashed lines in b, d and e. Two-sided unpaired t-test was used to calculate p values. Data are presented as mean ±S.D. with individual data points in c. Scale bars, 20 µm.
Figure 1.
Figure 1.. KrasG12D induces spatiotemporally specific tissue deformation in hair follicle regeneration
a, Schematic showing the genetic approach to induce KrasG12D in the hair follicle stem cells via tamoxifen (TAM) inducible Cre-LoxP system. b, Schematic showing the timing of the KrasG12D induction and repeated imaging relative to the hair cycle stages. c, Representative two-photon images of the wild-type resting and growing hair follicles carrying Cre-inducible tdTomato (magenta) reporter after induction. d, Representative two-photon images of the control and KrasG12D hair follicles at different stages of the hair cycle. Bump-like tissue deformation in the ORS is outlined by a red dashed line. e, Fraction of the KrasG12D hair follicles with tissue deformation at different stages of hair follicle growth. n=4 mice. 169 early & middle growth and 311 late growth hair follicles were analyzed. ****, p<0.0001. Two-sided unpaired t-test was used to calculate p value. f, Fraction of tissue deformations occupying upper, lower, and bulb ORS for individual KrasG12D hair follicles. n=97 hair follicles that developed deformation in 4 KrasG12D mice were analyzed. ****, p<0.0001. Two-sided paired t-test was used to calculate p value. No tissue deformation that occupied bulb ORS was detected. Schematic shows different parts of ORS. The border (dashed line) between the upper and lower ORS is determined by the midpoint of the hair follicle length above the bulb. Data are presented as mean ±S.D. with individual data points in e and f. Epithelial nuclei were labeled by K14-H2BGFP (yellow in c and white in d). Scale bars, 20 µm.
Figure 2.
Figure 2.. KrasG12D causes abnormal cell division and migration during hair follicle growth
a, Representative images of the control and KrasG12D hair follicles on tissue sections with EdU (magenta) and DAPI (cyan) labeling for analyzing cell proliferation in the ORS. Upper and lower ORS are separated by a yellow dashed line. The diamond symbol denotes the hair shaft. b, Average numbers of EdU+ ORS cells quantified on tissue sections in the control and KrasG12D hair follicles. n=4 control mice and 4 KrasG12D mice. *, p=0.0218. c, Average numbers of EdU+ lower ORS cells quantified on tissue sections in the control and KrasG12D hair follicles. n=4 control and 4 KrasG12D mice. ns, not significant, p=0.6461. d, Ratio of the EdU+ upper ORS cells to the total EdU+ ORS cells in the control and KrasG12D hair follicles. n=4 control and 4 KrasG12D mice. **, p=0.0022. e, Percentages of the planar and perpendicular divisions in the control and KrasG12D hair follicles. n=3 control and 3 KrasG12D mice. *, p=0.0378. f, Representative two-photon time lapse frames of the control and KrasG12D hair follicles showing division angles of the ORS cells. Nuclei of dividing cells are marked with yellow dashed lines. g, Representative two-photon time lapse frames of the control and KrasG12D hair follicles showing migration tracks of ORS cells over 7.5 hours. h, Average cell displacement per hour of the control and KrasG12D ORS cells. n= 3 control and 3 KrasG12D mice. *, p=0.0224. i, Two-photon time lapse frames showing one KrasG12D ORS cell migrating upwards. j, Length comparison between the P35 control hair follicles and the P35 and P39 KrasG12D hair follicles. n=3 P35 control mice, 3 P35 KrasG12D mice and 3 P39 KrasG12D mice. ***, p=0.0006 (P35) and 0.0003 (P39). k, Schematic showing abnormal division and migration of the KrasG12D ORS cells contribute to tissue deformation. Two-sided unpaired t-test was used to calculate p values in b-e, h, j. Data are presented as mean ±S.D. with individual data points in b- d, h, j, and stacked bars with mean +S.D. in e. Epithelial nuclei were labeled by K14-H2BmCherry (white in f, g and i). Scale bars, 20 µm.
Figure 3.
Figure 3.. KrasG12D converts pulsatile into sustained ERK activation in the hair follicle stem cells
a, Schematic showing that the ERK-KTR-mClover biosensor reports ERK activation status based on its nucleocytoplasmic distribution. b, Representative two-photon time lapse frames of the wild-type late growth hair follicle expressing the ERK biosensor. Example cells in different layers are outlined by dashed lines (blue, inner differentiated cell; red, middle differentiated cell; yellow, outer stem cell). Their ERK activation dynamics are indicated by the selected time frames and plotted curves. Schematic shows distinct ERK activation dynamics at different layers of the late growth hair follicle. c, Representative two-photon time lapse frames of the wild-type, KrasG12D, and HrasG12V hair follicles, showing different ERK activation dynamics in the ORS. Hair follicle borders are marked with white dashed lines and inner layers are masked in opaque blue to better show the ORS cells. c′, ERK activation curves of one representative ORS cell in each hair follicle in c. Peaks within the curves were identified by a threshold of local maxima to reflect the pulsing frequency. Complete datasets of all the analyzed cells can be found in Source data. d, Pulsing frequency of the ERK signal in the wild-type, KrasG12D, and HrasG12V ORS cells represented by peak numbers in the 3-hour ERK activation curve. n=448 cells in 32 hair follicles in 3 control mice, 364 cells in 26 hair follicles in 3 KrasG12D mice, and 364 cells in 26 hair follicles in 3 HrasG12V mice. ****, p<0.0001. e, Cumulative ERK activity of the wild-type, KrasG12D and HrasG12V ORS cells represented by the area between the curve and the threshold. Cells analyzed were the same as in d. ****, p<0.0001. Two-sided unpaired t-test was used to calculate p values in d, e. Data are presented as mean with individual data points in d and violin plots with median and quartiles in e. Scale bars, 20 µm.
Figure 4.
Figure 4.. Interrupting sustained ERK activation both prevent and reverse KrasG12D-induced tissue
deformation a, Representative two-photon time lapse frames of the wild-type late growth hair follicles expressing the ERK biosensor 2.5 hours after intradermal injection of the MEK inhibitor (MEKi) or vehicle. b, Representative two-photon time lapse frames of the wild-type late growth hair follicles expressing the ERK biosensor 6 hours after intradermal injection of MEKi. c, Schematic showing the schedule of imaging and drug treatment of the same mice for testing the consequence of interrupting sustained ERK activation in the KrasG12D hair follicles. MEKi and vehicle were intradermally injected into the left ear and right ear, respectively, of the same mouse. d, Representative two-photon images of the same KrasG12D hair follicles treated with vehicle or MEKi in the same mouse. e, Fraction of the KrasG12D hair follicles having tissue deformation after the treatment of MEKi or vehicle. n=3 mice. 104 vehicle-treated and 170 MEKi-treated hair follicles were analyzed. *, p=0.0352. Two-sided unpaired t-test was used to calculate p value. Data are presented as mean ±S.D. with individual data points. f, Representative two-photon images of the same KrasG12D hair follicles before and after MEKi treatment showing reversal of the tissue deformation. ORS layers are outlined by dashed lines in a and b. Bump-like tissue deformation in the ORS is outlined by red dashed lines in d and f. Epithelial nuclei were labeled by K14-H2BmCherry (d and f). Scale bars, 20 µm.
Figure 5.
Figure 5.. Interrupting sustained ERK activation alters specific cell behaviors in KrasG12D mutant hair follicles.
a, Image stack projections of the representative KrasG12D hair follicles treated with vehicle or MEKi in the whole mount skin stained for EdU (magenta) and cell nuclei (DAPI, cyan). b, Average EdU+ ORS cells in the KrasG12D hair follicles treated with vehicle or MEKi. n=3 mice (60 hair follicles from the skin treated with vehicle and 60 hair follicles from the skin treated with MEKi). ns, not significant, p=0.2906. c, Ratio of the EdU+ upper ORS cells to the total EdU+ ORS cells in the KrasG12D hair follicles treated with vehicle or MEKi. n=3 mice (60 hair follicles from the skin treated with vehicle and 60 hair follicles from the skin treated with MEKi). ns, not significant, p=0.0898. d, Representative two-photon images of the same control and KrasG12D hair follicles treated with MMC in the same mouse. Epithelial nuclei were labeled by K14-H2BmCherry. Bump-like tissue deformation in the ORS is outlined by red dashed line. e, Representative two-photon time lapse frames of the KrasG12D hair follicle after the treatment of MEKi showing laterally convergent movement of the ORS cells within the deformation over 3.5 hours. Phenomenon was observed in 12 hair follicles in 6 mice. Epithelial nuclei were labeled by K14-H2BGFP. f, Average cell displacement per hour of the KrasG12D ORS cells after MEKi treatment. For the left analysis, n=3 mice on Day 1 and 3 mice on Day 2. For the right analysis, n=10 hair follicles on Day 1 and 12 hair follicles on Day 2. ns, p=0.0876. *, p=0.0350. g, Percentages of the planar and perpendicular divisions in the KrasG12D hair follicles without and with MEKi treatment based on time lapse analysis. n=3 KrasG12D (same as Figure 2e) and 6 KrasG12D+MEKi mice. *, p=0.0165. Two-sided unpaired t-test was used to calculate p values in b, c, f and g. Data are presented as mean ±S.D. with individual data points in b, c and f, and stacked bars with mean +S.D. in g. Scale bars, 20 µm.

Similar articles

Cited by

References

    1. Bissell MJ & Hines WC Why don’t we get more cancer? A proposed role of the microenvironment in restraining cancer progression. Nat Med 17, 320–329 (2011). - PMC - PubMed
    1. Schneider G, Schmidt-Supprian M, Rad R & Saur D Tissue-specific tumorigenesis: context matters. Nat Rev Cancer 17, 239–253 (2017). - PMC - PubMed
    1. Kakiuchi N & Ogawa S Clonal expansion in non-cancer tissues. Nat Rev Cancer 21, 239–256 (2021). - PubMed
    1. Amberg N et al. Mouse models of nonmelanoma skin cancer. Methods Mol Biol 1267, 217–250 (2015). - PubMed
    1. Lapouge G et al. Identifying the cellular origin of squamous skin tumors. Proc Natl Acad Sci U S A 108, 7431–7436 (2011). - PMC - PubMed

Methods-only references

    1. Tumbar T et al. Defining the epithelial stem cell niche in skin. Science 303, 359–363 (2004). - PMC - PubMed
    1. Mesa KR et al. Niche-induced cell death and epithelial phagocytosis regulate hair follicle stem cell pool. Nature 522, 94–97 (2015). - PMC - PubMed
    1. Madisen L et al. A robust and high-throughput Cre reporting and characterization system for the whole mouse brain. Nat Neurosci 13, 133–140 (2010). - PMC - PubMed
    1. Jackson EL et al. Analysis of lung tumor initiation and progression using conditional expression of oncogenic K-ras. Genes Dev 15, 3243–3248 (2001). - PMC - PubMed
    1. Chen X et al. Endogenous expression of Hras(G12V) induces developmental defects and neoplasms with copy number imbalances of the oncogene. Proc Natl Acad Sci U S A 106, 7979–7984 (2009). - PMC - PubMed

MeSH terms

Substances

LinkOut - more resources