. 2024 Jun;21(6):604-619.
doi: 10.1038/s41423-024-01150-0. Epub 2024 Apr 30.

Immunopeptidome mining reveals a novel ERS-induced target in T1D

Affiliations

Immunopeptidome mining reveals a novel ERS-induced target in T1D

Lina Wang et al. Cell Mol Immunol. 2024 Jun.

Abstract

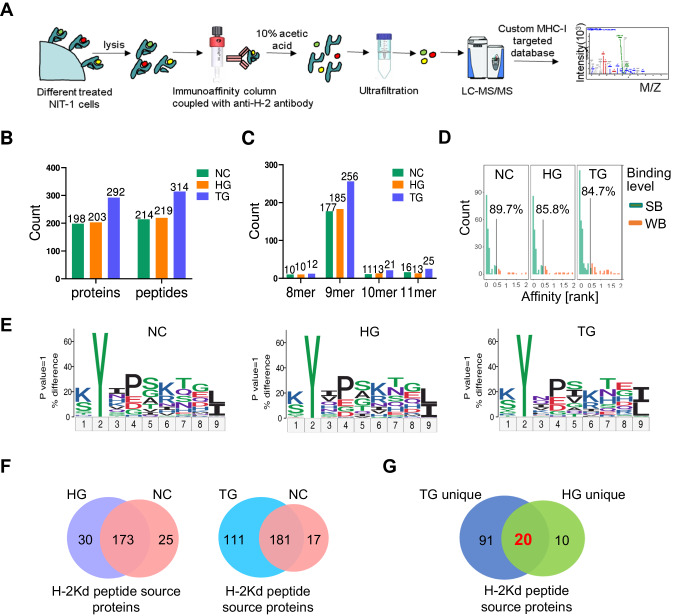
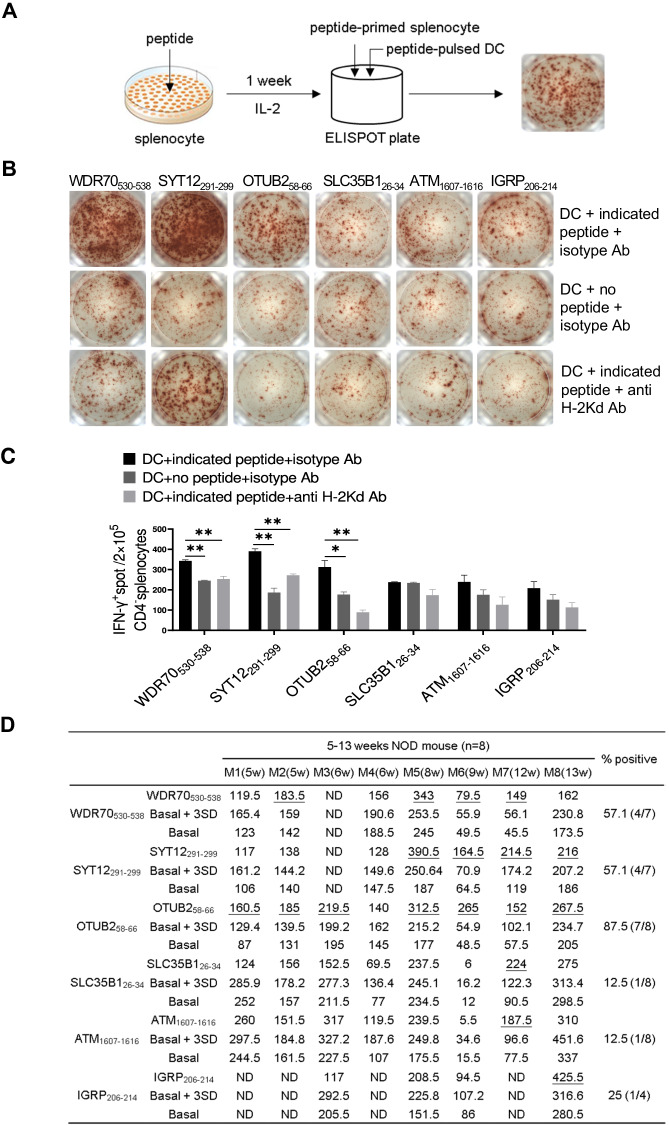
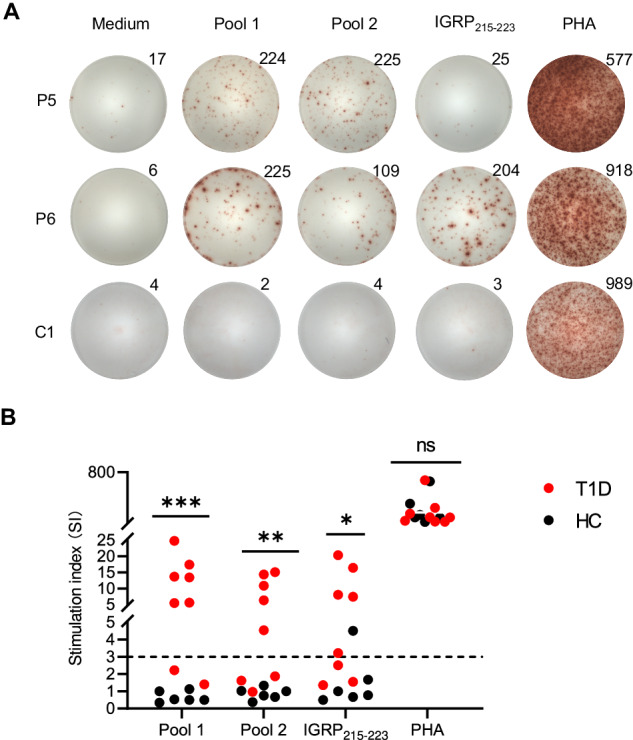
Autoreactive CD8+ T cells play a key role in type 1 diabetes (T1D), but the antigen spectrum that activates autoreactive CD8+ T cells remains unclear. Endoplasmic reticulum stress (ERS) has been implicated in β-cell autoantigen generation. Here, we analyzed the major histocompatibility complex class I (MHC-I)-associated immunopeptidome (MIP) of islet β-cells under steady and ERS conditions and found that ERS reshaped the MIP of β-cells and promoted the MHC-I presentation of a panel of conventional self-peptides. Among them, OTUB258-66 showed immunodominance, and the corresponding autoreactive CD8+ T cells were diabetogenic in nonobese diabetic (NOD) mice. High glucose intake upregulated pancreatic OTUB2 expression and amplified the OTUB258-66-specific CD8+ T-cell response in NOD mice. Repeated OTUB258-66 administration significantly reduced the incidence of T1D in NOD mice. Interestingly, peripheral blood mononuclear cells (PBMCs) from patients with T1D, but not from healthy controls, showed a positive IFN-γ response to human OTUB2 peptides. This study provides not only a new explanation for the role of ERS in promoting β-cell-targeted autoimmunity but also a potential target for the prevention and treatment of T1D. The data are available via ProteomeXchange with the identifier PXD041227.

Keywords: CD8+ T cells; ERS; OTUB2; T1D; immunopeptidome.


Conflict of interest statement

The authors declare no competing interests. Yuzhang Wu is an editorial board member of Cellular & Molecular Immunology, but he has not been involved in the peer review or the decision-making of the article.

Figures

Fig. 1
Fig. 1
High glucose (HG) and thapsigargin (TG) treatment reshapes the NIT-1 cell-derived MHC-I-associated immunopeptidome (MIP). A The workflow for identifying NIT-1 cell-derived MIPs. B The total numbers of H2-Kd-restricted peptides and their potential source proteins in the MIP derived from nonstressed NIT-1 cells (NIT-1-NC) and ER-stressed NIT-1 cells treated with HG (NIT-1-HG) or TG (NIT-1-TG). C Length distributions of MIPs derived from NIT-1-NC, NIT-1-HG and NIT-1-TG cells (8 ~11 amino acids). D The predicted affinities of peptides by NetMHC-4.0, SB: strong binder (%Rank<0.5); WB: weak binder (%Rank:0.5 ~ 2). E The binding motifs of the 9-mer peptides identified in the MIP. The x-axis represents the residue position within the 9-mer peptide sequence. The y-axis represents the information content, with the size of each amino acid symbol proportional to its frequency. F Overlap of H-2Kd-restricted MIPs between NIT-1-NC and NIT-1-HG cells and between NIT-1-NC and NIT-1-TG cells at the source protein level. G Overlap of the source proteins for H-2Kd-restricted peptides exclusively present in the MIPs of NIT-1-HG and NIT-1-TG cells
Fig. 2
Fig. 2
OTUB258-66 is an immunodominant self-peptide in nonobese diabetic (NOD) mice. A The workflow for the recall IFN-γ ELISPOT assay. B Representative ELISPOT images showing IFN-γ production by the indicated peptide-primed NOD mouse CD4- splenocytes restimulated with DCs alone in the presence of an isotype Ab (DC + no peptide + isotype Ab), the indicated peptide-pulsed DCs in the presence of an isotype Ab (DC + indicated peptide + isotype Ab) or the indicated peptide-pulsed DCs in the presence of an anti-H-2Kd antibody (DC + indicated peptide + anti-H-2Kd Ab). C Summary data for the assay in (B) showing the mean IFN-γ spot number per 2 × 105 CD4- splenocytes ± SD in duplicate cultures. The data are one representative result of eight independent experiments. *p < 0.05, **p < 0.01, determined by Student’s t test. D The reactivity of CD4- splenocytes from NOD mice harvested at different ages to the indicated peptides, as determined by the recall IFN-γ ELISPOT assay. Readouts are expressed as the mean spot numbers/2 × 105 CD4- splenocytes in duplicate cultures. The average readout from CD4- splenocytes restimulated with DCs alone was set as the basal response. A positive response against the indicated peptide was defined as readouts above basal + 3 SD (underlined); ND indicates no data
Fig. 3
Fig. 3
Characterization of OTUB258-66-specific CD8+ T cells in nonobese diabetic (NOD) mice. A Representative flow cytometry plots of CD8+dextramer+ T cells in the spleens, pancreases and pancreatic draining lymph nodes (pLNs) of NOD mice. B Representative flow cytometry histograms showing carboxyfluorescein succinimidyl ester (CFSE) dilution in NOD mouse splenic CD8+ T cells stimulated with or without OTUB258-66 (50 μg/mL). C Summary data for the assay in (B) are presented as the mean proliferation rate ±SD in triplicate for one representative result of three independent experiments. D Representative flow cytometry plots of peptide-loaded or unloaded NOD mouse splenocytes labeled with CFSE and incubated for 4 h in the presence (target + effector) or absence (target control) of NOD mouse CD8+ T cells (effector/target ratio, 100:1). Population 1 contained fluorescent microspheres that could be discriminated on the basis of their scattering pattern and fluorescence. Population 2 contained CFSE-negative cells (effector T cells). Population 3 contained CFSE-positive cells (target cells). E Summary data for the assay in (D) are presented as the mean killing rate ± SD in triplicate for one representative result of three independent experiments. **P < 0.01, ***p < 0.001, determined by Student’s t test
Fig. 4
Fig. 4
OTUB258-66 peptide-specific CD8+ T cells are diabetogenic in nonobese diabetic/severe combined immunodeficiency (NOD/scid) mice. A The workflow for the adoptive transfer experiment. B Representative images of HE staining of the pancreas of NOD/scid mice receiving OTUB258-66-activated or control splenocytes (magnification, 200×). C Insulitis scores of NOD/scid recipient mice receiving OTUB258-66-activated or control splenocytes. D T1D incidence curve of NOD/scid mice adoptively transferred with OTUB258-66-activated or control splenocytes. Significance was determined by the log-rank (Mantel-Cox) test, *P < 0.05. E Representative laser confocal fluorescence microscopy images of pancreatic sections from NOD/scid mice stained for insulin (red) and CD8 (green). The cells were counterstained with the nuclear dye DAPI (blue). F Summary data for the assay in (E) are representative of two independent experiments and are presented as the mean ± SD, n = 5, **p < 0.01, as determined by Student’s t test
Fig. 5
Fig. 5
Sustained high glucose intake increases the peptide-specific CD8+ T-cell response against OTUB258-66 in nonobese diabetic (NOD) mice. A Summary data showing the absolute cell number of pancreas-infiltrating lymphocytes in 6- and 12-week-old NOD mice fed high-glucose water (HG) or normal water (NC) (n = 4); *p < 0.05, determined by Student’s t test. B Representative flow cytometry plots of CD8+ dextramer+ T cells in the pancreas of 6-week-old NOD mice fed high-glucose water (HG) or normal water (NC). C Summary data for the assay in B are representative of two independent experiments and are presented as the mean ± SD (n = 4). D Representative flow cytometry plots showing the production of IFN-γ and TNF-α by NOD mouse-derived splenic CD8+ T cells stimulated with phorbol-12-myristate-13-acetate (PMA, 50 ng/mL) plus ionomycin (1 μg/mL). E Summary data for the assay in D are representative of two independent experiments and are presented as the mean ± SD (n = 4). F Summary data showing the proportions of IFN-γ- and TNF-α-producing cells in 6- and 12-week-old NOD mouse splenocytes stimulated with or without the indicated peptide (50 μg/mL). The data are expressed as the mean ± SD, n = 4
Fig. 6
Fig. 6
High glucose treatment increases OTUB2 expression in both the pancreases of nonobese diabetic (NOD) mice and NIT-1 cells. A Representative image of immunohistochemical analysis of OTUB2 expression in pancreatic sections from NOD mice. B, C Western blot analysis of OTUB2 expression in the pancreas of NOD mice given normal water (NC-NOD) or high-glucose water (HG-NOD). D, E Western blot analysis of the protein level of OTUB2 in untreated NIT-1 cells (NIT-1-NC) and NIT-1 cells treated with HG (NIT-1-HG) or TG (NIT-1-TG). F Quantitative PCR analysis of relative OTUB2 mRNA expression in untreated NIT-1 cells (control), NIT-1 cells treated with HG or TG, and NIT-1 cells treated with HG or TG in the presence of tauroursodeoxycholic acid (TUDCA). The data are representative of three independent experiments and are expressed as the mean ± SD. *P < 0.05, **P < 0.01, ***p < 0.001, ****p < 0.0001, as determined by Student’s t test
Fig. 7
Fig. 7
Repeated vaccination with the OTUB258-66 peptide prevents type 1 diabetes (T1D) onset in nonobese diabetic (NOD) mice. A The workflow for the peptide vaccination experiment. B Incidence of diabetes in female NOD mice injected with the OTUB258-66 peptide plus poly IC (red line, n = 14) or with poly IC alone (black line, n = 14). *p < 0.05 compared by the log-rank (Mantel-Cox) test. C Summary data showing the absolute number of pancreas-infiltrating lymphocytes in NOD mice after 2 or 3 injections of the OTUB258-66 peptide mixed with poly IC (OTUB258-66) or poly IC alone (control). The data are representative of two independent experiments and are presented as the mean ± SD (n = 4 per group). D Representative flow cytometry plots of CD8+dextramer+ T cells in the pancreas of NOD mice after 2 or 3 injections of the OTUB258-66 peptide plus poly IC (OTUB258-66) or poly IC alone (control). E Summary data for the assay in (D) showing the frequency of CD8+ dextramer+ T cells in the pancreas of NOD mice after 2 or 3 injections. The data are representative of two independent experiments and are presented as the mean ± SD (n = 4 per group). F Representative flow cytometry plots depicting PMA- and OTUB258-66-stimulated IFN-γ and TNF-α production by splenic CD8+ T cells from NOD mice after 2 or 3 injections of the OTUB258-66 peptide plus poly IC (OTUB258-66) or poly IC alone (control). G Statistical summary of the flow cytometry data shown in F. The data are representative of two independent experiments and are presented as the mean ± SD (n = 4 per group). *p < 0.05, **p < 0.01, ***p < 0.001, as determined by Student’s t test
Fig. 8
Fig. 8
Autoreactive T-cell responses to human OTUB2 peptides in patients with type 1 diabetes (T1D). A Representative ELISPOT images showing IFN-γ production by the peripheral blood mononuclear cells (PBMCs) of HLA-A2+ patients with T1D and healthy controls stimulated with HLA-A*0201-restricted OTUB2 peptide pool 1 and pool 2 (50 μg/mL of each peptide), IGRP215-233 (50 μg/mL), phytohemagglutinin (PHA, 2.5 μg/mL) or medium alone. The number represents the number of IFN-γ spots in each well. B Summary data for the IFN-γ ELISPOT assay in A. Each dot shows the stimulation index (Sl) of triplicate wells for each subject. The horizontal dashed line represents the cutoff of positivity (SI ≥ 3). The data are presented as the mean ± SD. *p < 0.05, **p < 0.01, ***p < 0.001, determined by the Mann‒Whitney U test

Similar articles

Cited by

References

    1. Norris JM, Johnson RK, Stene LC. Type 1 diabetes—early life origins and changing epidemiology. Lancet Diabetes Endocrinol. 2020;8:226–38. doi: 10.1016/S2213-8587(19)30412-7. - DOI - PMC - PubMed
    1. von Scholten BJ, Kreiner FF, Gough SCL, von Herrath M. Current and future therapies for type 1 diabetes. Diabetologia. 2021;64:1037–48. doi: 10.1007/s00125-021-05398-3. - DOI - PMC - PubMed
    1. Pathiraja V, Kuehlich JP, Campbell PD, Krishnamurthy B, Loudovaris T, Coates PT, et al. Proinsulin-specific, HLA-DQ8, and HLA-DQ8-transdimer-restricted CD4+ T cells infiltrate islets in type 1 diabetes. Diabetes. 2015;64:172–82. doi: 10.2337/db14-0858. - DOI - PubMed
    1. De Riva A, Varley MC, Bluck LJ, Cooke A, Deery MJ, Busch R. Accelerated turnover of MHC class II molecules in nonobese diabetic mice is developmentally and environmentally regulated in vivo and dispensable for autoimmunity. J Immunol. 2013;190:5961–71. doi: 10.4049/jimmunol.1300551. - DOI - PMC - PubMed
    1. Antoniou AN, Elliott J, Rosmarakis E, Dyson PJ. MHC class II Ab diabetogenic residue 57 Asp/non-Asp dimorphism influences T-cell recognition and selection. Immunogenetics. 1998;47:218–25. doi: 10.1007/s002510050351. - DOI - PubMed

MeSH terms