. 2024 Jun;6(6):1024-1035.
doi: 10.1038/s42255-024-01038-3. Epub 2024 Apr 30.

Inhibition of mammalian mtDNA transcription acts paradoxically to reverse diet-induced hepatosteatosis and obesity

Affiliations

Inhibition of mammalian mtDNA transcription acts paradoxically to reverse diet-induced hepatosteatosis and obesity

Shan Jiang et al. Nat Metab. 2024 Jun.

Abstract

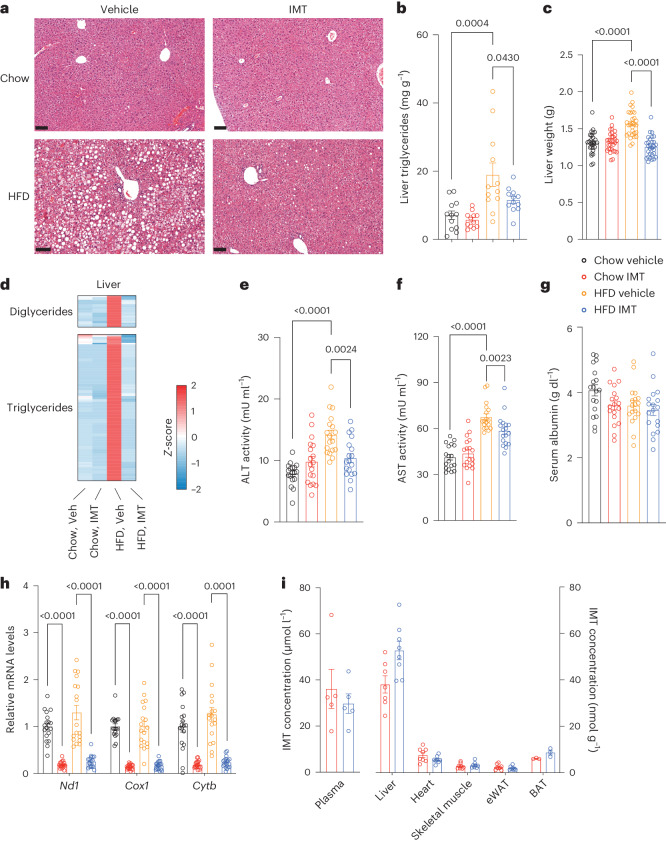
The oxidative phosphorylation system1 in mammalian mitochondria plays a key role in transducing energy from ingested nutrients2. Mitochondrial metabolism is dynamic and can be reprogrammed to support both catabolic and anabolic reactions, depending on physiological demands or disease states. Rewiring of mitochondrial metabolism is intricately linked to metabolic diseases and promotes tumour growth3-5. Here, we demonstrate that oral treatment with an inhibitor of mitochondrial transcription (IMT)6 shifts whole-animal metabolism towards fatty acid oxidation, which, in turn, leads to rapid normalization of body weight, reversal of hepatosteatosis and restoration of normal glucose tolerance in male mice on a high-fat diet. Paradoxically, the IMT treatment causes a severe reduction of oxidative phosphorylation capacity concomitant with marked upregulation of fatty acid oxidation in the liver, as determined by proteomics and metabolomics analyses. The IMT treatment leads to a marked reduction of complex I, the main dehydrogenase feeding electrons into the ubiquinone (Q) pool, whereas the levels of electron transfer flavoprotein dehydrogenase and other dehydrogenases connected to the Q pool are increased. This rewiring of metabolism caused by reduced mtDNA expression in the liver provides a principle for drug treatment of obesity and obesity-related pathology.


Conflict of interest statement

N.G.L. is a scientific founder and holds stock in Pretzel Therapeutic. T.B., A.U. and R.D.L. are employees of Lead Discovery Center and are co-inventors of the patent application WO 2019/057821. The remaining authors declare no competing interests.

Figures

Fig. 1
Fig. 1. IMT treatment prevents diet-induced obesity and improves glucose homoeostasis.
a, Experimental strategy for diet intervention and IMT treatment. Male 4-week-old C57BL/6N mice were randomly fed either a chow diet or HFD for 8 weeks. Thereafter, the diet was continued and mice were orally treated with IMT (30 mg kg−1) or vehicle for 4 weeks. Six independent cohorts of mice were used in this study; total mice n = 260. b, Body weight in mice on a chow diet or HFD treated with vehicle or IMT compound; n = 22 mice per group. Asterisk indicates a significant difference between HFD IMT and HFD vehicle. #Indicates a significant difference between chow vehicle and HFD vehicle. P values are indicated. c, Body composition showing fat mass and lean mass after 4 weeks of IMT treatment; n = 17 mice per group. d,g, Measurement of whole-body metabolism during the fourth week of gavage treatment with vehicle or IMT compound using Oxymax/CLAMS. Food intake during the fourth day (d). The average RER over 42 h during the light and dark cycles (g). The RER in the four groups of mice. Chow vehicle, n = 10; chow IMT, n = 10; HFD vehicle, n = 8; and HFD IMT, n = 11 mice. e, Mouse faeces was collected for 4 days during the fourth week of IMT or vehicle treatment using the Single Mouse Metabolic Cage System. Faecal lipids were extracted using Folch’s method; n = 9 mice per group. f, Total faecal energy was analysed using bomb calorimetry; n = 9 mice per group. Data are presented as mean ± s.e.m. (bg). Statistical significance was assessed by a two-way ANOVA with Tukey’s test for multiple comparisons. P values are indicated. Part of the image in a was created with BioRender.com. Source data
Fig. 2
Fig. 2. IMT treatment reverses hepatosteatosis.
a, Representative images of H&E staining showing liver structure and morphology in mice on a chow diet or HFD treated with either vehicle or IMT compound. Scale bars, 100 µm. n = 5 mice per group. b, Quantitative measurement of triglycerides in mouse liver after 4 weeks of IMT treatment; n = 12 mice per group. c, Liver weight in mice treated with vehicle or IMT for 4 weeks; n = 30 mice per group. d, The levels of diglycerides and triglycerides in mouse liver after 4 weeks of IMT treatment. Chow vehicle, chow IMT and HFD vehicle, n = 8 mice per group; HFD IMT, n = 7 mice. Veh, vehicle. eg, Serum alanine aminotransferase (ALT) activity (e) aspartate aminotransferase (AST) activity (f) and albumin levels (g) measured in mice after 4 weeks of vehicle or IMT treatment; n = 18 mice per group. h, Mitochondrial transcript levels in the liver after 4 weeks of IMT treatment; n = 12 mice per group. i, IMT concentration in plasma and mouse tissues. Plasma, n = 5 mice per group; liver chow IMT, n = 7 mice; HFD IMT, n = 8 mice; heart, skeletal muscle, eWAT, n = 8 mice per group; BAT, n = 3 mice per group. Data are presented as mean ± s.e.m. (b,c,ei). Statistical significance was assessed by a two-way ANOVA with Tukey’s test for multiple comparisons (b,c,e,g,i) and a Mann–Whitney U-test (f,h). P values are indicated. Source data
Fig. 3
Fig. 3. IMT treatment selectively maintains fatty acid respiration in liver mitochondria.
ad, Respiration of fresh liver mitochondria on malate/palmitoylcarnitine (a), succinate/rotenone (b), pyruvate/malate/glutamate (PGM) (c) and glutamate/malate (GM) (d) at state 3, state 4 and the uncoupled state. Chow vehicle and chow IMT groups, n = 5 mice per group; HFD vehicle, n = 7 mice; HFD IMT, n = 8 mice. Data are presented as mean ± s.e.m. Statistical significance was assessed by a two-way ANOVA with Tukey’s test for multiple comparisons. P values are indicated. JO2, oxygen consumption flux; natO, nanoatom oxygen. e, Volcano plot presenting all quantified proteins in mouse liver on a chow diet or HFD and subjected to vehicle or IMT treatment. The differentially expressed subunits of different OXPHOS complexes are highlighted in different colours. f, GSEA of total tissue and mitochondrial proteomes from the liver. g, Heatmaps illustrating the protein density of enzymes involved in fatty acid oxidation in mouse livers after 4 weeks of vehicle or IMT treatment; n = 3 mice per group (eg). Source data
Fig. 4
Fig. 4. IMT treatment rewires liver metabolism.
a, An integrated view of the changes of metabolite and protein levels in liver of mice on a chow diet or HFD and subjected to vehicle or IMT treatment. The protein levels are represented by circles and the metabolite levels are represented by diamonds. b, Substrate oxidation and electron transfer pathways to Q under normal conditions. Glucose is metabolized and produces pyruvate. Pyruvate is imported to the mitochondria and is converted to acetyl-CoA, which enters the tricarboxylic acid (TCA) cycle and generates NADH. Complex I oxidizes NADH and functions as the primary entry point for electrons into the Q pool. Electrons, thereafter, flow through complex III, then through cytochrome c and finally reach complex IV where they reduce molecular oxygen to water. c, IMT impairs the OXPHOS capacity and rewires the pathways for electron transfer to Q. IMT reduces the activities of complex I, III and IV. As a consequence, the capacity of complex I to oxidize NADH is reduced and the electron transfer through electron-transfer flavoprotein dehydrogenase (ETF-DH) to the Q pool is increased. IMT treatment, thus, impairs the OXPHOS system leading to a rewiring of liver metabolism that decreases OXPHOS capacity and maintains fatty acid oxidation. Images in b and c were created with BioRender.com. CI, complex I; CII, complex II; CIII, complex III; CIV, complex IV; CV, complex V; α-KG, α-ketoglutarate; Gpdm, mitochondrial glycerol phosphate dehydrogenase; CoQ9, ubiquinone biosynthesis protein COQ9, mitochondrial; SCAD, short chain acyl-CoA dehydrogenase; MCAD, medium chain acyl-CoA dehydrogenase; VLCAD, very long chain acyl-CoA dehydrogenase.
Extended Data Fig. 1
Extended Data Fig. 1. IMT treatment reduces adiposity without affecting physical activity and total faecal content.
a, Representative images of H&E staining of eWAT. Scale bars, 200 µm. n = 5 mice per group. b, Measurement of whole-body metabolism during the fourth week of gavage treatment with vehicle or IMT compound by using the Oxymax/Comprehensive Lab Animal Monitoring System (CLAMS). The first three days were used to acclimate the animals to the CLAMS system, followed by measurements during the fourth day. Physical activity during day four and day five. Chow vehicle n = 10, Chow IMT n = 10, HFD Vehicle n = 8, and HFD IMT n = 11 mice. Total faecal amount (c) and total faecal lipid content (d) in mice. c and d, Mouse faeces was collected using the Single Mouse Metabolic Cage System. Faecal lipids were extracted using Folch’s method. n = 9 mice per group. All data are presented as mean ± SEM. Statistical significance was assessed by a two-way ANOVA with Tukey’s test for multiple comparisons. P values are shown in the figure. Source data
Extended Data Fig. 2
Extended Data Fig. 2. Measurement of whole-body metabolism in mice.
Measurement of whole-body metabolism during the fourth week of gavage treatment with vehicle or IMT using CLAMS. a, The average oxygen consumption rate during day four and day five. Regression plot of energy expenditure versus total mass (b), or lean mass (c). d, Respiratory exchange ratio during day four and day five. a-d, Chow vehicle n = 9, Chow IMT n = 10, HFD Vehicle n = 8, and HFD IMT n = 10 mice. All data are presented as mean ± SEM. Statistical significance was assessed by a two-way ANOVA with Tukey’s test for multiple comparisons. P values are shown in the figure. Source data
Extended Data Fig. 3
Extended Data Fig. 3. IMT improves glucose homoeostasis and does not impair islet insulin secretion.
a, b, Fasting blood glucose (a) and fasting serum insulin (b) levels in mice after four weeks of IMT treatment. n = 10 mice per group. c, d, Blood glucose levels (c) and the area under the curve (AUC, d) during intraperitoneal glucose tolerance tests (ipGTT) with 2 g/kg glucose in mice after four weeks of vehicle or IMT treatment. n = 10 mice per group. Data are presented as mean ± SEM. Statistical significance was assessed by a two-way ANOVA with Tukey’s test for multiple comparisons. ∗ indicates a significant difference between HFD IMT and HFD Vehicle; # indicates a significant difference between Chow Vehicle and HFD Vehicle. P values are shown in the figure. e, Serum insulin levels at the 15-min of ipGTT. n = 10 mice per group. f, Ex vivo glucose-stimulated insulin secretion assays performed on isolated pancreatic islets. Glucose (2.8 mM and 16.7 mM) was added to the medium to recapitulate basal and glucose-stimulated insulin secretion conditions. Three independent GSIS assays were performed with three replicates per group. g, Islet insulin content. Three independent GSIS assays were performed with three replicates per group. All data are presented as mean ± SEM. Statistical significance was assessed by a two-way ANOVA with Tukey’s test for multiple comparisons. P values are shown in the figure. Source data
Extended Data Fig. 4
Extended Data Fig. 4. IMT treatment does not change levels of phospholipids and sphingolipids.
Levels of phospholipids and sphingolipids in mouse liver after four weeks of vehicle or IMT treatment. n = 8 mice per group. Source data
Extended Data Fig. 5
Extended Data Fig. 5. Levels of mitochondrial transcripts and mtDNA in different tissues of IMT-treated mice.
a-f, Levels of representative mitochondrial transcripts and mtDNA were measured in tissues of mice on chow diet or HFD treated with vehicle or IMT compound for four weeks. Levels of mtDNA in liver after four weeks of IMT treatment. n = 12 mice per group (a). The mtDNA transcript (b) and mtDNA (c) levels in eWAT. n = 10 mice per group. d, Representative western blot analyses of OXPHOS protein levels in eWAT after four weeks of vehicle or IMT treatment. Subunits of complex I (NDUFB8), complex II (SDHA and SDHB), complex IV (MTCOX1), and complex V (ATP5A) were analysed. VDAC was used as loading control. A representative image of n = 3 independent experiments is shown. The mtDNA transcript, n = 10 mice per group (e) and mtDNA, n = 6 mice per group (f) levels in skeletal muscle. The mtDNA transcript levels in heart (g) and brown adipose tissue (BAT, h). n = 6 mice per group. All data are presented as mean ± SEM. a, e, Statistical significance was assessed by the Mann–Whitney U-test. b, c, f-h, Statistical significance was assessed by a two-way ANOVA with Tukey’s test for multiple comparisons. P values are shown in the figure. Source data
Extended Data Fig. 6
Extended Data Fig. 6. Analysis of the total and mitochondrial proteome.
a, Venn diagram showing number of quantified and significantly changed proteins at a given FDR cutoff. The liver tissue proteome and the proteome of isolated liver mitochondria (Mitoproteome) are shown. b, Principal-component analyses (PCA) of the liver tissue and liver mitochondrial proteomes. c, Hierarchical clustering analysis of the total proteome (ANOVA-significant proteins at FDR < 5%; left) with biological replicates as individual lanes (CV: control vehicle; HV: HFD Vehicle; HIMT: HFD IMT-treated, CIMT: control IMT-treated), z-score normalised fold changes in indicated clusters (middle) with the same sample order as in the heatmap, and significant KEGG terms in each cluster (Fisher exact test at FDR < 5%; right). Source data
Extended Data Fig. 7
Extended Data Fig. 7. IMT treatment rewires OXPHOS.
a, Heatmaps illustrating the protein density of subunits of OXPHOS complexes in mouse liver after four weeks of vehicle or IMT treatment. n = 3 mice per group. b, Representative western blot analyses of OXPHOS protein levels in liver mitochondria after four weeks of vehicle or IMT treatment. Subunits of complex I (NDUFB8), complex II (SDHB), complex III (UQCRC2), complex IV (MTCOX1), and complex V (ATP5A) were analysed. VDAC was used as loading control. A representative image of n = 3 independent experiments is shown. c, Heatmaps depicting the protein density of different mitochondrial OXPHOS assembly factors in mouse liver after four weeks of vehicle or IMT treatment. n = 3 mice per group. Source data
Extended Data Fig. 8
Extended Data Fig. 8. IMT decreases mitoribosomal proteins and rRNAs.
a, Heatmaps depicting the protein density of mitoribosomal proteins in mouse liver after four weeks of vehicle or IMT treatment. n = 3 mice per group. b, The mtDNA-encoded 12S and 16S rRNA transcripts in mouse liver after four weeks of vehicle or IMT treatment. n = 8 mice per group. Data are presented as mean ± SEM. Statistical significance was assessed by a two-way ANOVA with Tukey’s test for multiple comparisons. P values are shown in the figure. Source data
Extended Data Fig. 9
Extended Data Fig. 9. Characterization of liver OXPHOS function.
a, Respiratory chain complex activities normalized to citrate synthase activity in liver mitochondria after four weeks of vehicle or IMT treatment. n = 3 mice per group. The analysed enzyme activities are NADH coenzyme Q reductase (complex I, CI), NADH cytochrome c reductase (complex I/III, CI/III), succinate dehydrogenase (complex II, CII), and cytochrome c oxidase (complex IV, CIV). b, In-gel activities of OXPHOS complexes resolved by BN-PAGE. Digitonin-solubilized liver mitochondria (60 μg) from mice on chow diet or HFD and subjected to vehicle or IMT treatment were resolved by native gel electrophoresis (BN-PAGE). Gels were stained with Coomassie or incubated with substrates for detecting the in-gel activity of the indicated OXPHOS complexes. Complex V subassembly intermediates containing F1 subunits (Vsub) are observed in the IMT-treated subunits. The image is representative of 3 biological replicates from each group. Oxygen consumption rate (OCR) of liver mitochondria in the state 3 with (c) multiple substrates (malate/palmitoylcarnitine, pyruvate/malate/glutamate, succinate and glycerophosphate), (d) malate/palmitoylcarnitine only. c and d, n = 5 mice/group. a, c, and d, data are presented as mean ± SEM. Statistical significance was assessed by a two-way ANOVA with Tukey’s test for multiple comparisons. P values are shown in the figure. Source data
Extended Data Fig. 10
Extended Data Fig. 10. Analysis of the liver metabolites and fasting mouse proteomics correlation.
a, b, Liver proteomics correlation between IMT/vehicle and the fed/fasted mice on chow diet (a) or HFD (b). n = 3 mice per group. c, Fold change in the levels of quinones (Q9 and Q10) in mouse liver after four weeks of vehicle or IMT treatment. Chow Vehicle, Chow IMT and HFD Vehicle n = 8 mice per group, HFD IMT n = 7 mice per group. d, Fold change in nucleotide levels in mouse liver after four weeks of vehicle or IMT treatment. n = 8 mice per group. e, Fold change in amino acid levels in mouse liver after four weeks of vehicle or IMT treatment. Chow Vehicle, Chow IMT and HFD Vehicle n = 8 mice per group, HFD IMT n = 6 mice. f, The ratio of AMP to ATP in mouse liver after four weeks of vehicle or IMT treatment. n = 8 mice per group. c-f, All data are presented as mean ± SEM. c, Statistical significance was assessed by a two-way ANOVA with Tukey’s test for multiple comparisons. d-f, Statistical significance was assessed by the Mann–Whitney U-test. P values are shown in the figure. g, Western blot analyses of the levels of AMPK phosphorylated at T172 (pAMPK(T172)) and ACC1 phosphorylated at (pACC1(S79)). A representative image of n = 2 independent experiments is shown. Source data

References

    1. Fernandez‐Vizarra E, Zeviani M. Mitochondrial disorders of the OXPHOS system. FEBS Lett. 2021;595:1062–1106. doi: 10.1002/1873-3468.13995. - DOI - PubMed
    1. Spinelli JB, Haigis MC. The multifaceted contributions of mitochondria to cellular metabolism. Nat. Cell Biol. 2018;20:745–754. doi: 10.1038/s41556-018-0124-1. - DOI - PMC - PubMed
    1. Martínez-Reyes I, Chandel NS. Mitochondrial TCA cycle metabolites control physiology and disease. Nat. Commun. 2020;11:102. doi: 10.1038/s41467-019-13668-3. - DOI - PMC - PubMed
    1. Heiden MGV, Cantley LC, Thompson CB. Understanding the Warburg effect: the metabolic requirements of cell proliferation. Science. 2009;324:1029–1033. doi: 10.1126/science.1160809. - DOI - PMC - PubMed
    1. Vasan K, Werner M, Chandel NS. Mitochondrial metabolism as a target for cancer therapy. Cell Metab. 2020 doi: 10.1016/j.cmet.2020.06.019. - DOI - PMC - PubMed