. 2024 May;30(5):1373-1383.
doi: 10.1038/s41591-024-02962-3. Epub 2024 Apr 30.

Correlates of protection against symptomatic SARS-CoV-2 in vaccinated children

Affiliations

Correlates of protection against symptomatic SARS-CoV-2 in vaccinated children

Youjia Zhong et al. Nat Med. 2024 May.

Erratum in

Abstract

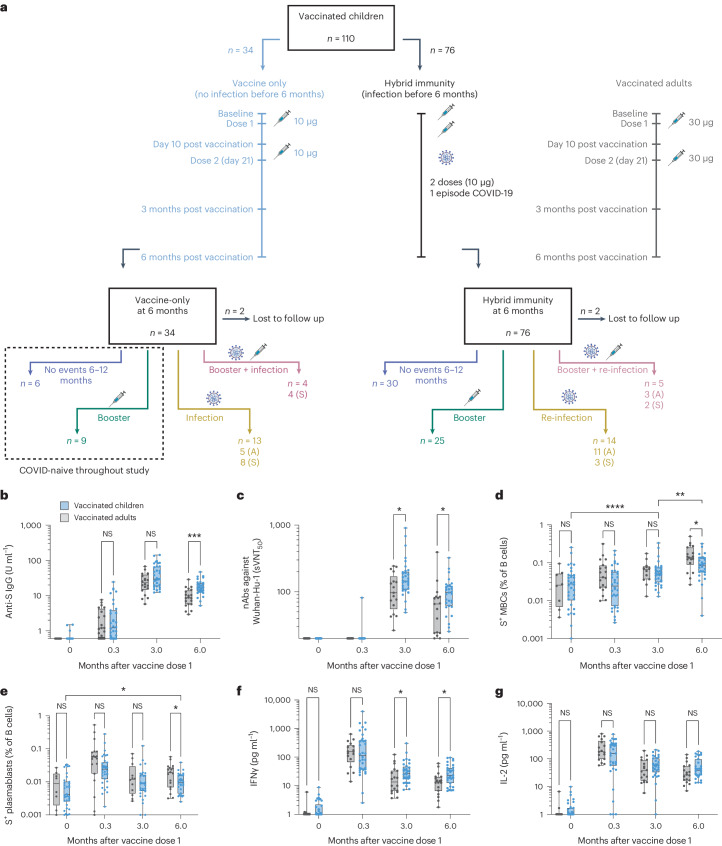
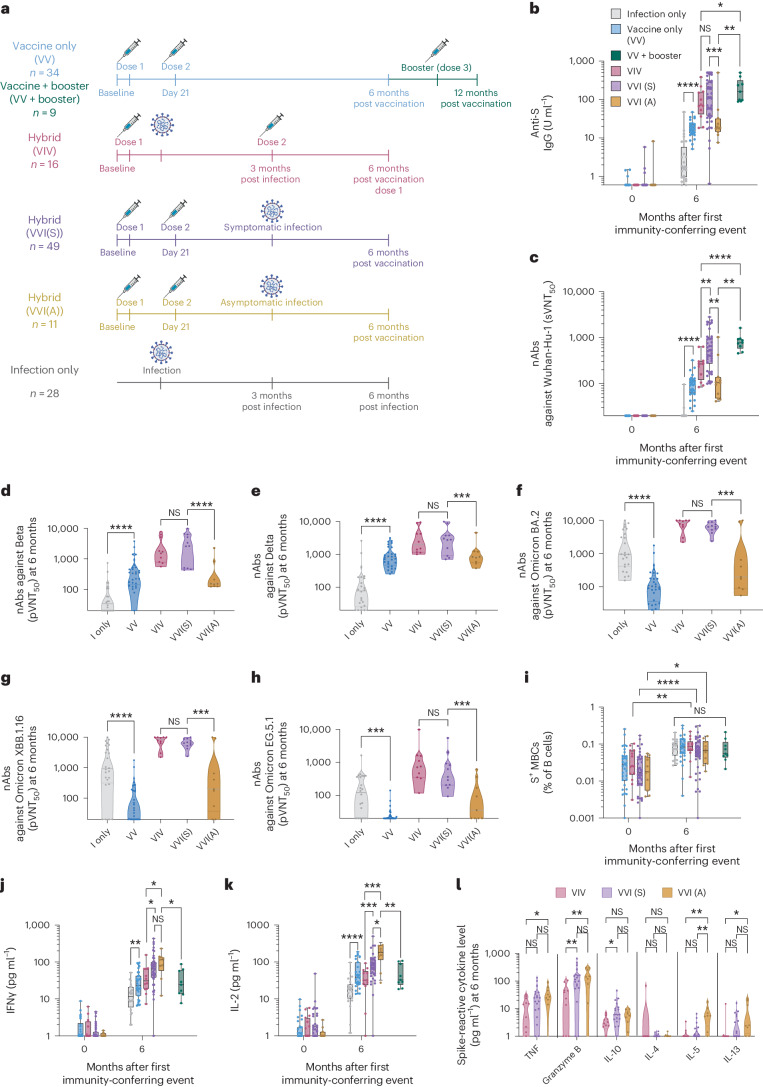
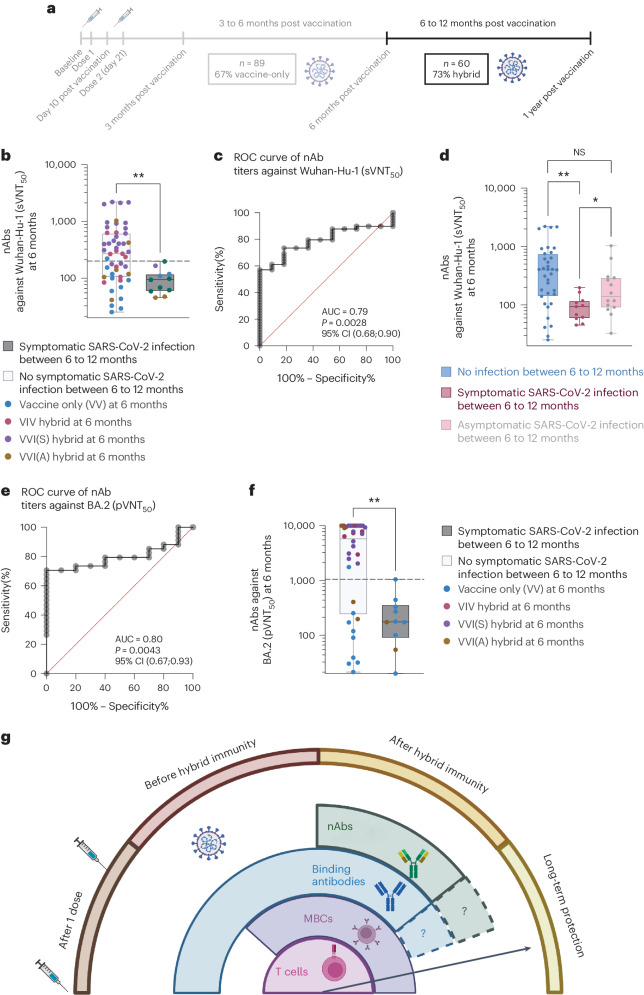
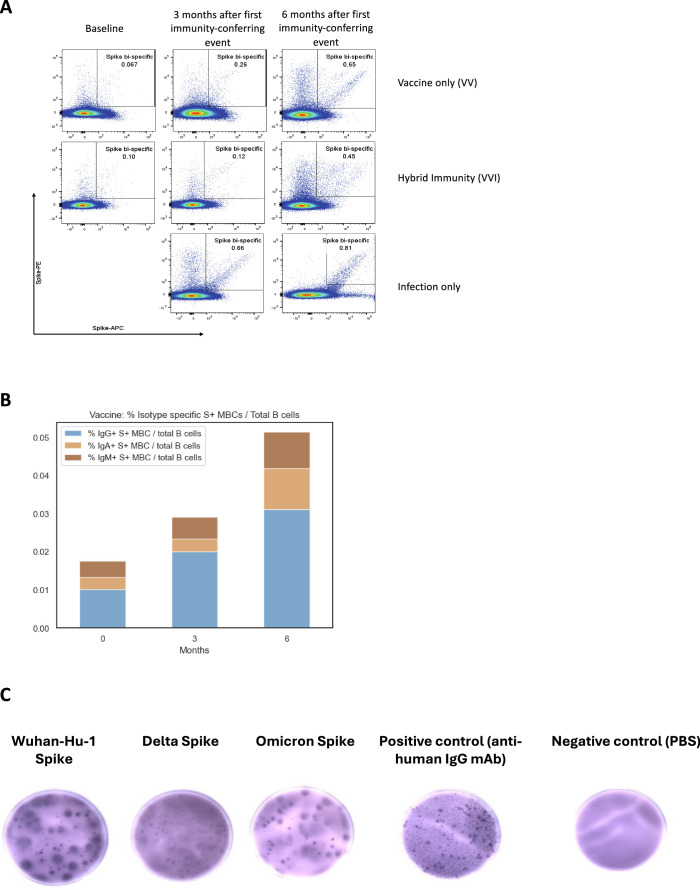
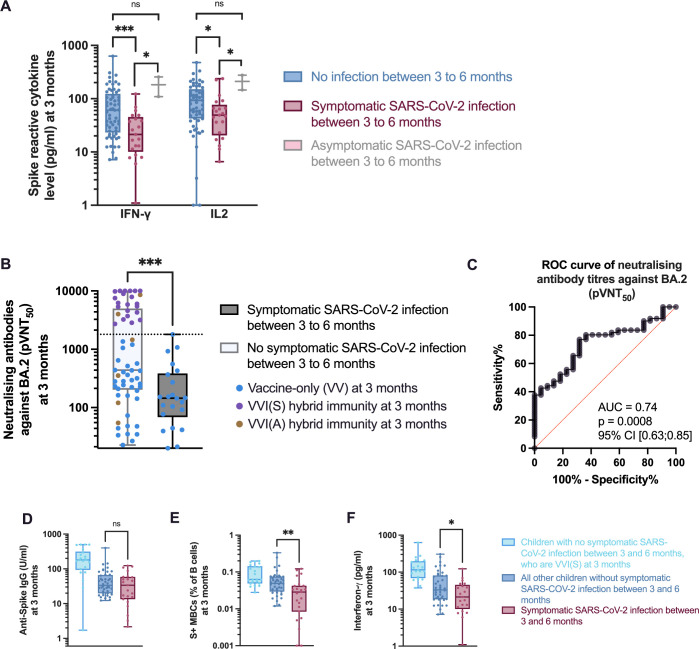
The paucity of information on longevity of vaccine-induced immune responses and uncertainty of the correlates of protection hinder the development of evidence-based COVID-19 vaccination policies for new birth cohorts. Here, to address these knowledge gaps, we conducted a cohort study of healthy 5-12-year-olds vaccinated with BNT162b2. We serially measured binding and neutralizing antibody titers (nAbs), spike-specific memory B cell (MBC) and spike-reactive T cell responses over 1 year. We found that children mounted antibody, MBC and T cell responses after two doses of BNT162b2, with higher antibody and T cell responses than adults 6 months after vaccination. A booster (third) dose only improved antibody titers without impacting MBC and T cell responses. Among children with hybrid immunity, nAbs and T cell responses were highest in those infected after two vaccine doses. Binding IgG titers, MBC and T cell responses were predictive, with T cells being the most important predictor of protection against symptomatic infection before hybrid immunity; nAbs only correlated with protection after hybrid immunity. The stable MBC and T cell responses over time suggest sustained protection against symptomatic SARS-CoV-2 infection, even when nAbs wane. Booster vaccinations do not confer additional immunological protection to healthy children.


Conflict of interest statement

N.L.B. reports a patent for a method to monitor SARS-CoV-2-specific T cells in biological samples, which is pending. The other authors declare no competing interests.

Figures

Fig. 1
Fig. 1. Adaptive immune responses following BNT162b2 vaccination in children aged 5–12 years were comparable or superior to adults despite reduced vaccine dose.
a, Schematic of study schedule for children in the MARkers of Vaccine Efficacy and Longevity in SARS-CoV-2 (MARVELS) study up to 6 months after vaccination, as well as a flowchart of individuals between 6 and 12 months, divided into children with vaccine-only immunity at 6 months (n = 34) and children with hybrid immunity at 6 months (n = 76). Children were given two doses of monovalent 10 μg BNT162b2 on day 0 and day 21 of the study. Venous blood was drawn at pre-vaccination baseline, day 10 after dose one, 3 months after vaccination and 6 months after vaccination. A mirror cohort of healthy adult healthcare workers, who were given two doses of monovalent 30 μg BNT162b2, was used as the reference for immunogenicity parameters. Convenience sampling was used for adults, with 18 to 20 individuals per immunogenicity comparison. Children who acquired natural SARS-CoV-2 infection, both symptomatic and asymptomatic, were excluded from comparison to adults. b, Anti-S IgG titers at pre-vaccination baseline, day 10, 3 months and 6 months after vaccine dose one. c, Antibodies that neutralized 50% of Wuhan-Hu-1 S protein RBD binding to ACE2, as measured using sVNT50. d, Percentage of S+ MBCs out of total B cells. e, Percentage of S-specific plasmablasts out of total B cells. f,g, S-reactive T cell responses measured by post-stimulation IFNγ (f) and IL-2 (g) levels. For box-and-whisker graphs, the top and bottom boundaries of the boxes indicate the upper and lower quartiles, respectively, the line indicates the median and whiskers represent the range. For all panels, a two-tailed Mann–Whitney U-test was used for comparisons between vaccinated children and adults and a Wilcoxon rank test was used for paired comparisons of the same individuals at different time points. NS, not significant, *P ≤ 0.05, **P ≤ 0.01, ***P ≤ 0.001, ****P ≤ 0.0001. The schematic was created in BioRender.com.
Fig. 2
Fig. 2. A booster dose increased antibody titers but had no effect on memory B cell and T cell responses for SARS-CoV-2-naive children.
n = 6 vaccine-only children had no events between 6 and 12 months, whereas n = 9 children received a booster between 6 and 12 months. a,b, Anti-S IgG (a) and sVNT50 (b) titers at pre-vaccination baseline and day 10, 3 months and 6 months after vaccine dose one for SARS-CoV-2-naive children who received two or three doses of BNT162b2 over 1 year. c,d, Antibody titers that neutralized 50% of SARS-CoV-2 variants of concern (VOCs), quantified using pVNT50 in children without (c) and with (d) booster vaccination. e, Percentage of S+ MBCs out of total B cells in children with and without booster. f,g, S-reactive T cell responses measured by post-stimulation IFNγ (f) and IL-2 (g) levels in children with and without booster. For box-and-whisker graphs, the top and bottom boundaries of boxes indicate the upper and lower quartiles, respectively, the line indicates the median and whiskers represent the range. For all panels, a two-tailed Mann–Whitney U-test was used for comparisons between children who received two doses and those who received three doses (with booster) and a Wilcoxon rank test was used to compare parameters of the same individuals at 6 and 12 months. NS, not significant, *P ≤ 0.05, **P ≤ 0.01, ***P ≤ 0.001, ****P ≤ 0.0001.
Fig. 3
Fig. 3. Superiority of the adaptive immune parameters in children who acquired hybrid immunity within 6 months post-vaccination compared to vaccination or infection alone.
a, Schematic representation. A total of 110 children received two doses of 10 μg monovalent BNT162b2 at day 0 and day 21, and 28 unvaccinated children were naturally infected during a period when Omicron subvariants were dominant in the community. Of the vaccinated children, 34 had immunity conferred only by two doses of vaccine by 6 months (VV). Sixteen children had one dose of vaccine, followed by natural infection, followed by dose two 3 months later, which was given after the 3-month venepuncture (VIV). Sixty children had two doses of vaccine followed by a natural infection either before or after the 3-month venepuncture (VVI). S, symptomatic (n = 49); A, asymptomatic (n = 11). Twenty-eight unvaccinated children, who naturally acquired symptomatic SARS-CoV-2 infection, were used for comparison. The immunological parameters at 12 months of the VV children who received a booster but did not acquire infection between 6 and 12 months are displayed as VV + booster (n = 9). b, Anti-S IgG titers at pre-vaccination baseline and 6 months after the first immunity-conferring event. ch, sVNT50 titers against Wuhan-Hu-1 (c) and pVNT50 titers against SARS-CoV-2 Beta (d), Delta (e), Omicron BA.2 (f), Omicron XBB.1.16 (g) and Omicron EG.5.1 (h) variants, at month 6. i, Percentage of S+ MBCs out of total B cells. j,k, S-reactive T cell responses measured by post-stimulation IFNγ (j) and IL-2 (k) levels. l, Concentration of indicated cytokines secreted in the 8-cytokine release assay for S-reactive T cell responses from children VIV, VVI(S) and VVI(A). For box-and-whisker graphs, the top and bottom boundaries of the boxes indicate upper and lower quartiles, respectively, the line indicates the median and whiskers represent the range. A two-tailed Mann–Whitney U-test was used to compare two groups. A Kruskal–Wallis H test was used to compare all groups for S+ MBC. NS, not significant, *P ≤ 0.05, **P ≤ 0.01, ***P ≤ 0.001, ****P ≤ 0.0001. The schematic was created in BioRender.com.
Fig. 4
Fig. 4. A booster dose had minimal effects on adaptive immune responses in children with hybrid immunity.
n = 30 children with hybrid immunity had no events between 6 and 12 months, whereas n = 25 children received a booster between 6 and 12 months. a,b, Anti-S IgG (a) and sVNT50 titers (b) at pre-vaccination baseline and day 10, 3 months and 6 months after vaccine dose one, for children who developed hybrid immunity by month 6 and were not re-infected thereafter, with or without a booster dose. c, PVNT50 titers against SARS-CoV-2 variants at 12 months from start of vaccination. d, Percentage of S+ MBCs out of total B cells. e,f, Levels of S-reactive T cell responses measured by post-stimulation IFNγ (e) and IL-2 (f). For box-and-whisker graphs, the top and bottom boundaries of the boxes indicate the upper and lower quartiles, respectively, the line indicates the median and whiskers represent the range. For all panels, a two-tailed Mann–Whitney U-test was used for comparisons between children who received two doses and those who received three doses (with booster) and a Wilcoxon rank test was used to compare parameters of the same individuals at 6 and 12 months. NS, not significant, *P ≤ 0.05, **P ≤ 0.01, ***P < 0.001, ****P < 0.0001.
Fig. 5
Fig. 5. Anti-S IgG S+ MBCs and T cell responses are correlates of protection against symptomatic SARS-CoV-2 infection before hybrid immunity.
n = 23 children had symptomatic SARS-CoV-2 infection between months 3 and 6, whereas n = 66 did not. a, Timeline showing time intervals during which vaccine-elicited immune parameters were analyzed against symptomatic SARS-CoV-2 infection. be, 3-month anti-S IgG titers (b), sVNT50 titers against Wuhan-Hu-1 (c), percentage of S+ MBCs out of total B cells (d) and S-reactive T cell responses (e) measured by post-stimulation IFNγ and IL-2 levels, in children who did or did not develop symptomatic SARS-CoV-2 infection between 3 and 6 months. For box-and-whisker graphs, the top and bottom boundaries of the boxes indicate upper and lower quartiles, respectively, the line indicates the median and whiskers represent the range. A two-tailed Mann–Whitney U-test was used to compare groups. NS, not significant, *P < 0.05, **P < 0.01, ***P < 0.001, ****P < 0.0001. fk, ROC curve for anti-S IgG titers (f), sVNT50 titers (g), S+ MBCs (h), IFNγ (i), S+ MBCs and IFNγ combined (j) and S+ MBCs, IFNγ and anti-S IgG combined (k), with all parameters measured at 3 months from the start of vaccination. The ROC curve analysis was performed using the Wilson/Brown test. The timeline was created in BioRender.com.
Fig. 6
Fig. 6. nAb titers correlate with protection against symptomatic SARS-CoV-2 infection when prevalence of hybrid immunity was high.
n = 11 children had symptomatic SARS-CoV-2 infection between 6 and 12 months, whereas n = 49 children did not; of these, n = 14 had asymptomatic SARS-CoV-2 infection. a, Timeline showing time interval of analysis. b, 6-month sVNT50 titers against Wuhan-Hu-1 in children who did or did not develop symptomatic SARS-CoV-2 infection between 6 and 12 months. c, ROC for sVNT50 measured at 6 months from the start of vaccination. d, 6-month sVNT50 titers in children who had no infection, symptomatic and asymptomatic SARS-CoV-2 infection between 6 and 12 months. e, ROC for Omicron BA.2 pVNT50 measured at 6 months from the start of vaccination. f, 6-month Omicron BA.2 pVNT50 titers in children who did and did not develop symptomatic SARS-CoV-2 infection between 6 and 12 months, differentiated by the type of pre-existing immunity that they had at month 6. For box-and-whisker graphs, the top and bottom boundaries of boxes indicate the upper and lower quartiles, respectively, the line indicates the median and whiskers represent the range. A two-tailed Mann–Whitney U-test was used to compare groups. The ROC curve analysis was performed using the Wilson/Brown test. NS, not significant, *P < 0.05, **P < 0.01, ***P < 0.001, ****P < 0.0001. g, ‘Onion model’ of immune correlates of protection. The timeline and ‘onion model’ were created in BioRender.com.
Extended Data Fig. 1
Extended Data Fig. 1. Isotypes and binding activity of Spike-specific memory B cells (S + MBC) in children with immunity against SARS-CoV-2.
A. Representative flow cytometric staining plots for vaccine-only (VV), hybrid (VVI), and infection-only immunity (n = 1 each). B. S + MBC isotypes in children with vaccine-only immunity (n = 34), at pre-vaccination baseline, and 3- and 6 months post vaccination. C. Binding activity against Spike proteins from three SARS-CoV-2 variants in B cell ELISPOT. Spike-specific memory B cells (S+ MBCs) were extracted from a pediatric subject 3 months after 2 doses of mRNA BNT162b2, and then cultured and differentiated ex vivo into antibody secreting cells.
Extended Data Fig. 2
Extended Data Fig. 2. Children vaccinated with 2 doses of mRNA SARS-CoV-2 vaccine have low levels of Th2 cytokines (n = 34).
A, B, C. Spike-reactive Th2 responses, measured by interleukin-4, interleukin-5 and interleukin-13 for children with vaccine-only immunity, and adults. For box-whisker graphs, upper and lower boundaries of boxes indicate upper and lower quartile respectively, line indicates median, and whiskers represent the range.
Extended Data Fig. 3
Extended Data Fig. 3. Vaccine-associated local and systemic adverse events and symptoms of SARS-CoV-2 infection reported by MARVELS children.
A. Percentages and severity of parent and / or subject – reported local and systemic symptoms for 10 days after vaccination. Blue = adverse events after doses 1 and 2, with color gradient representing spectrum of severity; Red = adverse events after booster (dose 3), with color gradient representing spectrum of severity. B. Clinical features of symptomatic SARS-CoV-2 infections for all episodes of symptomatic SARS-CoV-2 infection among vaccinated children. Two-tailed Fisher’s exact test was used for comparison between groups; ns: not significant, *: p ≤ 0.05, **: p ≤ 0.01, ***: p ≤ 0.001, ****: p ≤ 0.0001. For pain at injection site, p-value = 0.0189. For fever, p-value = 0.0091.
Extended Data Fig. 4
Extended Data Fig. 4. Nucleocapsid (N)-specific antibodies and T cells in children with asymptomatic SARS-CoV-2 infections.
A. Venn diagram showing all episodes of asymptomatic COVID-19 identified in this study (n = 30), separated into whether they were identified via seropositivity, T cell reactivity, or both against SARS-CoV-2 N protein. B, C. N-reactive T cell responses measured by post-stimulation interferon-γ and interleukin-2 levels, at pre-vaccination baseline, 3- and 6 months post vaccination, from vaccinated (two doses) children who remained uninfected (VV, n = 34), with symptomatic infection (VVI(S), n = 49) and asymptomatic infection (VVI(A), n = 11). D. N-reactive T cell responses measured by post-stimulation interferon-γ and E. interleukin-2 levels, at 6- and 12 months post vaccination, for VV children at 6 months. F. N-reactive T cell responses measured by post-stimulation interferon-γ and G. interleukin-2 levels, at 6- and 12 months post vaccination, for children with hybrid immunity at 6 months. In D-G, children were grouped into the following categories: 1) Those who did not develop SARS-CoV-2 infection between 6 and 12 months, 2) those who developed symptomatic SARS-CoV-2 re-infection (S), or 3) those who had asymptomatic re-infection. In all graphs, subjects with serological evidence of asymptomatic SARS-CoV-2 are colored in blue.
Extended Data Fig. 5
Extended Data Fig. 5. The proximity of last immunity-boosting event is similar for children who had symptomatic SARS-CoV-2 infection between doses 1 and 2 (VIV), and children who had symptomatic SARS-CoV-2 infection after 2 doses (VVI(S)).
A. Schematic representation of the different last immunity-boosting event, for VIV and VVI(S) children. Created with BioRender.com. B. Comparison of proximity of immunity-boosting event for VIV and VVI(S) children. For box-whisker graphs, upper and lower boundaries of boxes indicate upper and lower quartile respectively, line indicates median, and whiskers represent the range. Two-tailed Mann–Whitney U test was used for comparison between groups; ns: not significant, *: p ≤ 0.05, **: p ≤ 0.01, ***: p ≤ 0.001, ****: p ≤ 0.0001.
Extended Data Fig. 6
Extended Data Fig. 6. Eight-cytokines measured in the cytokine release assay for Spike-reactive T cell responses among children with hybrid immunity.
A. Schematic of cytokine release assay and analytical methods (after DMSO control subtraction) using unsupervised clustering algorithm (UMAP). The cytokines quantified were interferon-γ (IFN-γ), interleukin-2 (IL-2), tumor necrosis factor-α (TNF-α), Granzyme-B, interleukin-10 (IL-10), interleukin-4 (IL-4), interleukin-5 (IL-5), and interleukin-13 (IL-13). B. UMAP plots generated with all analyzed samples (n = 391, consisting of adults, infected children and vaccinated children at all time points) with levels of secreted cytokines shown in heatmaps. C. Concatenated cytokine secretion profiles of S peptide pool-stimulated whole blood from children with VIV, VVI(S) and VVI(A). Cytokine secretion profiles were overlaid on the global UMAP plot of all analyzed samples (black dots; each dot corresponds to one culture supernatant).
Extended Data Fig. 7
Extended Data Fig. 7. Immune correlates of protection against symptomatic SARS-CoV-2 infection between 3- and 6 months from start of vaccination.
N = 23 children had symptomatic SARS-CoV-2 infection between months 3 and 6, while n = 66 did not; of these, n = 3 had asymptomatic SARS-CoV-2 infection. A. 3-month Spike (S)-reactive T cell responses, quantified using interferon- γ (IFN-γ) and interleukin-2 (IL-2), for children with no infection, symptomatic and asymptomatic SARS-CoV-2 infection between 3 and 6 months. For comparison between no infection and symptomatic infection, p-value for IFN-γ = 0.000688 and for IL-2 = 0.025786. For comparison between symptomatic infection and asymptomatic infection, p-value for IFN-γ = 0.015810 and for IL-2 = 0.031621. B. 3-month Omicron BA.2 pVNT50 titers in children who did and did not develop symptomatic SARS-CoV-2 infection between 3 and 6 months. Color of dots indicate the type of pre-existing immunity they had at month 3 (p-value = 0.000589). C. Receiver operator characteristics (ROC) curve for BA.2 measured at 3 months from start of vaccination. D. pVNT50 titers Anti-S IgG titers, E. Percentage of S+ MBCs out of total B cells (p-value 0.004599), and F. S-reactive T cell responses measured by post-stimulation interferon-γ levels at month 3 post-vaccination (p-value 0.047200), for VVI(S) and non-VVI(S) children with and without symptomatic SARS-CoV-2 infection. For box-whisker graphs, upper and lower boundaries of boxes indicate upper and lower quartile respectively, line indicates median, and whiskers represent the range. Two-tailed Mann–Whitney U test was used to compare between groups. The ROC curve analysis was performed using the Wilson/Brown test. ns: not significant, *: p ≤ 0.05, **: p ≤ 0.01, ***: p ≤ 0.001, ****: p ≤ 0.0001.
Extended Data Fig. 8
Extended Data Fig. 8. Protection from symptomatic SARS-CoV-2 infection was associated with hybrid immunity but not age.
A. Superior protective capacity of hybrid immunity, demonstrated by the different in percentages of children who developed symptomatic SARS-CoV-2 infection between 6 and 12 months, among children with vaccine-only (VV) immunity at 6 months, compared to children with hybrid immunity at 6 months. Two-tailed Fisher’s exact test was used for comparison between groups. P-value = 0.0018. B, C. Symptomatic SARS-CoV-2 infection was not associated with age, as demonstrated by B. age distribution of all children getting their first infection after 2 doses of mRNA vaccination (n = 57 symptomatic, n = 16 asymptomatic), and C. age distribution of all children with hybrid immunity getting a re-infection (n = 3 symptomatic and n = 11 asymptomatic). For box-whisker graphs, upper and lower boundaries of boxes indicate upper and lower quartile respectively, line indicates median, and whiskers represent the range. Two-tailed Mann–Whitney U test was used to compare between different groups. ns: not significant, *: p ≤ 0.05, **: p ≤ 0.01, ***: p ≤ 0.001, ****: p ≤ 0.0001.

References

    1. World Health Organization. Interim statement on hybrid immunity and increasing population seroprevalence rates. https://www.who.int/news/item/01-06-2022-interim-statement-on-hybrid-imm... (2022).
    1. Goldblatt D, Alter G, Crotty S, Plotkin SA. Correlates of protection against SARS-CoV-2 infection and COVID-19 disease. Immunol. Rev. 2022;310:6–26. doi: 10.1111/imr.13091. - DOI - PMC - PubMed
    1. Khoury DS, et al. Neutralizing antibody levels are highly predictive of immune protection from symptomatic SARS-CoV-2 infection. Nat. Med. 2021;27:1205–1211. doi: 10.1038/s41591-021-01377-8. - DOI - PubMed
    1. Wherry EJ, Barouch DH. T cell immunity to COVID-19 vaccines. Science. 2022;377:821–822. doi: 10.1126/science.add2897. - DOI - PubMed
    1. Bertoletti A, Le Bert N, Tan AT. SARS-CoV-2-specific T cells in the changing landscape of the COVID-19 pandemic. Immunity. 2022;55:1764–1778. doi: 10.1016/j.immuni.2022.08.008. - DOI - PMC - PubMed

MeSH terms