. 2024 May;30(5):1481-1488.
doi: 10.1038/s41591-024-02959-y. Epub 2024 Apr 30.

Vision-language foundation model for echocardiogram interpretation

Affiliations

Vision-language foundation model for echocardiogram interpretation

Matthew Christensen et al. Nat Med. 2024 May.

Abstract

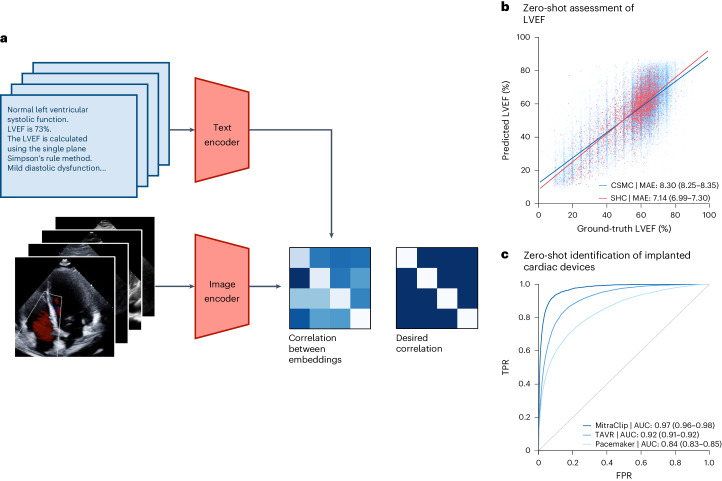
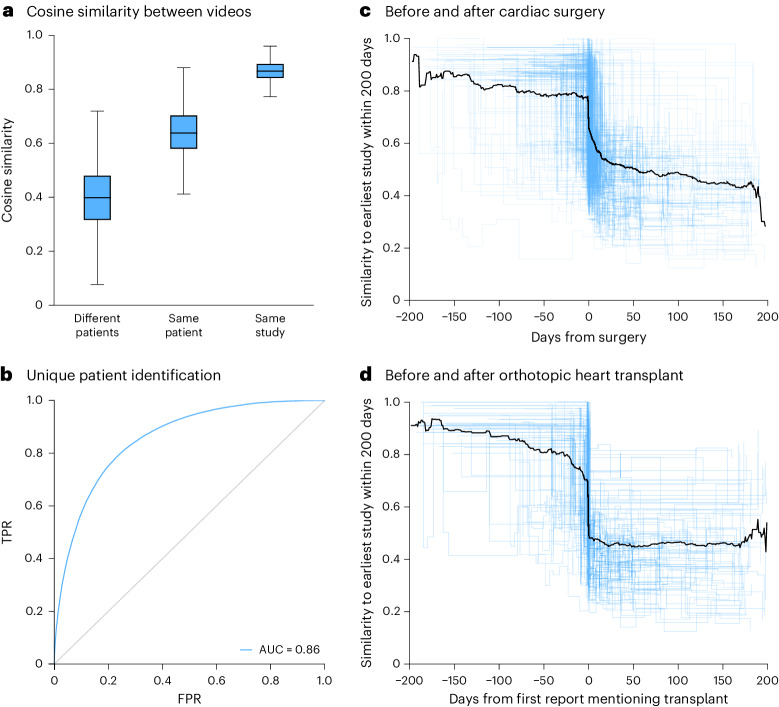
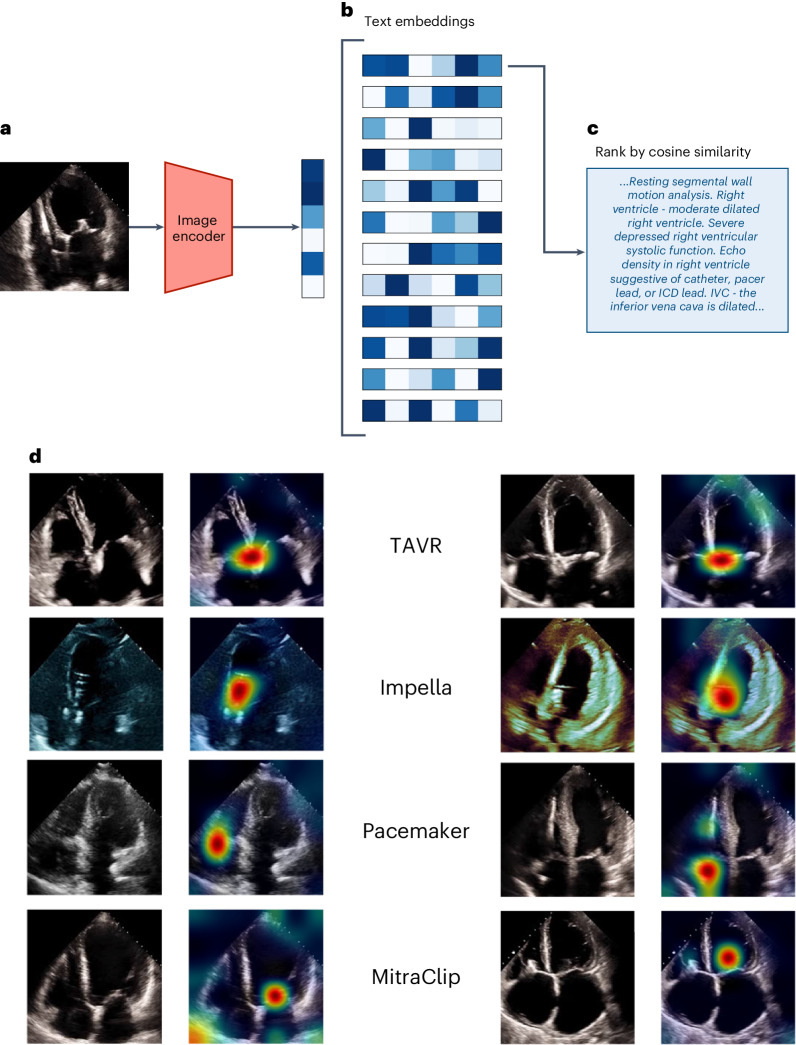
The development of robust artificial intelligence models for echocardiography has been limited by the availability of annotated clinical data. Here, to address this challenge and improve the performance of cardiac imaging models, we developed EchoCLIP, a vision-language foundation model for echocardiography, that learns the relationship between cardiac ultrasound images and the interpretations of expert cardiologists across a wide range of patients and indications for imaging. After training on 1,032,975 cardiac ultrasound videos and corresponding expert text, EchoCLIP performs well on a diverse range of benchmarks for cardiac image interpretation, despite not having been explicitly trained for individual interpretation tasks. EchoCLIP can assess cardiac function (mean absolute error of 7.1% when predicting left ventricular ejection fraction in an external validation dataset) and identify implanted intracardiac devices (area under the curve (AUC) of 0.84, 0.92 and 0.97 for pacemakers, percutaneous mitral valve repair and artificial aortic valves, respectively). We also developed a long-context variant (EchoCLIP-R) using a custom tokenizer based on common echocardiography concepts. EchoCLIP-R accurately identified unique patients across multiple videos (AUC of 0.86), identified clinical transitions such as heart transplants (AUC of 0.79) and cardiac surgery (AUC 0.77) and enabled robust image-to-text search (mean cross-modal retrieval rank in the top 1% of candidate text reports). These capabilities represent a substantial step toward understanding and applying foundation models in cardiovascular imaging for preliminary interpretation of echocardiographic findings.


Conflict of interest statement

The authors declare no competing interests.

Figures

Fig. 1
Fig. 1. EchoCLIP workflow.
a, EchoCLIP is a foundation model trained on more than 1 million echocardiogram videos across 11 years. It is composed of an image encoder for processing echocardiogram video frames and a text encoder for processing the corresponding physician interpretations. These two encoders project the images and interpretations onto a joint embedding space. b, Scatter-plot of zero-shot prediction versus label of left ventricular ejection fraction (LVEF) in held-out test dataset from Cedars-Sinai Medical Center (CSMC; blue, n = 100,994) and Stanford Healthcare (SHC; red, n = 5,000). c, AUC performance for various implanted intracardiac devices, including MitraClip, TAVR valves and implanted pacemaker/defibrillator on held-out test dataset from Cedars-Sinai Medical Center. FPR, false positive rate; TPR, true positive rate.
Fig. 2
Fig. 2. Zero-shot model performance on held-out test apical-four-chamber videos.
a, Estimation of pulmonary artery pressure (PAP). b, Heart failure (HF) with reduced ejection fraction. c, Assessment of left ventricular hypertrophy at various degrees of severity (mild, moderate and severe). d, Left atrial dilation at various degrees of severity (mild, moderate and severe). e, Left ventricular dilation at various degrees of severity (mild, moderate and severe). f, Assessment of pericardial effusion size (small, moderate and large) as well as presence of tamponade physiology. Data are from the Cedars-Sinai Medical Center (CSMC; blue, n = 100,994) and Stanford Healthcare (SHC; red, n = 5,000). FPR, false positive rate; TPR, true positive rate.
Fig. 3
Fig. 3. Assessment of clinical similarity.
a, Average cosine similarity between embeddings from different patients, same patients at different times and same patients at the same time point. Center lines indicate the median, boxes span from the first to the third quartile and whiskers stretch 1.5 × the interquartile range (n = 100,994). b, AUC for predicting whether the images come from the same patient when compared to another image (n = 100,994). c,d, Trajectory of individual patients by cosine similarity (n = 2,959). Each line represents an individual patient with time from major clinical event on the x axis and cosine similarity versus first study on the y axis. Patients either had major cardiac surgery (c) or heart transplant (d), with cosine similarity calculated at the study level and pairwise compared for all videos in each study. Data are from the Cedars-Sinai Medical Center. FPR, false positive rate; TPR, true positive rate.
Fig. 4
Fig. 4. Image-to-text semantic search.
a, The query image is first embedded using EchoCLIP-R’s image encoder. b, Then, the similarities between this query embedding and the embeddings of all 21,484 unique text reports in the test set are computed. c, The reports are ranked by their similarity to the query image embedding and the report with the highest similarity is retrieved. d, Corresponding pairs of input frames and PromptCAM visualization of the indicated intracardiac devices in the text report label (color intensity ranging from red for most important to green for less important and no color for not important).
Extended Data Fig. 1
Extended Data Fig. 1. Frame level ensembling.
(a) Distribution of EchoCLIP left ventricular ejection fraction (LVEF) from individual frames of an echocardiogram video, which are averaged to (b) a video-level distribution of LVEF prediction. (c) Scatter-plot of subset of test dataset (n = 1,000 predictions from 100 videos and 10 frames per video) representing predicted vs. ground-truth LVEF. Each point represents the final predicted values and whiskers represent the range of frame level predictions for that video.

Similar articles

Cited by

References

    1. Heidenreich PA, et al. 2022 AHA/ACC/HFSA guideline for the management of heart failure: executive summary: a report of the American College of Cardiology/American Heart Association Joint Committee on Clinical Practice Guidelines. Circulation. 2022;145:e876–e894. - PubMed
    1. Al-Khatib SM, et al. 2017 AHA/ACC/HRS guideline for management of patients with ventricular arrhythmias and the prevention of sudden cardiac death: executive summary: a report of the American College of Cardiology/American Heart Association Task Force on Clinical Practice Guidelines and the Heart Rhythm Society. Circulation. 2018;138:e210–e271. - PubMed
    1. Wilcox JE, Fang JC, Margulies KB, Mann DL. Heart failure with recovered left ventricular ejection fraction: JACC Scientific Expert Panel. J. Am. Coll. Cardiol. 2020;76:719–734. doi: 10.1016/j.jacc.2020.05.075. - DOI - PubMed
    1. Dunlay SM, Roger VL, Redfield MM. Epidemiology of heart failure with preserved ejection fraction. Nat. Rev. Cardiol. 2017;14:591–602. doi: 10.1038/nrcardio.2017.65. - DOI - PubMed
    1. Ouyang D, et al. Video-based AI for beat-to-beat assessment of cardiac function. Nature. 2020;580:252–256. doi: 10.1038/s41586-020-2145-8. - DOI - PMC - PubMed

MeSH terms