. 2024 May;30(5):1339-1348.
doi: 10.1038/s41591-024-02963-2. Epub 2024 Apr 30.

Microbiome confounders and quantitative profiling challenge predicted microbial targets in colorectal cancer development

Affiliations

Microbiome confounders and quantitative profiling challenge predicted microbial targets in colorectal cancer development

Raúl Y Tito et al. Nat Med. 2024 May.

Abstract

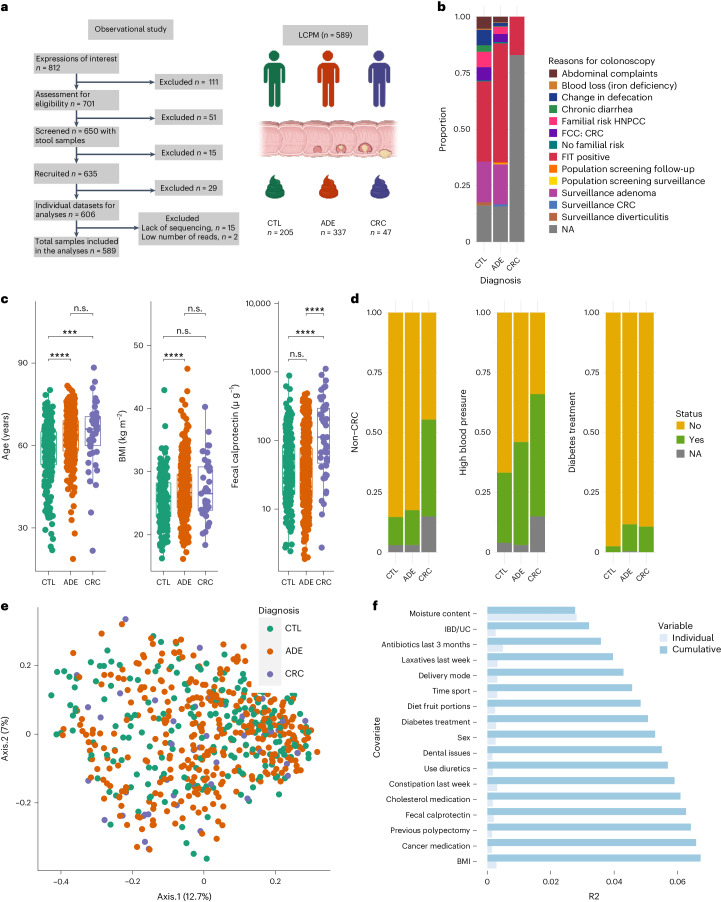
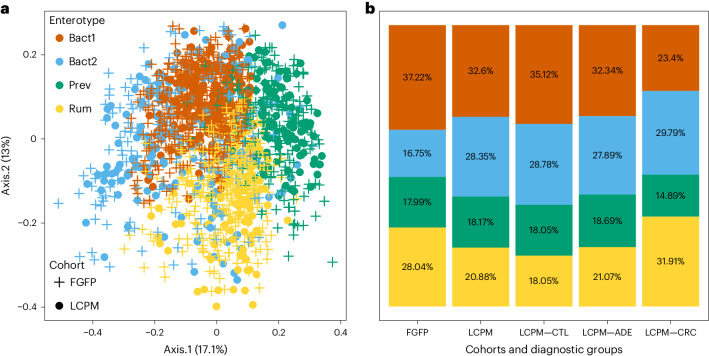
Despite substantial progress in cancer microbiome research, recognized confounders and advances in absolute microbiome quantification remain underused; this raises concerns regarding potential spurious associations. Here we study the fecal microbiota of 589 patients at different colorectal cancer (CRC) stages and compare observations with up to 15 published studies (4,439 patients and controls total). Using quantitative microbiome profiling based on 16S ribosomal RNA amplicon sequencing, combined with rigorous confounder control, we identified transit time, fecal calprotectin (intestinal inflammation) and body mass index as primary microbial covariates, superseding variance explained by CRC diagnostic groups. Well-established microbiome CRC targets, such as Fusobacterium nucleatum, did not significantly associate with CRC diagnostic groups (healthy, adenoma and carcinoma) when controlling for these covariates. In contrast, the associations of Anaerococcus vaginalis, Dialister pneumosintes, Parvimonas micra, Peptostreptococcus anaerobius, Porphyromonas asaccharolytica and Prevotella intermedia remained robust, highlighting their future target potential. Finally, control individuals (age 22-80 years, mean 57.7 years, standard deviation 11.3) meeting criteria for colonoscopy (for example, through a positive fecal immunochemical test) but without colonic lesions are enriched for the dysbiotic Bacteroides2 enterotype, emphasizing uncertainties in defining healthy controls in cancer microbiome research. Together, these results indicate the importance of quantitative microbiome profiling and covariate control for biomarker identification in CRC microbiome studies.


Conflict of interest statement

J.A. and J. Reumers are employees of Janssen Pharmaceutica NV. J. Raes and R.T. are inventors on the patent application WO2017109059A1 in the name of VIB VZW, Katholieke Universiteit Leuven, KU Leuven R&D and Universiteit Gent covering methods for detecting the presence or assessing the risk of development of inflammatory arthritis disease. J. Raes, S.V.S. and G.F. are inventors on the patent application PCT/EP2018/084920 in the name of VIB VZW, KAtholieke Universiteit Leuven, KU Leuven Research and Development and Vrije Universiteit Brussel covering microbiome features associated with inflammation described in Vieira-Silva et al. Nature Microbiology 2019. The other authors declare no competing interests.

Figures

Fig. 1
Fig. 1. The LCPM cohort and gut microbiota covariates in CRC progression.
a, STROBE flowchart and cohort size. CTL represents patients without colonic lesions, ADE denotes patients with colonic polyps and CRC refers to patients with colorectal tumors (generated in BioRender.com). b, Colonoscopy referral reasons for patients of the LCPM cohort: positive FIT, adenoma surveillance, familial risk cancer (FCC), hereditary nonpolyposis CRC (HNPCC) and changes in defecation. NA, denotes the proportion of patients without information. c, Age, BMI and calprotectin are associated with diagnosis groups. The patients without lesions were younger (n = 589, two-sided KW test χ2 = 35.77, adjusted P = 2.6 × 10−7; phD tests) and had lower BMI (n = 553, two-sided KW test χ2 = 15.73, adjusted P = 1.9 × 10−3; phD tests), while patients with tumors had higher fecal calprotectin levels (n = 583, two-sided KW test χ2 = 29.43, adjusted P = 3.0 × 10−6; phD tests, adjusted ***P <0.001, **P <0.01, *P <0.05 and n.s., non-significant P > 0.05; Supplementary Table 3). The box plot center represents the median value whiskers extend from the quartiles to the last data point within 1.5 times of the interquartile range, with outliers beyond. d, Previous non-CRC cancer, high blood pressure and diabetes treatment are associated with the distribution of diagnosis groups. The patients with CRC have a higher proportion of previous cancer (47.5% versus 15.0 % and 12.1%, two-sided CS test, CV effect size of 0.24, χ2 = 31.65, d.f. of 2, adjusted P = 1.98 × 10−2) and high blood pressure (60.0% versus 44.3% and 30.5%, CV of 0.17, two-sided CS test, χ2 = 16.55, d.f. of 2, adjusted P = 1.98 × 10−2) while the CTL group has the lowest proportion of patients with diabetes treatment (2.4% versus 10.3 and 10.6, two-sided CV effect size of 0.15, CS test, χ2 = 13.79, d.f. of 2, adjusted P = 1.98 × 10−2). e, PCoA on BCD representing QMP species-level microbiota variation in the LCPM cohort (n = 589), PCoA1 (Axis.1) and PCoA2 (Axis.2) respectively explained 12.7% and 7% of the variance. Each dot represents one sample, colored by assigned diagnosis group. f, Cumulative effect sizes of significant covariates on microbiota community variation (cumulative bars; stepwise dbRDA on BCD) as compared to individual effect sizes (R2) assuming covariate independence in the LCPM cohort (n = 589; Supplementary Table 5). UC, ulcerative colitis. Source data
Fig. 2
Fig. 2. Microbial biomarkers in CRC progression.
a, Nine species were identified with differential absolute abundance across diagnosis groups (n = 589, KW test, adjusted P < 0.05; Supplementary Table 7). b, Ten species were identified with differential relative abundance across diagnosis groups (n = 589, KW test, adjusted P < 0.05; Supplementary Table 7). The center of the box plot represents the median value of the data, and the whiskers extend from the quartiles to the last data point within 1.5 times of the interquartile range, with outliers beyond. The blue circles represent the mean. c, Biomarkers associations and their confounders. Species Spearman’s rank correlation with calprotectin levels and moisture proportions using QMP (first rho column panel) and RMP (second rho column panel) data. The effect size of the associations between species and calprotectin, moisture and diagnosis variables for QMP and RMP (n = 589, Spearman’s rank correlation comparison, adjusted P < 0.05). Significant associations were tested using two-sided KW tests for QMP and RMP data and ANOVA for CLR data. The associations for Harryflintia acetispora, Parvimonas micra and Prevotella intermedia are sensitive to bias by the extreme values (absolute abundance) in the higher range. Removing these values leads to loss of significance. As rank-based approaches were used, it is not clear if this loss is due to the strength of the signal or the loss of power. Source data
Fig. 3
Fig. 3. BMI, intestinal inflammation and moisture correlations with microbial biomarkers and CRC.
a,b, Species (a) and genera (b) previously reported in association with CRC (blue and green represent enrichment or depletion; the squares indicate reported in corresponding publications, while circles represent our reanalysis of the MetaPhlAn 3.0 profiles generated from the curatedMetagenomicData of these cohorts using the statistical part of our pipeline). Graphic representation of Spearman’s rank correlation of pairwise analysis of fecal calprotectin, BMI, and moisture values against absolute species abundance (QMP) and RMP from the LCPM (N = 589) and FGFP (N = 1,045) cohorts (adjusted P < 0.05, Supplementary Table 8). The species enriched or depleted in relation to CRC diagnosis groups were tested using QMP, CLR and RMP data before (n = 589, two-sided KW test and Spearman’s rank correlation comparison, adjusted P < 0.05) and after controlling for microbiota covariates (before adjustment for BMI, calprotectin and moisture; generalized linear model ANOVA, adjusted P < 0.05). Source data
Fig. 4
Fig. 4. The Bact2 enterotype is enriched in patients referred for a colonoscopy (with and without colorectal lesions).
a, PCoA of interindividual differences (BCD) in relative microbiota profiles of the LCPM cohort (n = 589 samples) using a cross-section of the Flemish population (n = 1,045 samples) as a background dataset. PCoA1 (Axis.1) and PCoA2 (Axis.2) respectively explained 13% and 17.1% of the variance of microbiota at the genus level. b, Enterotype distribution across the FGFP, LCPM and LCPM diagnosis groups (CTL, ADE and CRC), increased prevalence of the Bact2 enterotype in the three groups from the LCPM cohort (n = 589) as compared to FGFP samples (n = 1,045); pairwise two-sided test of equal or given proportions (P < 0.05). Source data
Extended Data Fig. 1
Extended Data Fig. 1. Association of intestinal inflammation with Fusobacterium nucleatum.
Intestinal calprotectin levels associate Fusobacterium nucleatum absolute (a) and relative (b) abundance in the LCMP. Two-sided Spearman rank correlation (adjP <0.05) and ‘x’ axes are log 10 transformed just for plotting. To rule out that the observed association is driven by a few samples with high abundance of Fusobacterium nucleatum, panel a has an insert of the plot removing samples with Fusobacterium nucleatum values above 1E8 cells per gram of stool. Best-fitting regression line in blue and 95% confidence interval shown in grey shading.
Extended Data Fig. 2
Extended Data Fig. 2. Fusobacterium nucleatum abundances before and after correction for intestinal calprotectin across diagnosis groups.
Absolute abundance of Fusobacterium nucleatum before (a) and after (b) correcting for intestinal calprotectin. Relative abundance of Fusobacterium nucleatum before (c) and after (d) correcting for intestinal calprotectin. The whiskers extend from the quartiles to the last data point within 1.5× of the interquartile range, with outliers beyond. The ‘y’ axes for (a) are log 10 transformed values (absolute abundance +1). The whiskers extend from the quartiles to the last data point within 1.5× of the interquartile range, with outliers beyond.
Extended Data Fig. 3
Extended Data Fig. 3. Spearman correlation between species abundance and microbiota covariates in the LCPM and FGFP cohorts.
Two-sided Spearman’s rank correlation comparison between absolute species abundance (QMP) and relative abundance (RMP) from the LCPM (N = 589 samples) and FGFP (N = 1045 samples) cohorts and a, BMI b, faecal calprotectin and c, moisture content values. Spearman correlation adjP < 0.05 (QMP and RMP, Supplementary Table 8).
Extended Data Fig. 4
Extended Data Fig. 4. Enterotype stratification by DMM community typing.
a, Identification of optimal number of clusters (Dirichlet components) in the LCPM cohort (n = 589) complemented with 1045 samples from the FGFP cohort, based on the Bayesian Information Criterion (BIC). b, Barplot representation of the average relative abundance of a few representative genera split into the four enterotypes identified by DMM community typing on the combined LCPM and FGFP cohorts (n = 1634).
Extended Data Fig. 5
Extended Data Fig. 5. Taxa assignation performance of the V4 amplicon marker in the LCPM.
a, Bootstrap values distribution across different ranks, b, Proportion of ASVs assigned from species to phylum, c, Proportion of ASVs assigned from species to phylum to each sample. The whiskers extend from the quartiles to the last data point within 1.5× of the interquartile range, with outliers beyond. The figure below (Panel a) illustrates our taxa assignation performance, showing that more than half of the ASVs were assigned to species level with bootstrap values above 80. Panel b shows the ASV assignation proportions from phylum (100%) to species level (50%). A comparison of proportions of ASVs assigned from each sample at different taxonomic levels revealed no significant differences in the distributions of assigned ASVs per sample across diagnosis groups, as indicated in panel c (KW test, p-values > 0.05). The center of the box plot represents the median value of the data, and the whiskers extend from the quartiles to the last data point within 1.5× of the interquartile range, with outliers beyond.
Extended Data Fig. 6
Extended Data Fig. 6. Performance of our methodology in small communities and isolated microorganisms.
a, Species composition of the ZymoBIOMICS gut controls, ten successfully identified species and b, two Fusobacterium species: Fusobacterium hwasookii (THCT14E2) and Fusobacterium nucleatum (DSM 20482T) were successfully identified using our methodology.
Extended Data Fig. 7
Extended Data Fig. 7. Quality control assessment for amplicon sequencing data (V4 16S rRNA gene).
a, The obtained reads for each sample are shown after processing with DADA2 (red and orange dashed lines represent 10, 000 and 1,000 reads, respectively; NCP: PCR negative control, NCE: DNA extraction Negative control, PC: positive control, and RS: Runella slithyformis control). b, Sequencing controls reveal the absence of barcode crosstalk. RS sequences serve as a marker for barcode crosstalk during sequencing. The absence of RS sequences in the samples without RS (no_RS) ruled out barcode crosstalk during the sequencing or PCR setup procedures. c, BCD among technical replicates demonstrating reproducibility. Pairwise comparisons between PC samples within and among MiSeq runs showed values under 0.2 (depicted by the pointed blue line). The center of the box plot represents the median value of the data, and the whiskers extend from the quartiles to the last data point within 1.5× of the interquartile range, with outliers beyond. d, Species composition of negative controls is presented, indicating the relative abundance and prevalence of the top 20 species. None of the species detected with differential abundance using QMP, RMP or CLR were found as background contaminants. Non-significant differences in bacteria composition were observed among DNA sequencing runs (Padj > 0.05, pairwiseAdonis test). A full list of detected species is available in Supplementary Table 12. Of note, DI18R24 is not shown as the negative controls (NCE and NCP) did not produce reads.
Extended Data Fig. 8
Extended Data Fig. 8. Species and genera associated with CRC on a subset of the curatedMetagenomicData.
After performing our differential abundance procedure on the MataPhalAn 3.0 profiles downloaded from the curatedMetagenomicData, 108 species (a) and 63 genera (b) were identified across the 9 metagenomics datasets.

References

    1. Yang, L. et al. Changes in colorectal cancer incidence by site and age from 1973 to 2015: a SEER database analysis. Aging Clin. Exp. Res.33, 1–10 (2020). - PubMed
    1. Keum, N. & Giovannucci, E. Global burden of colorectal cancer: emerging trends, risk factors and prevention strategies. Nat. Rev. Gastroenterol. Hepatol.16, 713–732 (2019). - PubMed
    1. Araghi, M. et al. Global trends in colorectal cancer mortality: projections to the year 2035. Int. J. Cancer10.1002/ijc.32055 (2018). - PubMed
    1. Rex, D. K. & Eid, E. Considerations regarding the present and future roles of colonoscopy in colorectal cancer prevention. Clin. Gastroenterol. Hepatol.6, 506–514 (2008). - PubMed
    1. Gupta, V. K. et al. A predictive index for health status using species-level gut microbiome profiling. Nat. Commun.11, 4635 (2020). - PMC - PubMed