. 2024 May;56(5):1164-1177.
doi: 10.1038/s12276-024-01225-y. Epub 2024 May 1.

TLR7-dependent eosinophil degranulation links psoriatic skin inflammation to small intestinal inflammatory changes in mice

Affiliations

TLR7-dependent eosinophil degranulation links psoriatic skin inflammation to small intestinal inflammatory changes in mice

Hee Joo Kim et al. Exp Mol Med. 2024 May.

Abstract

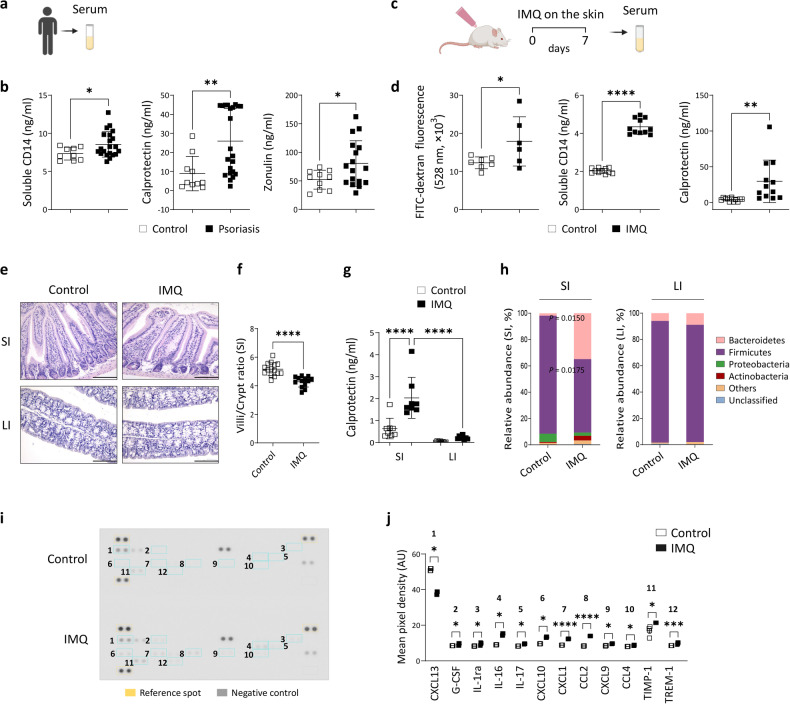
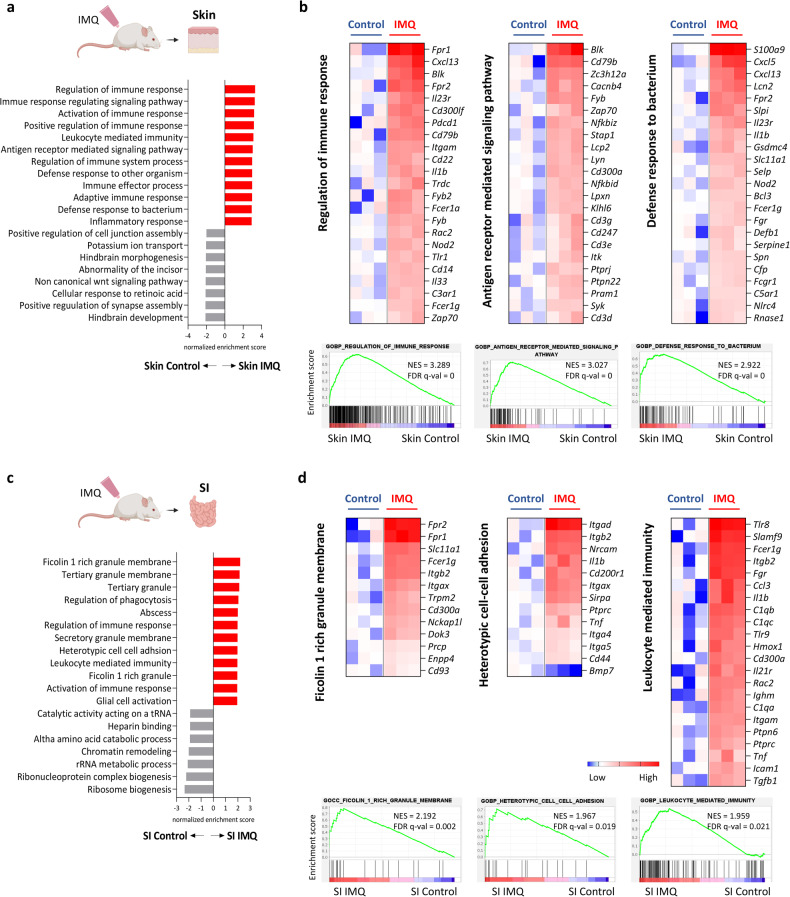
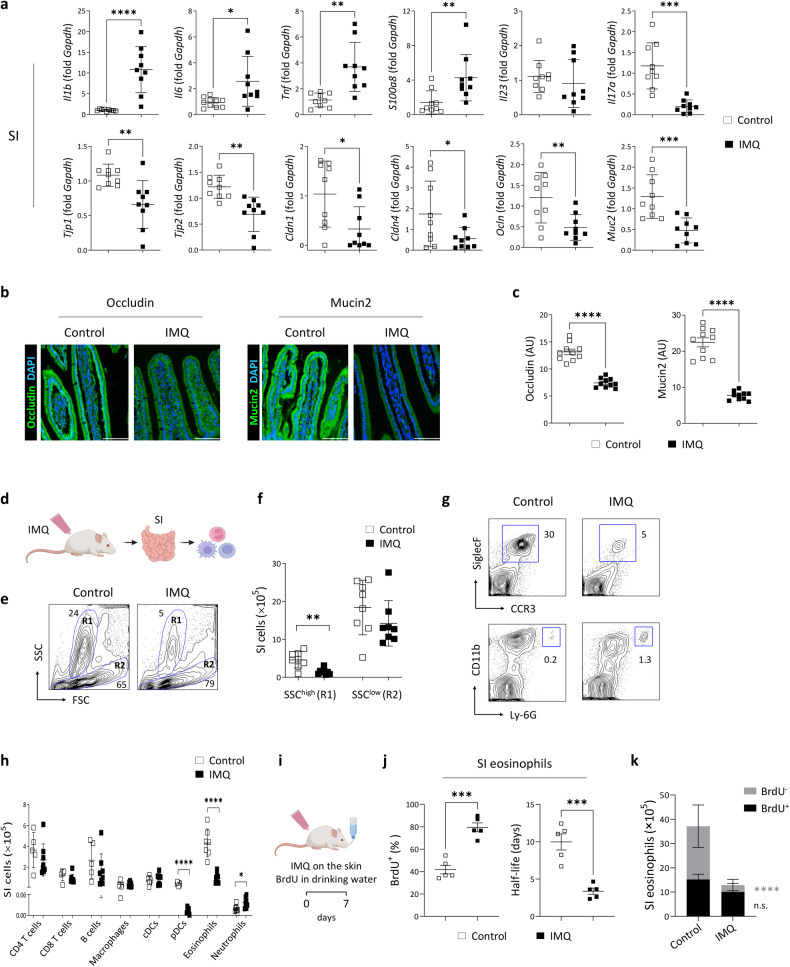
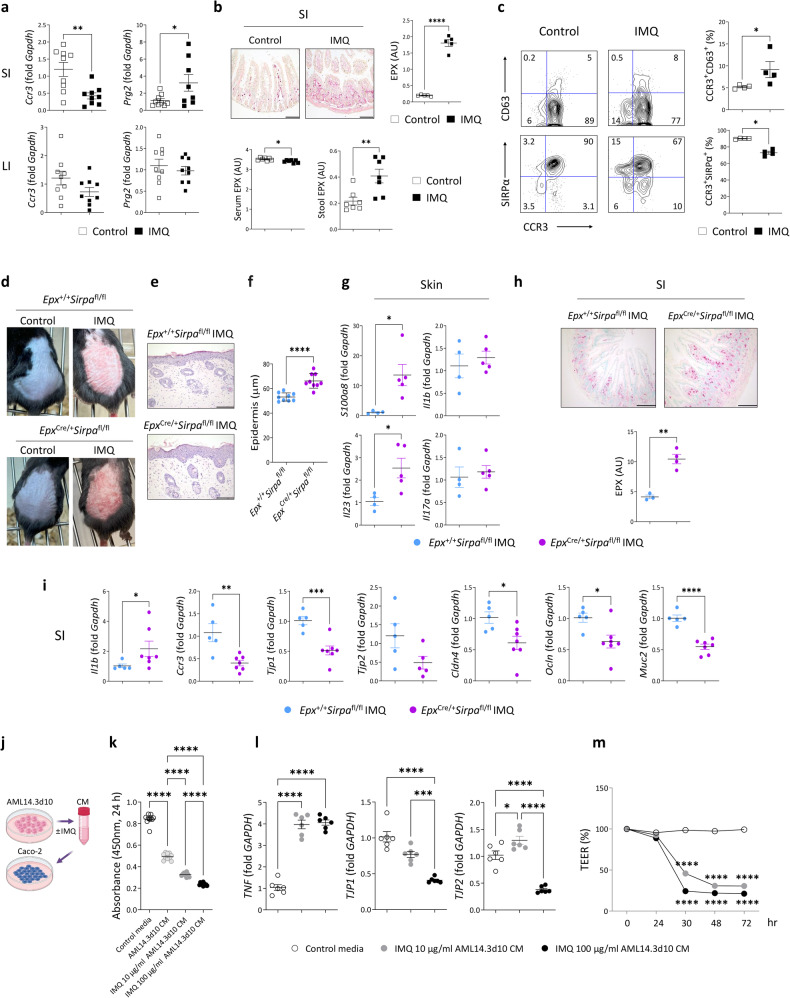
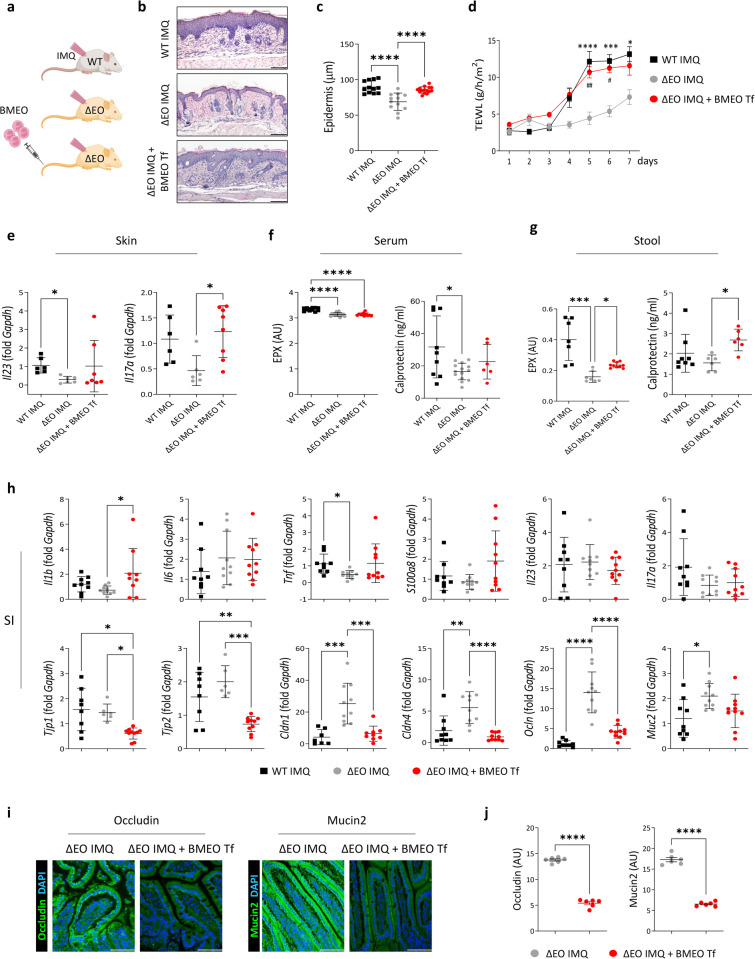
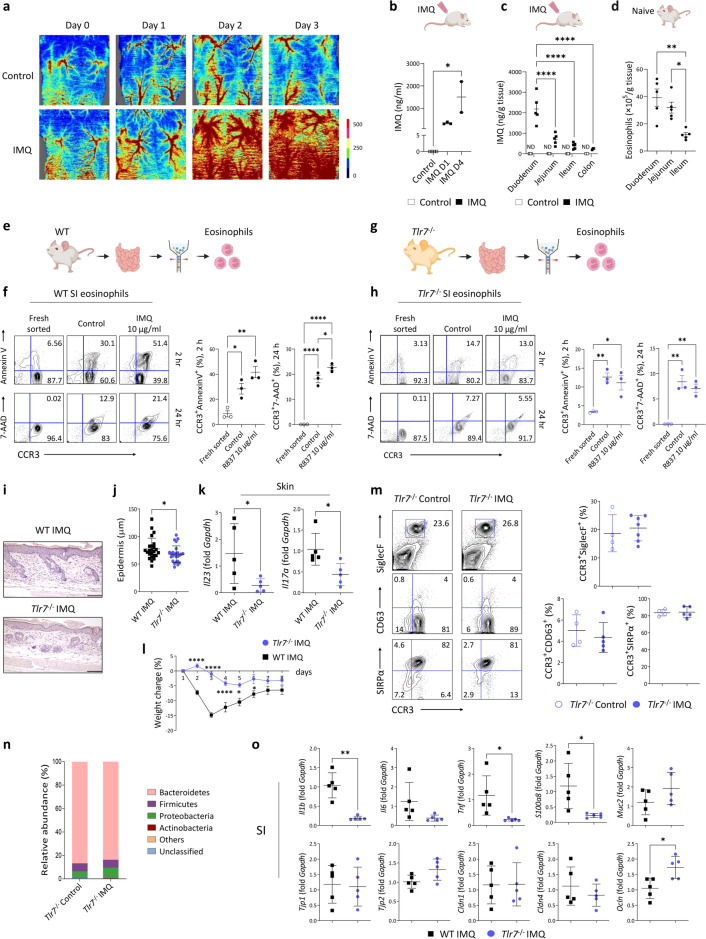
Recent evidence of gut microbiota dysbiosis in the context of psoriasis and the increased cooccurrence of inflammatory bowel disease and psoriasis suggest a close relationship between skin and gut immune responses. Using a mouse model of psoriasis induced by the Toll-like receptor (TLR) 7 ligand imiquimod, we found that psoriatic dermatitis was accompanied by inflammatory changes in the small intestine associated with eosinophil degranulation, which impaired intestinal barrier integrity. Inflammatory responses in the skin and small intestine were increased in mice prone to eosinophil degranulation. Caco-2 human intestinal epithelial cells were treated with media containing eosinophil granule proteins and exhibited signs of inflammation and damage. Imiquimod-induced skin and intestinal changes were attenuated in eosinophil-deficient mice, and this attenuation was counteracted by the transfer of eosinophils. Imiquimod levels and the distribution of eosinophils were positively correlated in the intestine. TLR7-deficient mice did not exhibit intestinal eosinophil degranulation but did exhibit attenuated inflammation in the skin and small intestine following imiquimod administration. These results suggest that TLR7-dependent bidirectional skin-to-gut communication occurs in psoriatic inflammation and that inflammatory changes in the intestine can accelerate psoriasis.


Conflict of interest statement

The authors declare no competing interests.

Figures

Fig. 1
Fig. 1. Psoriatic skin inflammation induces changes in the intestinal microenvironment.
a, b Serum concentrations of soluble CD14, calprotectin, and zonulin in healthy individuals and patients with psoriasis. c Schematic of imiquimod (IMQ)-induced psoriatic inflammation. d Serum fluorescein isothiocyanate (FITC)-dextran fluorescence and soluble CD14 and calprotectin concentrations in mice. e Images of hematoxylin and eosin-stained tissues from the small intestine (SI) and large intestine (LI). Scale bars, 124.5 μm. f Ratio of villus length to crypt length. Three to five villi and crypts were analyzed per section. g Calprotectin concentrations in stool. h Sequencing of the stool microbiota of the SI and LI of mice treated with IMQ (n = 3) or vehicle cream (n = 4). Image of the cytokine array membrane (i) and the quantified density (j). The data are presented as the means ± SDs. *P < 0.05, **P < 0.01, ***P < 0.001, and ****P < 0.0001 according to unpaired t tests (b, d, f, h, and CCL2 and CXCL9 in j), Mann–Whitney tests (calprotectin in b and j), or one-way ANOVA with Bonferroni’s multiple comparisons (g).
Fig. 2
Fig. 2. The skin and small intestines of mice with psoriatic inflammation exhibit differential transcriptomic changes.
Gene ontology terms enriched in the skin (a) and small intestine (SI; c) of imiquimod (IMQ)-treated mice compared with vehicle-treated control mice were determined by gene set enrichment analysis. Selected gene sets and enrichment plots of genes that were differentially expressed in the skin (b) and SI (d) of vehicle-treated and IMQ-treated mice (adjusted P < 0.05). The heatmaps show the log2-fold change relative to the geometric mean fragments per kilobase of transcript per million mapped reads + 0.01.
Fig. 3
Fig. 3. Psoriatic skin inflammation induces inflammatory changes and reduces the number of eosinophils in the small intestine.
a Quantitative PCR analysis of the small intestine (SI). Occludin and mucin 2 (green) immunofluorescence staining (b) and quantification (c) in the SI. Nuclei were stained with 4’,6-diamidino-2-phenylindole (DAPI; blue). The fluorescence intensity of each section was analyzed. Scale bars, 62.3 μm. d Schematic of the cell isolation procedure. e The forward scatter (FSC) and side scatter (SSC) populations of cells in the SI. SSChigh and SSClow cells are indicated as R1 and R2, respectively. f Absolute number of cells. g Representative flow cytometry plots of eosinophils (upper row) and neutrophils (lower row) in the SI. h Absolute numbers of immune cells in the SI. cDCs, conventional dendritic cells; pDCs, plasmacytoid DCs. i Schematic of bromodeoxyuridine (BrdU) treatment. j Percentage of BrdU+ eosinophils in the SI (left) and estimated half-life of small intestinal eosinophils (right). k The absolute numbers of BrdU+ and BrdU- eosinophils in the SI. The data are presented as the mean ± SD. *P < 0.05, **P < 0.01, ***P < 0.001, and ****P < 0.0001 according to unpaired t tests (a, c, f, h, and j), Mann–Whitney tests (S100a8 and Cldn1 in a), or two-way ANOVA with Bonferroni’s multiple comparisons (k).
Fig. 4
Fig. 4. Psoriatic skin inflammation induces the degranulation of small intestinal eosinophils.
a Quantitative PCR analysis. SI, small intestine; LI, large intestine. b Immunohistochemical staining for eosinophil peroxidase (EPX) (upper row) in the SI and EPX levels in the serum and stool (lower row). Scale bars, 134 μm. c Representative flow cytometry plots (left) and percentages (right) of CCR3+CD63+ and CCR3+SIRPα+ eosinophils in the SI. Singlet SSChighCD45+CD11b+ cells were gated. d Photographs of skin treated with vehicle cream (control) or imiquimod (IMQ). e Hematoxylin and eosin-stained skin. Scale bars, 124.5 μm. f Epidermal thickness. Three distinct regions of each section were analyzed. g Quantitative PCR analysis of the skin. h EPX immunohistochemical staining and quantification in the SI. The intensity of each section was analyzed. Scale bars, 124.5 μm. i Quantitative PCR analysis of the SI. j Schematic of Caco-2 cell treatment with conditioned media (CM) collected from AML 14.3D10 cells. k Viability of Caco-2 cells. l Quantitative PCR analysis of Caco-2 cells. m Transepithelial electrical resistance (TEER) of polarized Caco-2 cells. ****P < 0.0001 vs. control media. The data are presented as the mean ± SD. *P < 0.05, **P < 0.01, ***P < 0.001, and ****P < 0.0001 according to the unpaired t test (a, b, f, g, h, and i), Mann–Whitney test (c and Il1b in i), one-way ANOVA with Tukey’s multiple comparisons (k and l), or two-way ANOVA with Bonferroni’s multiple comparisons (m).
Fig. 5
Fig. 5. Psoriatic skin inflammation and the increase in intestinal permeability are attenuated in eosinophil-deficient mice.
a Schematic of the adoptive transfer (Tf) of bone marrow-derived eosinophils (BMEOs). WT, wild-type; ΔEO, ΔdblGATA. (b) Hematoxylin and eosin-stained skin. Scale bars, 124.5 μm. c Epidermal thickness. Three distinct regions of each section were analyzed. d Transepidermal water loss (TEWL) (n = 9 or 10/group). *P < 0.05, ***P < 0.001, and ****P < 0.0001, WT IMQ vs. ΔEO IMQ; #P < 0.05, ##P < 0.01, ΔEO IMQ + BMEO Tf vs. ΔEO IMQ. e Quantitative PCR analysis of the skin. f Serum concentrations of eosinophil peroxidase (EPX) and calprotectin. g Stool concentrations of EPX and calprotectin. h Quantitative PCR analysis of the small intestine (SI). Occludin and mucin 2 (green) immunofluorescence staining (i) and quantification (j) in the SI. Nuclei were stained with 4’,6-diamidino-2-phenylindole (DAPI; blue). The fluorescence intensity of each section was analyzed. Scale bars, 62.3 μm. The data are presented as the means ± SDs. *P < 0.05, **P < 0.01, ***P < 0.001, and ****P < 0.0001; one-way ANOVA with Tukey’s multiple comparisons (c, e, f, and h); Kruskal–Wallis test with Dunn’s multiple comparisons (Il23 in e, g, and Tnf and Tjp1 in h); two-way ANOVA with Bonferroni’s multiple comparisons (d); or unpaired t test (j).
Fig. 6
Fig. 6. Eosinophil degranulation and inflammatory changes in the small intestine in mice with psoriatic skin inflammation are induced in a TLR7-dependent manner.
a Representative images of blood perfusion on the dorsal skin of mice. IMQ, imiquimod. The color density indicates the level of microcirculation. IMQ concentrations in the serum (b) and intestine (c). ND, not detected. d Absolute number of eosinophils in naïve mice. e, g Schematic of eosinophil sorting from the small intestine (SI). WT, wild-type. f, h Representative flow cytometry plots (left) and percentages (right) of sorted eosinophils stained with Annexin V+ or 7-aminoactinomycin D (7-AAD)+ after being cultured with IMQ. i Hematoxylin and eosin-stained skin. Scale bars, 124.5 μm. j Epidermal thickness. Three distinct regions of each section were analyzed. k Quantitative PCR analysis of the skin. l Weight change (n = 4 or 5/group). m Representative flow cytometry plots (left) and percentages (right) of SiglecF+, CD63+, and SIRPα+ eosinophils in the SI. n Sequencing of the stool microbiota of the SI (n = 3). o Quantitative PCR analysis of the SI. The data are presented as the mean ± SD. *P < 0.05, **P < 0.01, and ****P < 0.0001 according to the Kruskal–Wallis test with Dunn’s multiple comparisons (b); one-way ANOVA with Tukey’s multiple comparisons (c, d, f, and h); Mann–Whitney test (j, k, and o); unpaired t test (Il23 in k and Tnf, S100a8, and Ocln in o); or two-way ANOVA with Bonferroni’s multiple comparisons (l).

References

    1. Lowes MA, Suarez-Farinas M, Krueger JG. Immunology of psoriasis. Annu. Rev. Immunol. 2014;32:227–255. doi: 10.1146/annurev-immunol-032713-120225. - DOI - PMC - PubMed
    1. Nestle FO, Kaplan DH, Barker J. Psoriasis. N Engl. J Med. 2009;361:496–509. doi: 10.1056/NEJMra0804595. - DOI - PubMed
    1. Sgambelluri F, et al. A role for CCR5(+)CD4 T cells in cutaneous psoriasis and for CD103(+) CCR4(+) CD8 Teff cells in the associated systemic inflammation. J Autoimmun. 2016;70:80–90. doi: 10.1016/j.jaut.2016.03.019. - DOI - PubMed
    1. Zohar A, et al. Gastrointestinal comorbidities in patients with psoriatic arthritis. Clin. Rheumatol. 2016;35:2679–2684. doi: 10.1007/s10067-016-3374-y. - DOI - PubMed
    1. Scher JU, et al. Decreased bacterial diversity characterizes the altered gut microbiota in patients with psoriatic arthritis, resembling dysbiosis in inflammatory bowel disease. Arthritis Rheumatol. 2015;67:128–139. doi: 10.1002/art.38892. - DOI - PMC - PubMed

MeSH terms