. 2024 May;56(5):1150-1163.
doi: 10.1038/s12276-024-01223-0. Epub 2024 May 1.

Stress-induced epinephrine promotes hepatocellular carcinoma progression via the USP10-PLAGL2 signaling loop

Affiliations

Stress-induced epinephrine promotes hepatocellular carcinoma progression via the USP10-PLAGL2 signaling loop

Chen Wang et al. Exp Mol Med. 2024 May.

Abstract

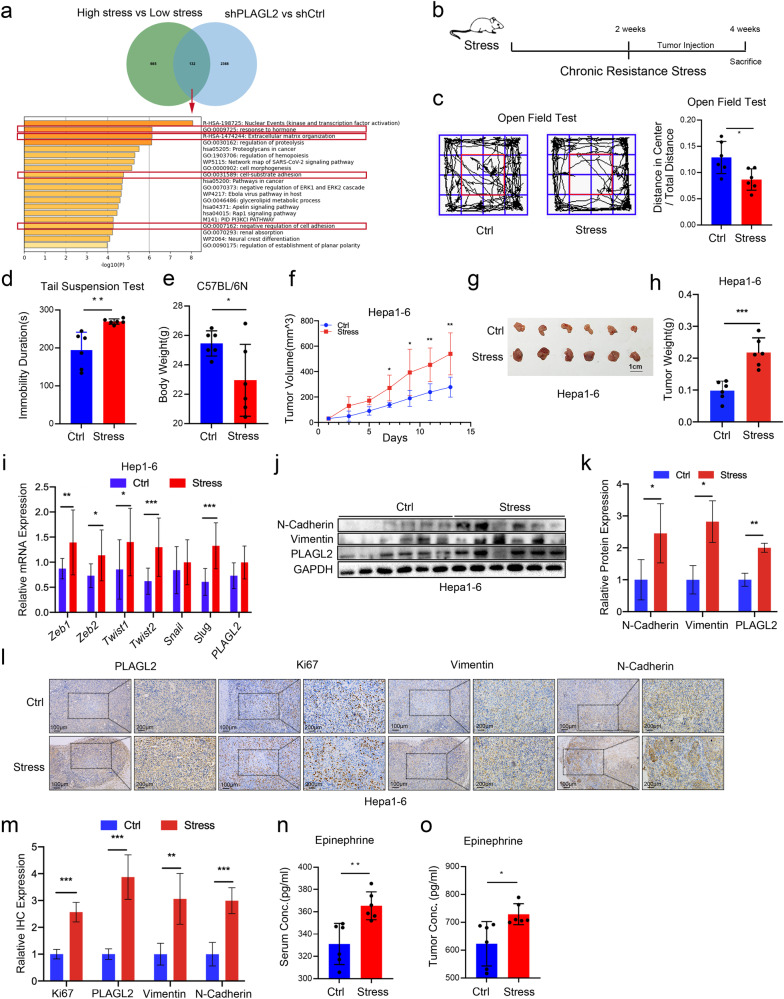
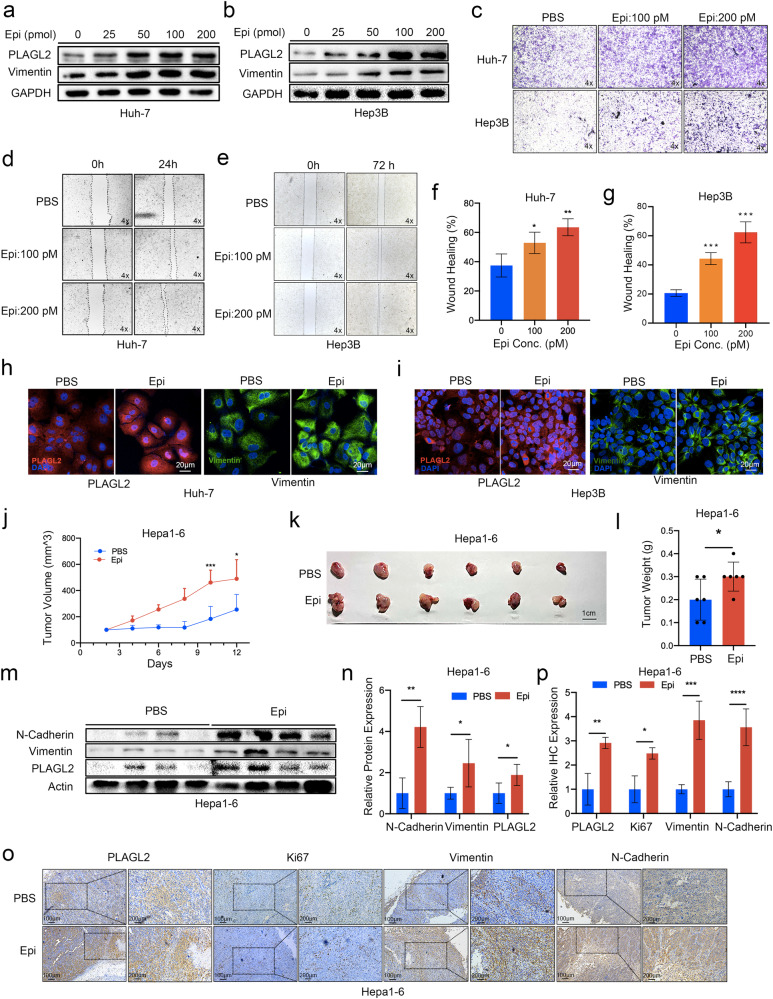
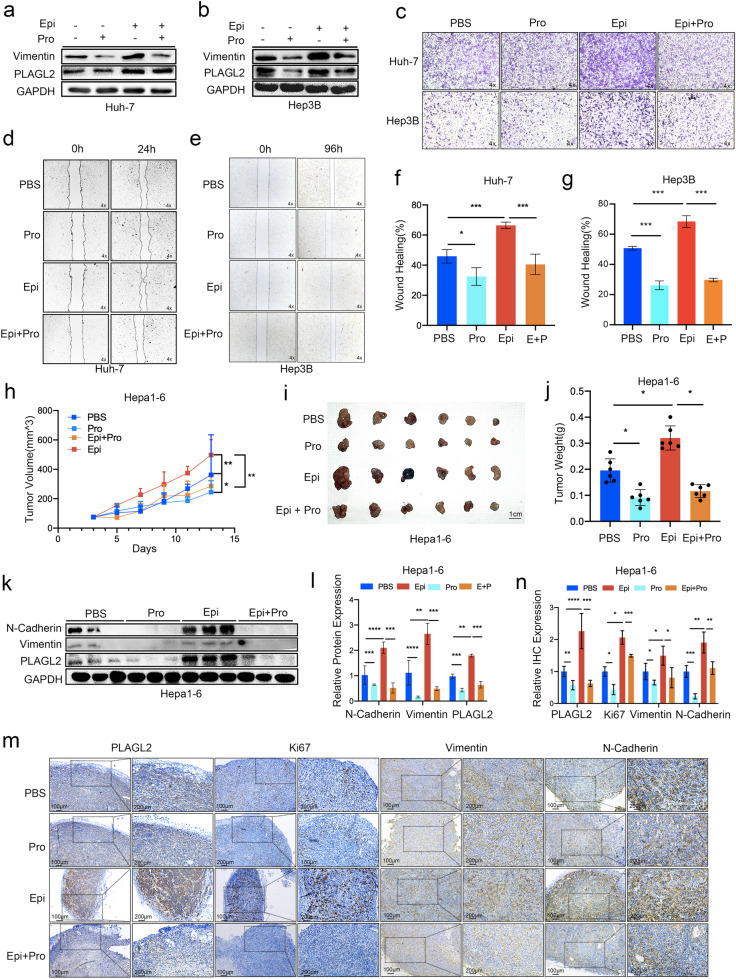
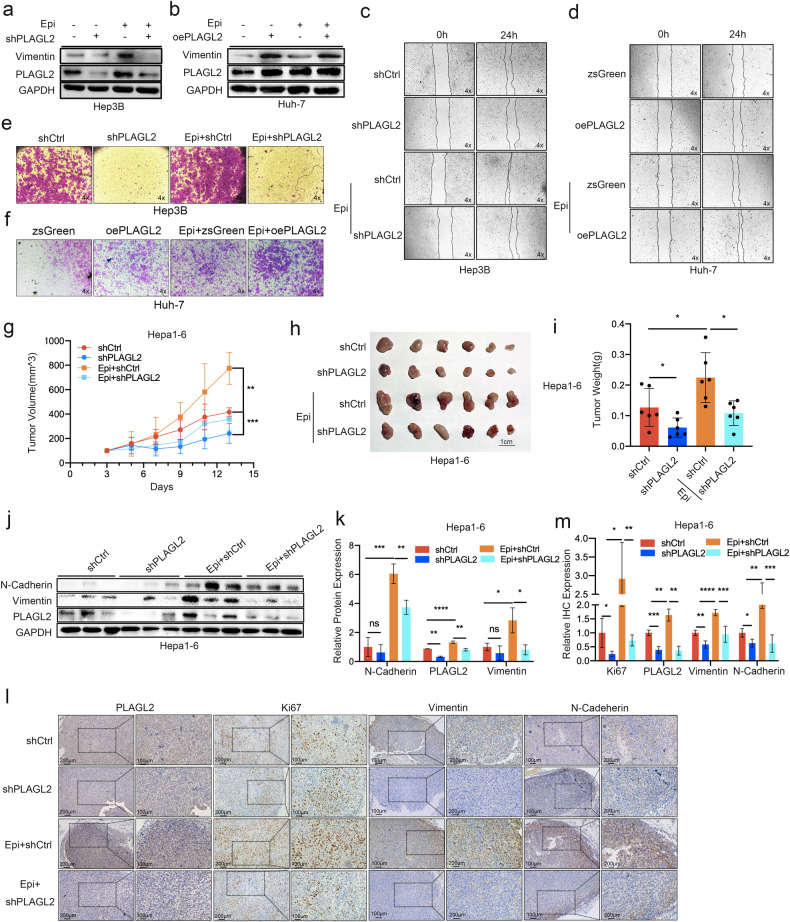
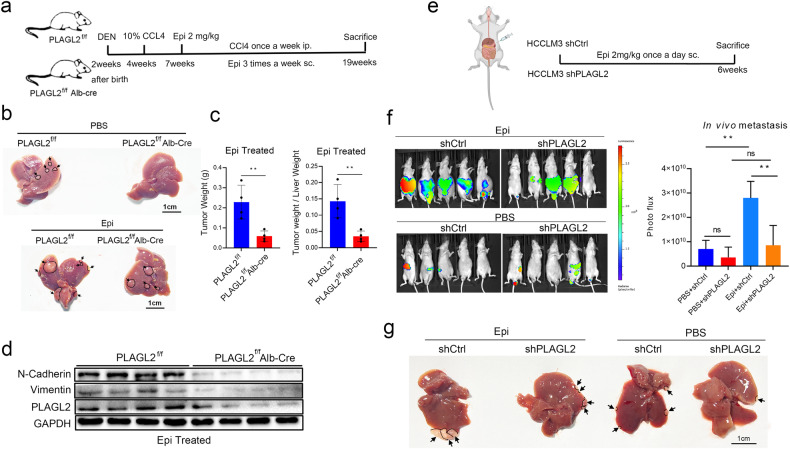
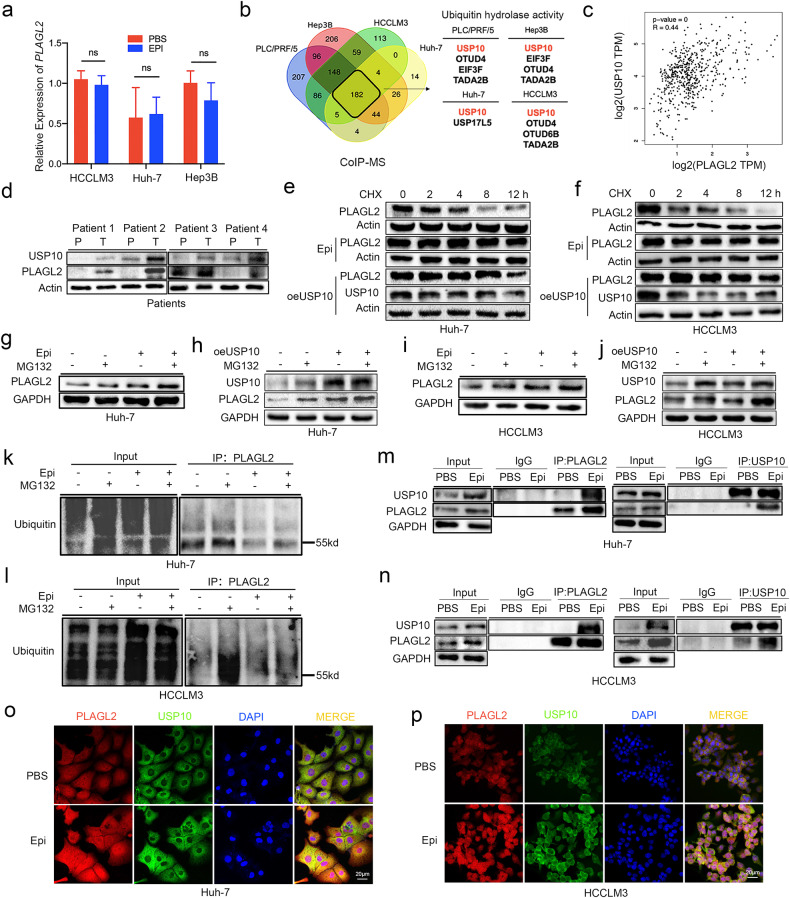
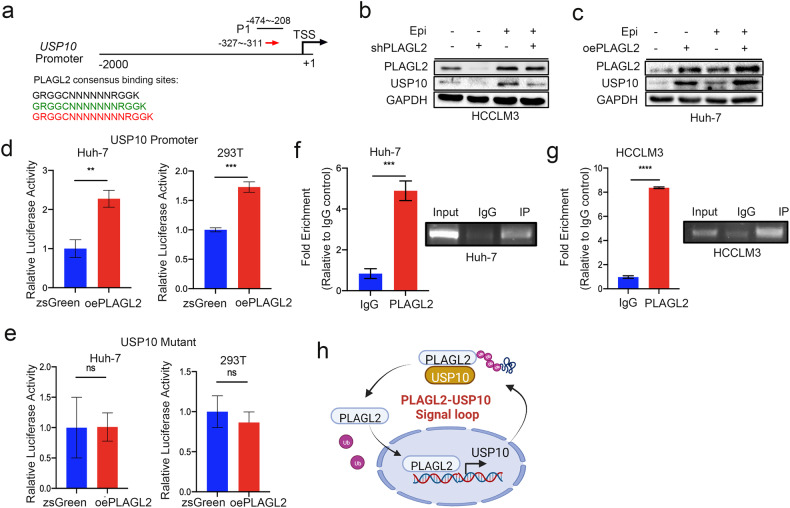
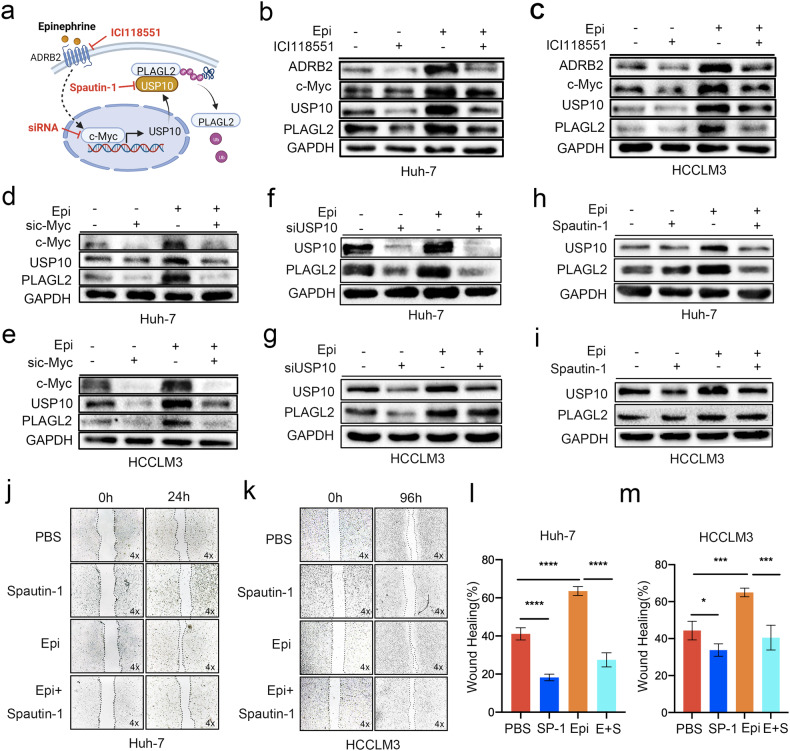
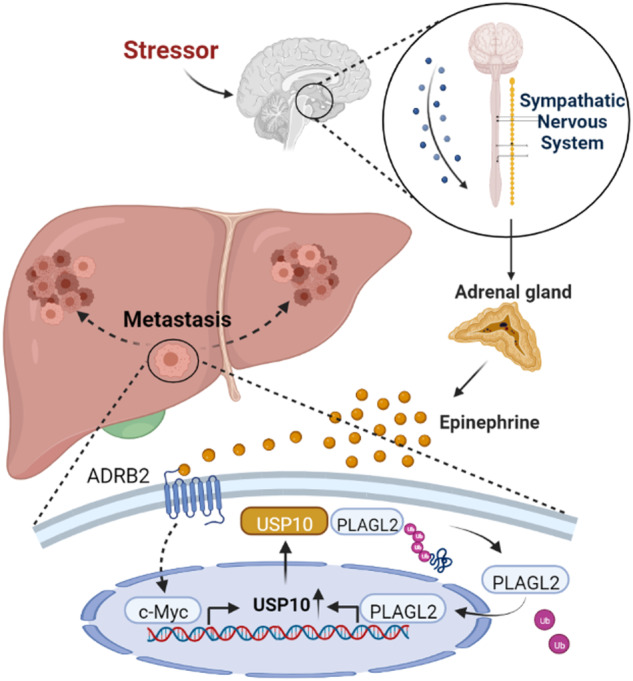
Hepatocellular carcinoma (HCC) is associated with a poor prognosis. Our previous study demonstrated that Pleomorphic adenoma gene like-2 (PLAGL2) was a potential therapeutic target in HCC. However, the mechanisms that lead to the upregulation of PLAGL2 in HCC remain unclear. The present study revealed that stress-induced epinephrine increased the expression of PLAGL2, thereby promoting the progression of HCC. Furthermore, PLAGL2 knockdown inhibited epinephrine-induced HCC development. Mechanistically, epinephrine upregulated ubiquitin-specific protease 10 (USP10) to stabilize PLAGL2 via the adrenergic β-receptor-2-c-Myc (ADRB2-c-Myc) axis. Furthermore, PLAGL2 acted as a transcriptional regulator of USP10, forming a signaling loop. Taken together, these results reveal that stress-induced epinephrine activates the PLAGL2-USP10 signaling loop to enhance HCC progression. Furthermore, PLAGL2 plays a crucial role in psychological stress-mediated promotion of HCC progression.


Conflict of interest statement

The authors declare no competing interests.

Figures

Fig. 1
Fig. 1. Chronic stress promotes PLAGL2 expression via epinephrine.
a Molecular function of genes enriched in the PLAGL2 knockdown group (p < 0.05) and depressed (GSE9116 database, p < 0.05) patients, as determined by Gene Ontology enrichment analysis. b Schematic representation of the experimental design and timeline used to establish the chronic stress tumor mouse model. c Open field tests were used to assess the behaviors of chronic stress model mice (n = 6). d The tail suspension test was used to analyze the behaviors of chronic stress model mice (n = 6). e Body weights of the mice under stressed and nonstressed conditions (n = 6). f Tumor volumes of Hepa1-6 xenograft tumors in the model mice under control and stressed conditions (n = 6). g, h Images and weights of tumors from nonstressed and chronically stressed tumor model mice. i qRT‒PCR analysis of the mRNA expression of Zeb1, Zeb2, Twist1, Twist2, Snail, Slug, and PLAGL2 in tumor tissues from model mice under control and stressed conditions. j, k Western blot and quantitative analyses of the protein levels of EMT-related factors (N-cadherin and vimentin) and PLAGL2 in tumor tissues from mice under control and stressed conditions. l, m IHC and quantitative analyses of PLAGL2, Ki67, vimentin, and N-cadherin expression in tumor tissues from control and stressed mice. n, o Concentrations (Conc.) of Epi in the serum and tumor tissue of nonstressed and chronically stressed mice were measured by ELISA. The data are presented as the mean ± SD and were analyzed by two-tailed Student’s t tests. *p < 0.05, **p < 0.01, ***p < 0.01. Epi epinephrine.
Fig. 2
Fig. 2. Epinephrine upregulates PLAGL2 expression and promotes HCC progression.
a, b Western blot analysis of PLAGL2 and Vimentin expression in HCC cells treated with the indicated concentrations of Epi for 48 h. c–g Effects of Epi on the migration of HCC cells. Representative images of HCC cells in the Transwell (c) and wound healing assays (d, e). f, g Statistical analysis of the wound healing assay results (n = 3). h, i Localization and expression of PLAGL2 were detected by IF analysis of PBS- or Epi-treated HCC cells. j Changes in the volumes of the PBS- or Epi-treated tumors (n = 6). k, l Images and changes in the weights of PBS- or Epi-treated tumors (n = 6). m, n Western blot and quantitative analyses of the protein levels of EMT-related factors (N-cadherin and vimentin) and PLAGL2 in the tumor tissues of PBS- or Epi-treated mice. o, p IHC and quantitative analyses of PLAGL2, Ki67, vimentin, and N-cadherin expression in the tumor tissues of PBS- or Epi-treated mice. The data are presented as the mean ± SD and were analyzed by two-tailed Student’s t tests. *p < 0.05, **p < 0.01, ***p < 0.001, ****p < 0.0001. IF Immunofluorescence.
Fig. 3
Fig. 3. Propranolol inhibits epinephrine-mediated PLAGL2 expression and HCC progression.
a, b HCC cells were treated with Epi (100 pM) for 48 h and then treated with propranolol (10 μM) for 24 h. The protein expression of PLAGL2 and vimentin was analyzed by Western blot analysis. ce Effects of propranolol on the migration of HCC cells. Representative images of HCC cells in the Transwell (c) and wound healing assays (d, e). f, g Statistical analysis of the wound healing assay results (n = 3). h Tumor growth of Hepa1-6 cells in mice treated with Epi (2 mg/kg/d, s.c.) or propranolol (2 mg/kg/d, i.p.). i, j Images and statistical analysis of tumor weights in model mice treated with Epi and propranolol (n = 6). k, l Western blot and quantitative analyses of the protein levels of EMT-related factors (N-cadherin and vimentin) and PLAGL2 in the tumors of mice treated with Epi and propranolol. m, n IHC and quantitative analyses of PLAGL2, Ki67, vimentin, and N-cadherin expression in the tumors of mice treated with Epi or propranolol. The data are presented as the mean ± SD and were analyzed by two-tailed Student’s t tests. *p < 0.05, **p < 0.01, ***p < 0.001. Pro propranolol.
Fig. 4
Fig. 4. PLAGL2 knockdown inhibits Epi-induced HCC progression in vitro and in vivo.
a, b PLAGL2-knockdown and PLAGL2-overexpressing HCC cells were treated with or without Epi (100 pM) for 48 h, and Western blot analysis of the protein expression of PLAGL2 and Vimentin was performed. cf Effects of Epi on the migration of PLAGL2-knockdown or -overexpressing HCC cells. Representative images of HCC cells in the wound healing (c, d) and Transwell (e, f) assays. g Tumor growth of shCtrl and shPLAGL2 Hepa1-6 cells in mice treated with or without Epi (2 mg/kg/d, s.c.). h, i Images and statistical analysis of tumor weights in the shCtrl and shPLAGL2 Hepa1-6 groups treated with or without Epi. j, k Western blot and quantitative analyses of the protein levels of EMT-related factors (N-cadherin and vimentin) and PLAGL2 in shCtrl and shPLAGL2 Hepa1-6 tumors from mice treated with or without Epi. l, m IHC and quantitative analyses of PLAGL2, Ki67, vimentin, and N-cadherin expression in shCtrl and shPLAGL2 Hepa1-6 tumors in mice treated with Epi. Analyses were performed by two-tailed Student’s t tests. The data are presented as the mean ± SD. *p < 0.05, **p < 0.01, ***p < 0.001, ****p < 0.0001. Epi epinephrine.
Fig. 5
Fig. 5. Hepatocyte-specific PLAGL2 knockout suppresses epinephrine-induced HCC tumorigenesis and metastasis.
a Schematic representation of DEN/CCl4-induced HCC models treated with PBS or Epi (2 mg/kg, 3 times/week). b Images of the livers of DEN/CCl4-induced HCC model mice. Arrowheads indicate tumor nodules in the liver. c Total and relative weights of tumor tissues from PLAGL2 f/f and PLAGL2 f/f Alb-cre mice treated with PBS or Epi. Analyses were performed by two-tailed Student’s t-test (n = 4). d Western blot analysis of the protein levels of EMT-related factors (N-cadherin and vimentin) and PLAGL2 in the tumors of PLAGL2 f/f and PLAGL2 f/f Alb-cre mice treated with PBS or Epi. e Schematic representation of liver metastasis mouse models induced by intrasplenic injection of shPLAGL2 and shCtrl HCCLM3 cells. f Representative in vivo images of the spleens of mice injected with the indicated HCCLM3 cells. g Representative images of the livers of mice treated with PBS or Epi (2 mg/kg/d). The data are presented as the mean ± SD. *p < 0.05.
Fig. 6
Fig. 6. Epinephrine-induced USP10 deubiquitinates and stabilizes PLAGL2.
a The mRNA expression of PLAGL2 in HCC cells was measured by RT‒qPCR (n = 3). HCC cells were treated with epinephrine (100 pM) for 48 h. b Venn plot of peptides with ubiquitin hydrolase activity that interact with PLAGL2 in the four HCC cell lines according to co-IP and mass spectrometry. c Correlations between PLAGL2 and USP10 expression in the LIHC cohort of TCGA patients were determined by Pearson’s correlation analysis. d Expression of PLAGL2 and USP10 in HCC patients was verified by Western blotting (P, precancerous tissues; T, tumor tissues). e, f Western blot analysis of the protein levels of PLAGL2 in HCC cells treated with Epi (100 pM) for 48 h or transfected with the USP10 overexpression (oeUSP10) plasmid followed by treatment with cycloheximide (CHX) (100 μg/ml) for the indicated times. gj Western blot analysis of the protein levels of PLAGL2 in HCC cells treated with Epi (100 pM) or transfected with the oeUSP10 plasmid followed by treatment with MG132 (10 μM). k, l The levels of PLAGL2 ubiquitination in anti-PLAGL2 immunoprecipitates and whole-cell lysates (input) derived from Huh-7 and HCCLM3 cells treated with Epi (100 pM) for 48 h and MG132 (10 μM) for 12 h. m, n Co-IP assays of HCC cells treated with or without Epi (100 pM), USP10, or PLAGL2 and immunoprecipitated with anti-PLAGL2 and anti-USP10 antibodies. o, p The localization and expression of PLAGL2 and USP10 in PBS- or Epi-treated HCC cells were examined by IF assays. Epi epinephrine.
Fig. 7
Fig. 7. PLAGL2 functions as a transcription factor of USP10.
a PLAGL2 consensus binding sites were identified in the USP10 promoter (−2000 to +1 from the translation start site). These sites were identified as GRGGC (NNNNNN)RGGK (black arrow), GRGGC (NNNNNNN)RGGK (green arrow), and GRGGC(NNNNNNNN)RGGK (red arrow). b, c Western blot analysis of the protein levels of PLAGL2 and USP10 in PLAGL2-knockdown and PLAGL2-overexpressing HCC cells treated with or without Epi (100 pM). d The regulatory effects of PLAGL2 on the USP10 promoter in Huh-7 and 293T cells were examined by dual-luciferase reporter assays. e The regulatory effects of PLAGL2 on the USP10 mutant promoter in Huh-7 and 293T cells were examined by dual-luciferase reporter assays. f, g Enrichment of PLAGL2 in the USP10 promoter region in Huh-7 and HCCLM3 cells was determined by ChIP assays. h Model of the epinephrine-induced USP10-PLAGL2 signaling loop. The data are presented as the mean ± SD. *p < 0.05, **p < 0.01, ***p < 0.001, ****p < 0.0001. Epi epinephrine.
Fig. 8
Fig. 8. Epinephrine induces the ADRB2-c-Myc axis to activate USP10 transcription and promote HCC progression.
a Model of Epi-induced USP10-PLAGL2 signaling loop activation via ADRB2-c-Myc. b, c HCC cells were treated with ICI118, 551 (10 μM) or Epi (100 pM) for 48 h, after which Western blot analysis was performed to measure the protein levels of ADRB2, c-Myc, USP10, and PLAGL2. d, e HCC cells were transfected with c-Myc siRNA (si465) for 24 h and treated with Epi (100 pM) for 48 h, after which Western blot analysis was performed to determine the protein levels of c-Myc, USP10 and PLAGL2. f, g HCC cells were transfected with USP10 siRNA (si1756) for 24 h and treated with Epi (100 pM) for 48 h, after which Western blot analysis was performed to determine the protein levels of USP10 and PLAGL2. h, i HCC cells were treated with the USP10-specific antagonist Spautin-1 (10 μM) or Epi (100 pM) for 48 h, after which Western blot analysis was performed to measure the protein levels of USP10 and PLAGL2. jm Representative images of HCC cells treated with Spautin-1 (10 μM) or Epi (100 pM) for 24 h or 96 h and examined by a wound healing assay. The data are presented as the mean ± SD. *p < 0.05, **p < 0.01, ***p < 0.001, ****p < 0.0001. Epi epinephrine.
Fig. 9
Fig. 9. Schematic depiction of the Epinephrine-ADRB2-c-Myc-USP10-PLAGL2 interaction in HCC cells.
Schematic representation showing how stress-induced epinephrine increases the expression of PLAGL2 through the ADRB2-c-Myc-USP10 signaling axis to promote the metastasis and progression of HCC.

Similar articles

Cited by

References

    1. Sung H, et al. Global Cancer Statistics 2020: GLOBOCAN Estimates of Incidence and Mortality Worldwide for 36 Cancers in 185 Countries. CA Cancer J. Clin. 2021;71:209–249. doi: 10.3322/caac.21660. - DOI - PubMed
    1. Hu W, et al. PLAGL2-EGFR-HIF-1/2α Signaling Loop Promotes HCC Progression and Erlotinib Insensitivity. Hepatology. 2021;73:674–691. doi: 10.1002/hep.31293. - DOI - PubMed
    1. Abdollahi A. LOT1 (ZAC1/PLAGL1) and its family members: mechanisms and functions. J. Cell. Physiol. 2007;210:16–25. doi: 10.1002/jcp.20835. - DOI - PubMed
    1. Wu L, et al. PLAGL2 promotes the proliferation and migration of gastric cancer cells via USP37-mediated deubiquitination of Snail1. Theranostics. 2021;11:700–714. doi: 10.7150/thno.47800. - DOI - PMC - PubMed
    1. Sekiya R, et al. PLAGL2 regulates actin cytoskeletal architecture and cell migration. Carcinogenesis. 2014;35:1993–2001. doi: 10.1093/carcin/bgu081. - DOI - PubMed

MeSH terms