Review
. 2025 Feb;16(1):96-118.
doi: 10.1007/s12975-024-01242-z. Epub 2024 Apr 30.

All Three Supersystems-Nervous, Vascular, and Immune-Contribute to the Cortical Infarcts After Subarachnoid Hemorrhage

Affiliations
Review

All Three Supersystems-Nervous, Vascular, and Immune-Contribute to the Cortical Infarcts After Subarachnoid Hemorrhage

Jens P Dreier et al. Transl Stroke Res. 2025 Feb.

Abstract

The recently published DISCHARGE-1 trial supports the observations of earlier autopsy and neuroimaging studies that almost 70% of all focal brain damage after aneurysmal subarachnoid hemorrhage are anemic infarcts of the cortex, often also affecting the white matter immediately below. The infarcts are not limited by the usual vascular territories. About two-fifths of the ischemic damage occurs within ~ 48 h; the remaining three-fifths are delayed (within ~ 3 weeks). Using neuromonitoring technology in combination with longitudinal neuroimaging, the entire sequence of both early and delayed cortical infarct development after subarachnoid hemorrhage has recently been recorded in patients. Characteristically, cortical infarcts are caused by acute severe vasospastic events, so-called spreading ischemia, triggered by spontaneously occurring spreading depolarization. In locations where a spreading depolarization passes through, cerebral blood flow can drastically drop within a few seconds and remain suppressed for minutes or even hours, often followed by high-amplitude, sustained hyperemia. In spreading depolarization, neurons lead the event, and the other cells of the neurovascular unit (endothelium, vascular smooth muscle, pericytes, astrocytes, microglia, oligodendrocytes) follow. However, dysregulation in cells of all three supersystems-nervous, vascular, and immune-is very likely involved in the dysfunction of the neurovascular unit underlying spreading ischemia. It is assumed that subarachnoid blood, which lies directly on the cortex and enters the parenchyma via glymphatic channels, triggers these dysregulations. This review discusses the neuroglial, neurovascular, and neuroimmunological dysregulations in the context of spreading depolarization and spreading ischemia as critical elements in the pathogenesis of cortical infarcts after subarachnoid hemorrhage.

Keywords: Delayed cerebral ischemia; Neuromonitoring; Spreading depolarization; Stroke; Subarachnoid hemorrhage; Vasospasm.


Conflict of interest statement

Declarations. Competing interests: The authors declare no competing interests. Ethical Approval: All procedures performed involving patients were in accordance with the ethical standards of the institutional research committees and with the 1964 Helsinki Declaration and its later amendments. Either informed consent or surrogate informed consent was obtained for all patients. Conflict of Interest: The authors declare no competing interests.

Figures

Fig. 1
Fig. 1
Autopsy case of an 80-year-old female patient with subarachnoid hemorrhage resulting from the rupture of an anterior communicating artery aneurysm. On admission, the patient was comatose and showed signs of decerebrate rigidity (World Federation of Neurosurgical Societies (WFNS) [212] scale 5). The initial CT demonstrated basal subarachnoid hemorrhage with involvement of the ventricles (modified Fisher grade 4 [213]). She remained comatose during the further clinical course and died 25 days after the initial hemorrhage under palliative care. The autopsy revealed an extensive subarachnoid hemorrhage with a punctum maximum in the basal cisterns. The cerebral convexities were also partially covered with blood. Specimens were taken at predefined locations, formalin-fixed and paraffin-embedded. a, b Hematoxylin and eosin-stained sections of the left frontolateral cortex. This area was covered with subarachnoid blood. a A wedge-shaped cortical irregularity with its base at the cortical surface. At higher magnification (inset), massive infiltration of macrophages, extensive neo-vascularization, and neuronal loss were seen. These findings are consistent with a subacute cortical infarct adjacent to a thick sulcal blood clot (right upper corner) (scale bar = 1 mm; scale bar inset = 100 µm). b Normal appearing cortex adjacent to a thinner sulcal blood clot (right upper corner). At higher magnification (inset), the normal neuronal somata are clearly visible (scale bar = 1 mm; scale bar inset = 100 µm)
Fig. 2
Fig. 2
a Representative CT and MR images of a 61-year-old female patient with subarachnoid hemorrhage resulting from rupture of an aneurysm of the left middle cerebral artery (MCA). All images were aligned to the T1 scan of the MRI on day 14 after the initial hemorrhage. The first three CT images from the left show an axial section at the level of the third ventricle. The CT image in the top row on the far right and the MR images in the bottom row show a section of the brain at the level of the basal ganglia (+ 6 mm in the direction of the vertex in comparison to the first three CT images). The initial CT on admission (CT day 0 pre-op = CT1 in b) demonstrated subarachnoid hemorrhage and massive intraventricular hemorrhage that extended into the left cerebral parenchyma. On the same day, a second CT was performed after surgical clipping of the aneurysm, placement of a subdural electrode strip over the left frontolateral cortex, and evacuation of the intracerebral hematoma. Electrodes 2–5 are marked in red. Electrodes 1 and 6 are not shown. The CT (CT day 0 post-op = CT2) revealed perifocal edema surrounding the evacuated intracerebral hemorrhage. Furthermore, the left frontal cortex showed a subtle hypodensity between electrodes 2 and 3. The hypodensity only became clearly visible on the CT of day 4 (= CT5 in b) (asterisk). These findings are consistent with a cortical infarct developing in the early phase after the initial hemorrhage. Of note, CT imaging on day 4 (far right image in the upper panel) already demonstrated some sulcal effacement in the left hemisphere. On day 7, digital subtraction angiography (DSA) was performed (not shown). Visual assessment of the left arteriogram yielded mild vasospasm of the internal carotid artery and posterior circulation (basilar artery, P1 and P2 segment of the left posterior cerebral artery (PCA)). Moderate vasospasm was found in the proximal and distal segments of the MCA and the anterior cerebral artery. MR imaging on day 14 showed contrast enhancement of the early infarcted cortex between electrodes 2 and 3 (CE T1 day 14). Posteriorly, the cortex of the left insula and the left operculum adjacent to electrodes 4–6 showed marked increase in signal intensity compared to the right hemisphere on fluid-attenuated inversion recovery imaging (FLAIR day 14) and a decrease in signal intensity on T1 imaging (CE T1 day 14). The interpretation of these signal alterations is challenging. As pseudonormalization occurs on images of the apparent diffusion coefficient (ADC) in cerebral infarction after ~ 10 days [214], the lack of ADC alterations in the left insular and opercular cortex may indicate subacute infarction that developed around day 4. However, this is somewhat contradicted by the fact that no contrast enhancement of the cortex was seen (CE T1 day 14), which is typical of infarction after ~ 10 days [214]. We therefore favor the diagnosis of incomplete infarction in the left insular and opercular cortex adjacent to electrodes 4–6. Further posteriorly, FLAIR imaging (FLAIR day 14) and diffusion-weighted imaging (DWI day 14) showed a large hyperintense area that was hypointense in the ADC images and included the left posterior MCA territory and the part of the convexity supplied by the left PCA, including the occipital pole [215]. In other words, this delayed infarct involving gray and white matter was not limited by the boundaries of the normal vascular territories. It may be added that the DSA showed no fetal-type PCA. Ancillary findings were small scattered delayed cerebral infarcts in the right MCA territory and a mixture of cytotoxic and vasogenic edema surrounding the evacuated intracerebral hemorrhage. b Time course of focal brain damage and spreading depolarization (SD)-variables in the same patient as in a. The upper row 1 in b shows the progression of focal brain damage from CT1 to CT5 to the MRI on day 14 based on manual neuroimage segmentation of the hemisphere ipsilateral to the recording strip [2]. Rows 2 and 3 below show the time course of the SD variables: For each day, SDs were counted, and depression durations were scored to determine the total duration of SD-induced activity depression per recording day (TDDD) (row 2) and the total number of SDs per recording day (row 3). The peak TDDD (PTDDD) and peak SDs/day (peakSD) were defined for each patient as the maximal values among all recording days (indicated as a dark gray and dark blue bar, respectively). As can be seen, the delayed SD cluster began on day 4 and reached its maximum on day 6, i.e., in the temporal phase in which the delayed infarct development can be assumed on the basis of the neuroimaging in a
Fig. 3
Fig. 3
A cluster of spreading depolarizations (SD) precedes the development of the large delayed ischemic infarct that is shown in Fig. 2 between the CT scan on day 4 and the MRI scan on day 14. Traces 1–3 give the raw direct current (DC)/alternating current (AC)-electrocorticography (ECoG) recordings (band-pass, 0–45 Hz), demonstrating the propagation of the negative DC shifts along the cortex from electrode to electrode, which identify the SDs. The ECoG traces are oriented according to the convention of electroencephalography (EEG) with negativity up and positivity down. The distance between two neighboring electrodes is always 1 cm. This section of the cluster begins at the start of day 6 with three separate SDs, the first of which starts at electrode 3, the second at electrode 5, and the third at electrode 4. The third SD leads to a compaction of the cluster with SDs that merge into one another at electrodes 3 and 4. At electrode 4 and to a certain extent also at electrode 3, these later SDs are superimposed on a negative ultraslow potential (NUP) (current sink), while the SDs at electrode 5 remain more clearly separated from each other, retain their high amplitudes, and are superimposed on a positive ultraslow potential (current source). The traces at electrodes 3 and 4 are therefore typical for an area where ischemic damage develops, while the trace at electrode 5 is typical for a more peripheral area of damage development [20]. This is also supported by the changes in spontaneous brain activity. The depressive effect of the SDs on the spontaneous activity is assessed in traces 4–6 using the integral of the power in the AC frequency band between 0.5 and 45 Hz (red asterisks mark the onsets of SD-induced spreading depression) [99]. While there is a recovery of spontaneous brain activity after the first two SDs at all three electrodes, the third SD leads to a persistent depression of spontaneous activity. In contrast to electrodes 3 and 4, there is then a spontaneous recovery of brain activity at electrode 5 a little less than 4 h after the start of the third SD, which supports the hypothesis that the electrophysiological events at this electrode were less severe than at electrodes 3 and 4. The whole course of the SD-induced depressions is shown in Fig. 2b. The intracranial pressure (ICP) was measured via an external ventricular drain (EVD) (trace 7) and the arterial pressure via a catheter in the radial artery (trace 8). The fluctuations in the ICP result from short-term opening of the EVD
Fig. 4
Fig. 4
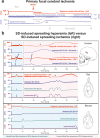
a The characteristic pathophysiological sequence of events in the rat after filament occlusion of the middle cerebral artery (MCAO). Trace 1 from top to bottom gives regional cerebral blood flow (rCBF). The first reaction to filament occlusion is the steep drop in rCBF. Trace 2 shows the spontaneous brain activity using alternating current (AC)-electrocorticography (ECoG) (band-pass, 0.5–45 Hz). The primary focal ischemia triggers a rapidly developing reduction in the amplitudes of spontaneous brain activity within a few seconds, which typically begins practically simultaneously in the entire ischemic region (= nonspreading depression of activity) [2, 20, 23]. The ECoG traces are oriented according to the convention of electroencephalography (EEG) with negativity up and positivity down. Trace 3 gives an epidural direct current (DC)/AC-ECoG recording (band-pass, 0–45 Hz) where spreading depolarization (SD) is observed as a large negative DC shift with a delay of 1 min after the onset of the primary focal ischemia. These original recordings emphasize again that in primary focal ischemia, the first SD in the region of minimal perfusion typically occurs 1 min or later after the onset of ischemia, as there is obviously still sufficient ATP for the membrane pumps to prevent SD in the first minute(s) [, –220]. In addition, trace 2 shows that SD can no longer trigger spreading depression of spontaneous activity in the region of minimal perfusion, since spontaneous activity is already depressed by the previous occurrence of nonspreading depression of activity. b Normal rCBF responses to SD in naïve human, rat, and mouse (B57BL/6) cortex (left panels, light blue) and inverse rCBF responses to SD in human and rat cortex with disturbed neurovascular unit (NVU) (right panels, pink). In naïve human cortex, SD (dark blue arrow between negative DC shifts) induces predominant hyperemia (laser-Doppler flowmetry (LDF)) and lasts only a short time. In contrast, the panel at the top right shows an SD inducing a characteristic drop in rCBF typical of spreading ischemia (asterisk) after aneurysmal subarachnoid hemorrhage (aSAH). The spreading ischemia lasted for 50 min followed by marked, long-lasting hyperemia. Note that the durations of the negative DC shifts correlate well with the durations of the SD-induced hypoperfusions at the two different recording sites because decrease in perfusion and energy supply limits Na,K-ATPase activity and prolongs the depolarization [23]. The spreading ischemia was recorded on day 9 after aSAH [20]. The patient developed a delayed infarct at the recording site between two CT scans on days 8 and 12. On day 13, she died from the progressive brain infarctions. The panels below show that the phenomenologies of both normal spreading hyperemia and spreading ischemia in rats are indistinguishable from those in humans. In the rat, spreading ischemia resulted from an aSAH-mimicking model based on NO deprivation and elevated baseline extracellular potassium concentration [23, 72, 106]. The rCBF response to SD in naïve mouse cortex appears to start from a high baseline level and occupies an intermediate position between the normal and inverse responses of phylogenetically higher mammals. Extracellular potassium was recorded here with an ion-sensitive microelectrode
Fig. 5
Fig. 5
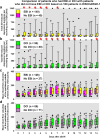
For each recording day, the respective total duration of activity depression induced by spreading depolarization (SD) of a recording day (TDDD) was compared between a patients with focal brain damage due to early brain injury (EBI) on the one hand and patients without focal brain damage due to EBI on the other hand and between b patients with focal brain damage due to delayed cerebral ischemia (DCI) on the one hand and patients without focal brain damage due to DCI on the other hand using Mann–Whitney rank sum tests and post-hoc Bonferroni correction. EBI was composed of focal brain damage due to intracerebral hemorrhage and early cerebral ischemia. Red asterisks indicate significant results after strict Bonferroni correction. c The comparison of mean blood flow velocities in the middle cerebral artery (MCA) ipsilateral to the subdural recording strip, measured by transcranial Doppler sonography (TCD), between patients with focal brain damage due to EBI compared to patients without focal brain damage due to EBI. d The comparison of mean blood flow velocities in the MCA between patients with focal brain damage due to DCI compared to patients without focal brain damage due to DCI. After strict Bonferroni correction, we could no longer detect any significant differences between the two groups compared in c and d, respectively. However, without strict Bonferroni correction, the mean velocities on the 15 days (= 15 tests) in d showed statistical differences between p = 0.0500 and p = 0.0033 on each day from day 6 to day 10 (= 5 tests). With 15 tests, only one uncorrected significant result is to be expected by chance. Since we observed significance in 5 out of 15 tests and then also on consecutive days, and considering that the statistical hypothesis tested is related to the same basic hypothesis—mean velocities correlate with delayed infarcts—one could argue that the Bonferroni correction is too conservative in this case. However, even without strict Bonferroni correction, it remains the case that the association of delayed infarcts with ECoG-measured TDDDs was stronger than their association with TCD-measured mean blood flow velocities
Fig. 6
Fig. 6
Subarachnoid hemorrhage (SAH) is associated with hemorrhage into the cerebrospinal fluid space. In 85% of cases, SAH results from a rupture of an aneurysm at a basal cerebral artery. Delayed cerebral ischemia is the most important in-hospital complication after aneurysmal SAH (aSAH) and can significantly worsen the prognosis of affected patients [221]. In addition to spreading depolarizations (SD), increased vascular tone and altered neurovascular reactivity, particularly of arteries and arterioles in the cerebral cortex, play an important role in the pathogenesis of DCI. It is assumed that these vascular changes are caused by factors of hemolysis such as higher-order heme degradation products. These include both propentdyopents (PDPs) and bilirubin oxidation end products (BOXes). In addition to their occurrence in the cerebrospinal fluid of aSAH patients, a vasoconstrictive effect on cerebral blood vessels has been demonstrated under in vitro and in vivo conditions in mouse models. The structural-chemical elucidation identified individual isomers within the substance classes of PDPs and BOXes, which can exist in a Z and E configuration. In the chemical conversion, UV light and visible light are involved. In the specific example of Z-BOX A, photoconversion into E-BOX A was accompanied by a loss of the vasoconstrictive effect
Fig. 7
Fig. 7
After the rupture of an aneurysm, blood leaks into the subarachnoid space, which is located between the pia mater and the arachnoid membrane and is therefore practically directly adjacent to the cortical brain tissue. In addition, the blood can also reach the parenchyma of the cortex via glymphatic channels. The spatial proximity between blood and cortex tissue could be of great importance, as almost 70% of focal brain damage detected in neuroimaging after aneurysmal subarachnoid hemorrhage (aSAH) involves the cortex. Following aSAH, a sequence of inflammatory reactions unfolds from the outer to the inner regions: in the brain’s microvascular system, there is a noticeable clustering of neutrophil granulocytes on the endothelium, driven by ICAM-1 on endothelial cells and PSGL-1 on neutrophils. Neutrophil extracellular traps (NETs) are released into the subarachnoid space ipsilateral to the hemorrhage shortly after the initial hemorrhage and gradually accumulate in the parenchyma over time, spreading to cortical and periventricular compartments distant from the maximum hemorrhage localization. Microglial accumulation and activation occur approximately 1 week following the injury, marked by their release of pro-inflammatory cytokines such as Il-6, TNF-alpha, and Il-1alpha/beta. This surge in microglial activity coincides with microglial-neuronal interactions in the cortex, leading to neuronal/axonal damage that is most pronounced from day 7 to day 14 after the initial hemorrhage

Similar articles

Cited by

References

    1. Connolly ES Jr, Rabinstein AA, Carhuapoma JR, Derdeyn CP, Dion J, Higashida RT, et al. Guidelines for the management of aneurysmal subarachnoid hemorrhage: a guideline for healthcare professionals from the American Heart Association/American Stroke Association. Stroke. 2012;43(6):1711–37. 10.1161/STR.0b013e3182587839. - PubMed
    1. Dreier JP, Winkler MKL, Major S, Horst V, Lublinsky S, Kola V, et al. Spreading depolarizations in ischaemia after subarachnoid haemorrhage, a diagnostic phase III study. Brain. 2022;145(4):1264–84. 10.1093/brain/awab457. - PubMed
    1. Horst V, Kola V, Lemale CL, Major S, Winkler MKL, Hecht N, et al. Spreading depolarization and angiographic spasm are separate mediators of delayed infarcts. Brain Commun. 2023;5(2):fcad080. 10.1093/braincomms/fcad080. - PMC - PubMed
    1. Birse SH, Tom MI. Incidence of cerebral infarction associated with ruptured intracranial aneurysms. A study of 8 unoperated cases of anterior cerebral aneurysm. Neurology. 1960;10:101–6. - PubMed
    1. Dreier JP, Sakowitz OW, Harder A, Zimmer C, Dirnagl U, Valdueza JM, Unterberg AW. Focal laminar cortical MR signal abnormalities after subarachnoid hemorrhage. Ann Neurol. 2002;52(6):825–9. 10.1002/ana.10383. - PubMed

MeSH terms

LinkOut - more resources