. 2024 Apr 30;25(1):427.
doi: 10.1186/s12864-024-10335-w.

NKX2-2 based nuclei sorting on frozen human archival pancreas enables the enrichment of islet endocrine populations for single-nucleus RNA sequencing

Affiliations

NKX2-2 based nuclei sorting on frozen human archival pancreas enables the enrichment of islet endocrine populations for single-nucleus RNA sequencing

Gengqiang Xie et al. BMC Genomics. .

Abstract

Background: Current approaches to profile the single-cell transcriptomics of human pancreatic endocrine cells almost exclusively rely on freshly isolated islets. However, human islets are limited in availability. Furthermore, the extensive processing steps during islet isolation and subsequent single cell dissolution might alter gene expressions. In this work, we report the development of a single-nucleus RNA sequencing (snRNA-seq) approach with targeted islet cell enrichment for endocrine-population focused transcriptomic profiling using frozen archival pancreatic tissues without islet isolation.

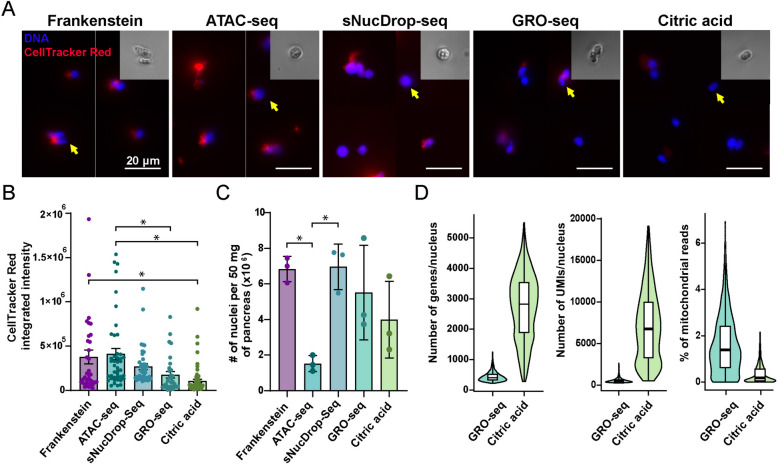
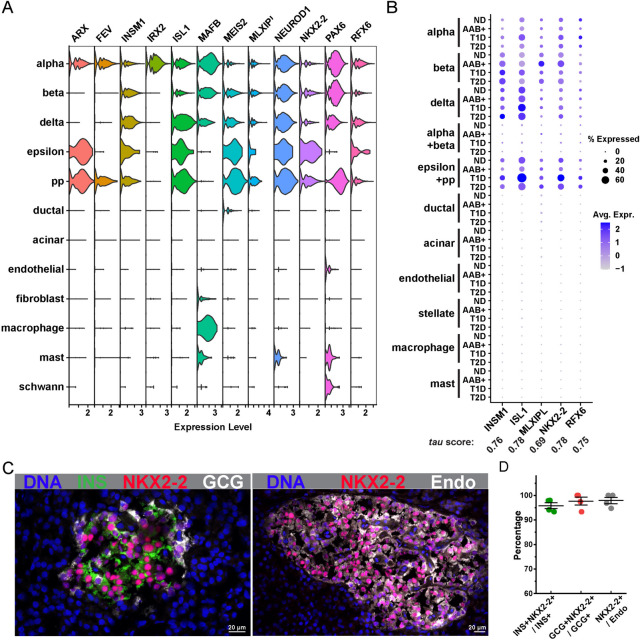
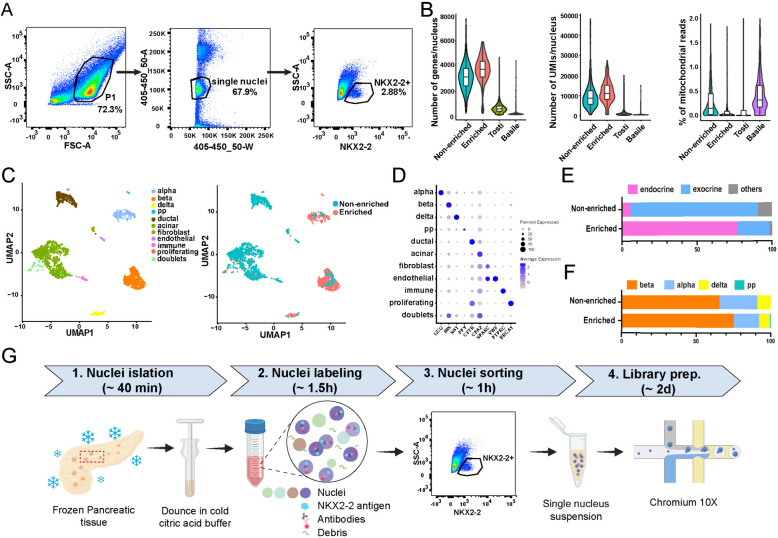
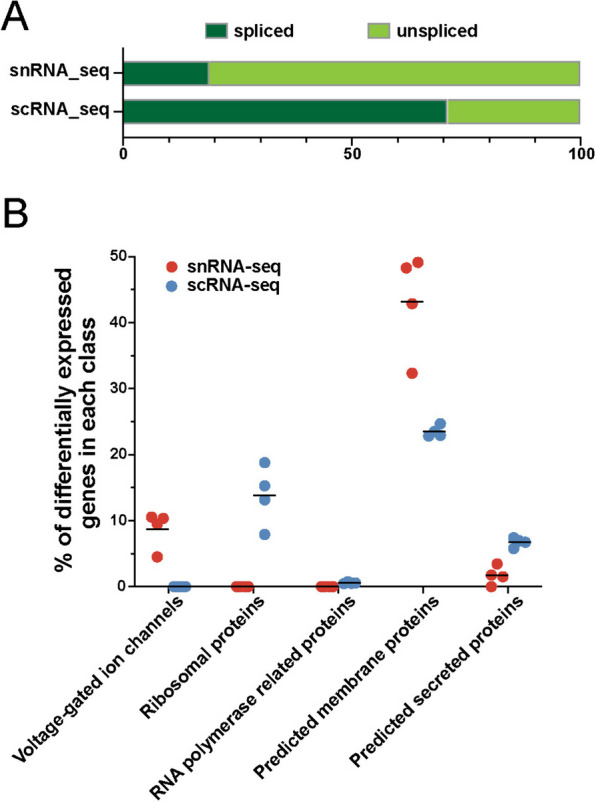
Results: We cross-compared five nuclei isolation protocols and selected the citric acid method as the best strategy to isolate nuclei with high RNA integrity and low cytoplasmic contamination from frozen archival human pancreata. We innovated fluorescence-activated nuclei sorting based on the positive signal of NKX2-2 antibody to enrich nuclei of the endocrine population from the entire nuclei pool of the pancreas. Our sample preparation procedure generated high-quality single-nucleus gene-expression libraries while preserving the endocrine population diversity. In comparison with single-cell RNA sequencing (scRNA-seq) library generated with live cells from freshly isolated human islets, the snRNA-seq library displayed comparable endocrine cellular composition and cell type signature gene expression. However, between these two types of libraries, differential enrichments of transcripts belonging to different functional classes could be observed.

Conclusions: Our work fills a technological gap and helps to unleash frozen archival pancreatic tissues for molecular profiling targeting the endocrine population. This study opens doors to retrospective mappings of endocrine cell dynamics in pancreatic tissues of complex histopathology. We expect that our protocol is applicable to enrich nuclei for transcriptomics studies from various populations in different types of frozen archival tissues.

Keywords: Endocrine population enrichment; Fluorescence-activated nuclei sorting (FANS); Frozen archival human pancreas; Islets; NKX2-2; Single-nucleus RNA-seq.


Conflict of interest statement

The authors declare no competing interests.

The authors declare no competing interests.

Figures

Fig. 1
Fig. 1
Citric acid method is the best method to isolate nuclei from frozen pancreata. A Cross-comparison of five different nuclei isolation protocols. Isolated nuclei were labeled with DAPI (DNA, blue) and CellTracker Red (red) and imaged under a 20× epifluorescent microscope. Scale bars correspond to 20 μm. Inserts show zoomed-in bright field images of the nuclei pointed by arrows. B Quantification of the CellTracker Red signals in nuclei isolated with different methods. * indicates adjusted P value < 0.05 with one way ANOVA and Tukey post hoc. GRO-seq and citric acid methods generate intact and high purity nuclei with the lowest cytoplasmic contaminations. C Nuclei yield from each isolation protocol, normalized to 50 mg of pancreatic tissue. Error bars indicate standard errors. * indicates adjusted P value < 0.05 with one way ANOVA and Tukey post hoc. D Violin plots showing distributions of the number of genes/nucleus, number of UMIs/nucleus, and percentage of mitochondrial reads in the snRNA-seq libraries with nuclei isolated with GRO-seq method or citric acid method. Box plots inside the violins display the distribution of the first quartile, median, and third quartile, as well as minimum and maximum
Fig. 2
Fig. 2
NKX2-2 as a pan-endocrine marker in the human pancreas across normal and different pathological conditions. (A) The RNA expression levels of top 12 endocrine-cell enriched transcription factors in different human pancreatic cell types. INSM1, ISL1, MLXIPL, NKX2-2, and RFX6 show exclusive and ubiquitous expressions in the endocrine cells. B Dot plot summarizes the expression of candidate endocrine markers in the pancreatic cells from controls (ND), autoantibody-positive (AAB+), T1D, and T2D donors. The size of the dot represents the percentage of cells expressing the marker genes, while the color of the dot indicates the average expression of the marker genes across all cells. Tau score for each marker is shown under the gene name. C Immunofluorescent labeling in the human pancreatic tissue confirms NKX2-2 as a pan-endocrine marker. Nuclei are labeled with DAPI (DNA, blue). Left, tissue is co-labeled with INSULIN (INS, green), NKX2-2 (red), and GLUCAGON (GCG, white). Right, tissue is co-labeled with NKX2-2 (red) and pan-endocrine cocktail (Endo, white) with a mixture of anti-INSULIN, GLUCAGON, SOMATOSTATIN, GHRELIN, and PANCREATIC POLYPEPTIDE antibodies. Scale bars correspond to 20 μm. D Quantification of the co-expression of NKX2-2 and endocrine markers. Each dot represents one individual islet
Fig. 3
Fig. 3
snRNA-seq with NKX2-2-based enrichment enables transcriptomic profiling of endocrine population from frozen archival human pancreata without islet isolation. A Sequential gating strategy to enrich nuclei from endocrine population by FANS. Nuclei are first gated in FSC and SSC (P1) to exclude debris and aggregates. Nuclei in P1 are then gated based on DAPI signal area versus width to select single nuclei. Endocrine nuclei are then selected and sorted based on the positive expression of NKX2-2. Population percentages from a representative experiment are shown next to each gate. B Composite violin and box plots showing distributions of the number of genes/nucleus, number of UMIs/nucleus, and percentage of mitochondrial reads in our snRNA-seq libraries with or without NKX2-2 based enrichment compared with Tosti et al. [32] and Basile et al. [25]. C UMAP embedding with cells colored according to cell type (left) and samples (right). D Dot plot illustrating the expression of marker genes in each cell type. E The proportions of endocrine and exocrine cells in the two snRNA-seq libraries. F Endocrine cell composition in the two snRNA-seq libraries. G The overall experimental workflow of snRNA-seq with islet-cell enrichment
Fig. 4
Fig. 4
Comparison of snRNA-seq and scRNA-seq libraries from the same donor. A Experimental design for generating endocrine population enriched snRNA-seq library from frozen human pancreas and scRNA-seq library from freshly isolated islets, both from the same donor. B Composite violin and box plots showing distributions of the number of genes/nucleus, number of UMIs/nucleus, and percentage of mitochondrial reads in the two libraries. C UMAP embedding with cells colored according to cell type (left) and samples (right). D Dot plot illustrating the expression of marker genes in each cell type in the snRNA-seq (left) and scRNA-seq (right) libraries. E Endocrine cell composition in the two libraries. F Heatmap showing the relative expression of cell type markers in the two libraries. n, snRNA-seq library. c, scRNA-seq library. The rows of the heatmap correspond to genes and columns to cells. Canonical markers of each cell type are extracted from van Gurp et al. [57] and labeled next to the corresponding row
Fig. 5
Fig. 5
Differences in transcriptomics captured between the snRNA-seq and scRNA-seq modalities. A Percentage of spliced/unspliced reads in each library. B Differential enrichment of genes in different functional classes between the two types of libraries. Each dot represents one of the four endocrine cell types (alpha, beta, delta, PP) in the snRNA-seq or scRNA-seq data. Y axis corresponds to the percentage of genes significantly higher expressed in snRNA-seq (red) or scRNA-seq (blue) dataset that belongs to each functional class. Only significantly differentially enriched functional classes are shown

Similar articles

References

    1. Ashcroft FM, Rorsman P. Diabetes mellitus and the β cell: the last ten years. Cell. 2012;148(6):1160–1171. doi: 10.1016/j.cell.2012.02.010. - DOI - PMC - PubMed
    1. Huising MO, van der Meulen T, Huang JL, Pourhosseinzadeh MS, Noguchi GM. The difference δ-cells make in glucose control. Physiology. 2018;33(6):403–411. doi: 10.1152/physiol.00029.2018. - DOI - PMC - PubMed
    1. Hædersdal S, Andersen A, Knop FK, Vilsbøll T. Revisiting the role of glucagon in health, diabetes mellitus and other metabolic diseases. Nat Rev Endocrinol. 2023;19(6):321–335. doi: 10.1038/s41574-023-00817-4. - DOI - PubMed
    1. Li J, Klughammer J, Farlik M, Penz T, Spittler A, Barbieux C, et al. Single-cell transcriptomes reveal characteristic features of human pancreatic islet cell types. EMBO Rep. 2016;17(2):178–187. doi: 10.15252/embr.201540946. - DOI - PMC - PubMed
    1. Wang YJ, Schug J, Won KJ, Liu C, Naji A, Avrahami D, et al. Single-cell transcriptomics of the human endocrine pancreas. Diabetes. 2016;65(10):3028–3038. doi: 10.2337/db16-0405. - DOI - PMC - PubMed