

Developing and validating a clinlabomics-based machine-learning model for early detection of retinal detachment in patients with high myopia
- PMID: 38689321
- PMCID: PMC11061938
- DOI: 10.1186/s12967-024-05131-9
Developing and validating a clinlabomics-based machine-learning model for early detection of retinal detachment in patients with high myopia
Abstract
Background: Retinal detachment (RD) is a vision-threatening disorder of significant severity. Individuals with high myopia (HM) face a 2 to 6 times higher risk of developing RD compared to non-myopes. The timely identification of high myopia-related retinal detachment (HMRD) is crucial for effective treatment and prevention of additional vision impairment. Consequently, our objective was to streamline and validate a machine-learning model based on clinical laboratory omics (clinlabomics) for the early detection of RD in HM patients.
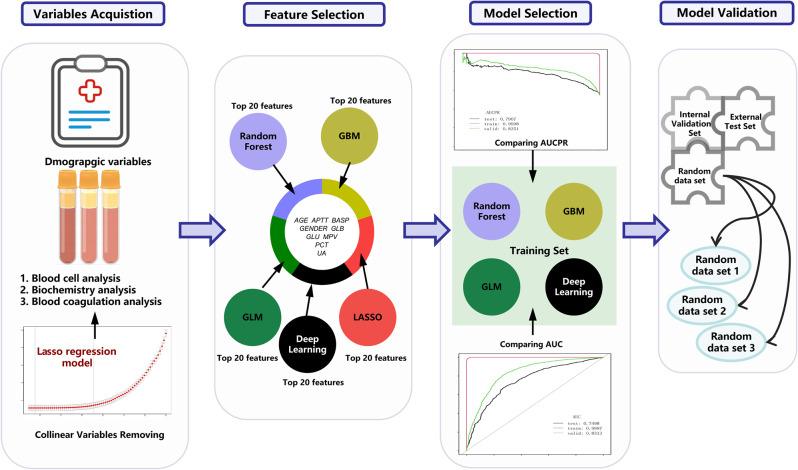
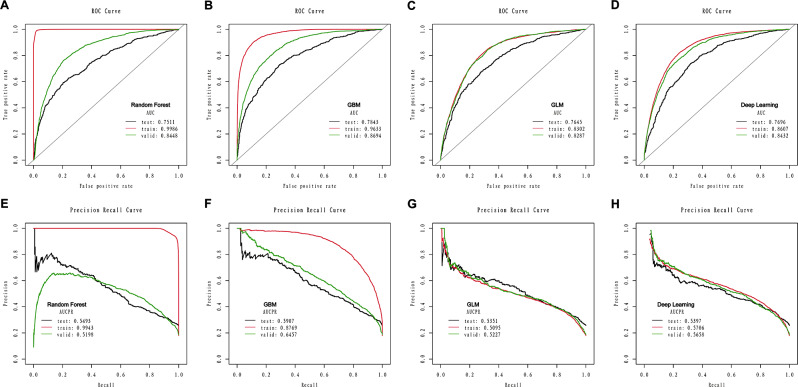
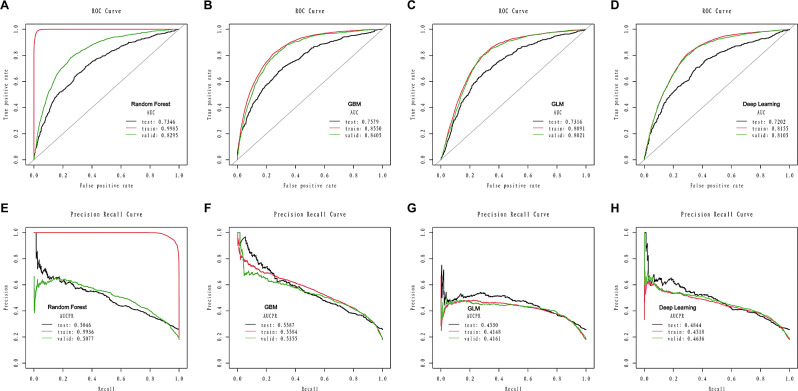
Methods: We extracted clinlabomics data from the electronic health records for 24,440 HM and 5607 HMRD between 2015 and 2022. Lasso regression analysis assessed fifty-nine variables, excluding collinear variables (variance inflation factor > 10). Four models based on random forest, gradient boosting machine (GBM), generalized linear model, and Deep Learning Model were trained for HMRD diagnosis and employed for internal validation. An external test of the models was done. Three random data sets were further processed to validate the performance of the diagnostic model. The primary outcomes were the area under the receiver operating characteristic curve (AUC) and the area under the precision-recall curve (AUCPR) to diagnose HMRD.
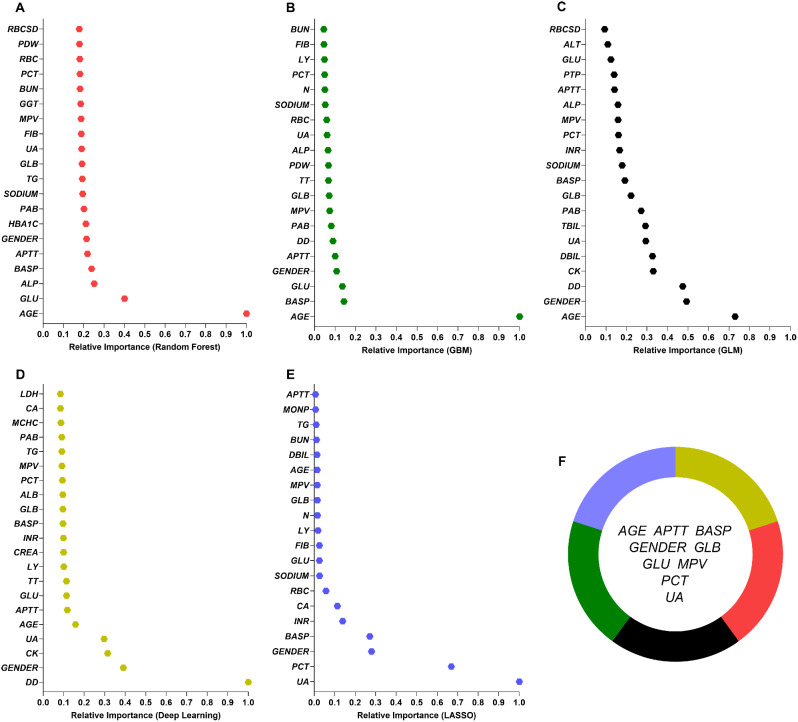
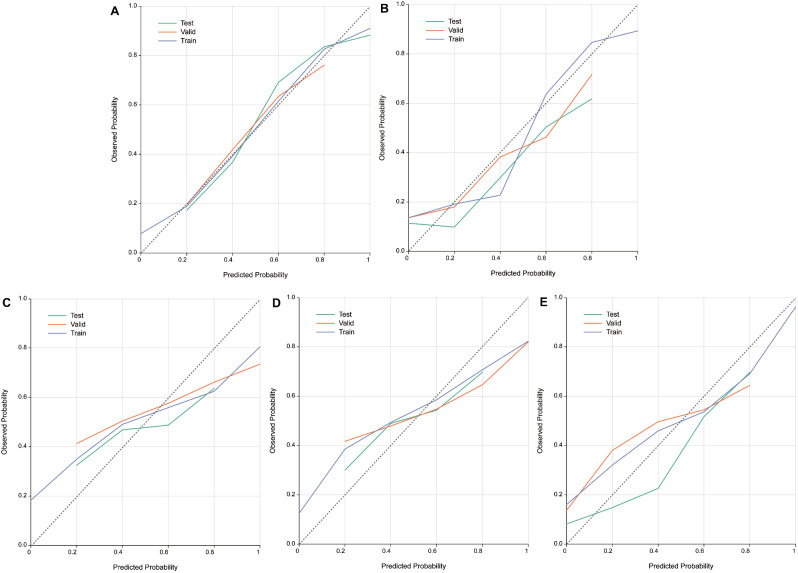
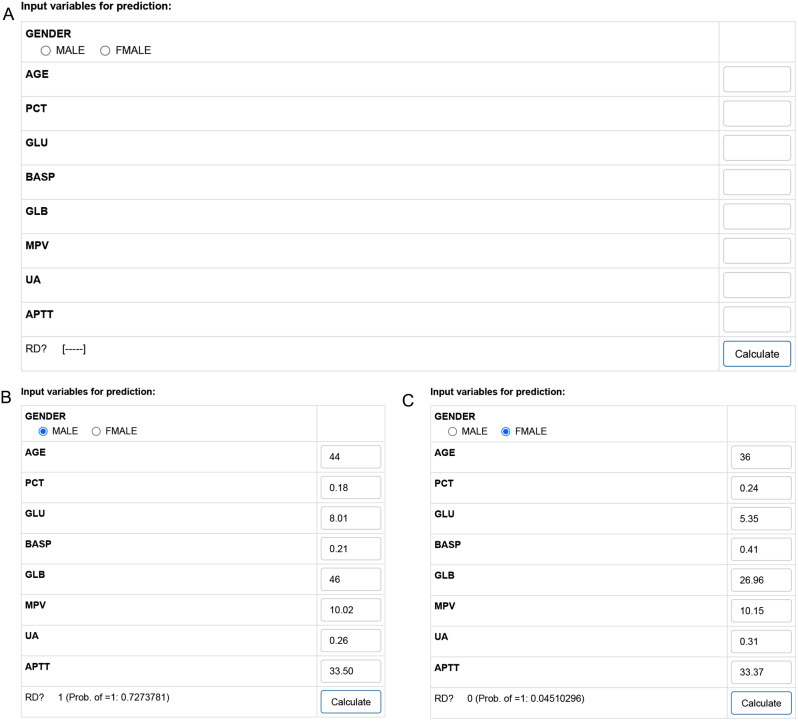
Results: Nine variables were selected by all models. Given the AUC and AUCPR values across the different sets, the GBM model was chosen as the final diagnostic model. The GBM model had an AUC of 0.8550 (95%CI = 0.8322-0.8967) and an AUCPR of 0.5584 (95%CI = 0.5250-0.5879) in the training set. The AUC and AUCPR in the internal validation were 0.8405 (95%CI = 0.8060-0.8966) and 0.5355 (95%CI = 0.4988-0.5732). During the external test evaluation, it reached an AUC of 0.7579 (95%CI = 0.7340-0.7840) and an AUCPR of 0.5587 (95%CI = 0.5345-0.5880). A similar discriminative capacity was observed in the three random data sets. The GBM model was well-calibrated across all the sets. The GBM-RD model was implemented into a web application that provides risk prediction for HM individuals.
Conclusion: GBM algorithms based on nine features successfully predicted the diagnosis of RD in patients with HM, which will help ophthalmologists to establish a preliminary diagnosis and to improve diagnostic accuracy in the clinic.
Keywords: Clinlabomics; Detection; High myopia; Machine-learning; Retinal detachment.
© 2024. The Author(s).
Conflict of interest statement
No conflicting relationship exists for any author.
Figures
Similar articles
-
Development and validation of a routine blood parameters-based model for screening the occurrence of retinal detachment in high myopia in the context of PPPM.EPMA J. 2023 Mar 15;14(2):219-233. doi: 10.1007/s13167-023-00319-3. eCollection 2023 Jun. EPMA J. 2023. PMID: 37275550 Free PMC article.
-
Can Predictive Modeling Tools Identify Patients at High Risk of Prolonged Opioid Use After ACL Reconstruction?Clin Orthop Relat Res. 2020 Jul;478(7):0-1618. doi: 10.1097/CORR.0000000000001251. Clin Orthop Relat Res. 2020. PMID: 32282466 Free PMC article.
-
Prediction of myopia development among Chinese school-aged children using refraction data from electronic medical records: A retrospective, multicentre machine learning study.PLoS Med. 2018 Nov 6;15(11):e1002674. doi: 10.1371/journal.pmed.1002674. eCollection 2018 Nov. PLoS Med. 2018. PMID: 30399150 Free PMC article.
-
Machine Learning Approach for Intraocular Disease Prediction Based on Aqueous Humor Immune Mediator Profiles.Ophthalmology. 2021 Aug;128(8):1197-1208. doi: 10.1016/j.ophtha.2021.01.019. Epub 2021 Jan 21. Ophthalmology. 2021. PMID: 33484732
-
Machine Learning Approaches in High Myopia: Systematic Review and Meta-Analysis.J Med Internet Res. 2025 Jan 3;27:e57644. doi: 10.2196/57644. J Med Internet Res. 2025. PMID: 39753217 Free PMC article.
Cited by
-
Research on the correlation between retinal vascular parameters and axial length in children using an AI-based fundus image analysis system.PLoS One. 2025 Jun 17;20(6):e0324352. doi: 10.1371/journal.pone.0324352. eCollection 2025. PLoS One. 2025. PMID: 40526760 Free PMC article.
-
Developing an interpretable machine learning predictive model of chronic obstructive pulmonary disease by serum PFAS concentration.Front Public Health. 2025 Jul 10;13:1602566. doi: 10.3389/fpubh.2025.1602566. eCollection 2025. Front Public Health. 2025. PMID: 40709045 Free PMC article.
-
Integrating serological and drainage fluid indicators: developing two predictive models for early detection of postoperative intra-abdominal infections in gastrointestinal tumor patients.Front Oncol. 2025 Apr 22;15:1566954. doi: 10.3389/fonc.2025.1566954. eCollection 2025. Front Oncol. 2025. PMID: 40330827 Free PMC article.
-
Advancing non-alcoholic fatty liver disease prediction: a comprehensive machine learning approach integrating SHAP interpretability and multi-cohort validation.Front Endocrinol (Lausanne). 2024 Oct 8;15:1450317. doi: 10.3389/fendo.2024.1450317. eCollection 2024. Front Endocrinol (Lausanne). 2024. PMID: 39439566 Free PMC article.
-
Ferroptosis: a novel mechanism of cell death in ophthalmic conditions.Front Immunol. 2024 Jun 27;15:1440309. doi: 10.3389/fimmu.2024.1440309. eCollection 2024. Front Immunol. 2024. PMID: 38994366 Free PMC article. Review.
References
Publication types
MeSH terms
LinkOut - more resources
Full Text Sources
Medical
Miscellaneous
