. 2024 May;20(5):3708-3821.
doi: 10.1002/alz.13809. Epub 2024 Apr 30.

2024 Alzheimer's disease facts and figures

No authors listed

2024 Alzheimer's disease facts and figures

No authors listed. Alzheimers Dement. 2024 May.

Abstract

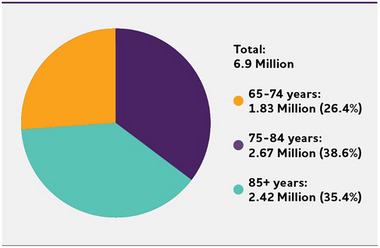
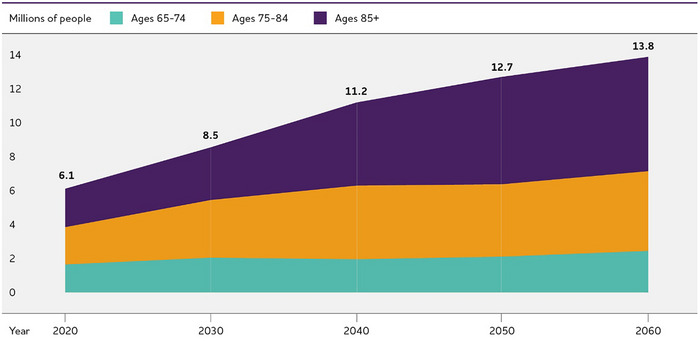
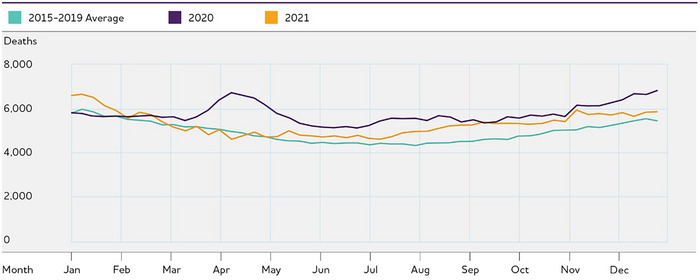
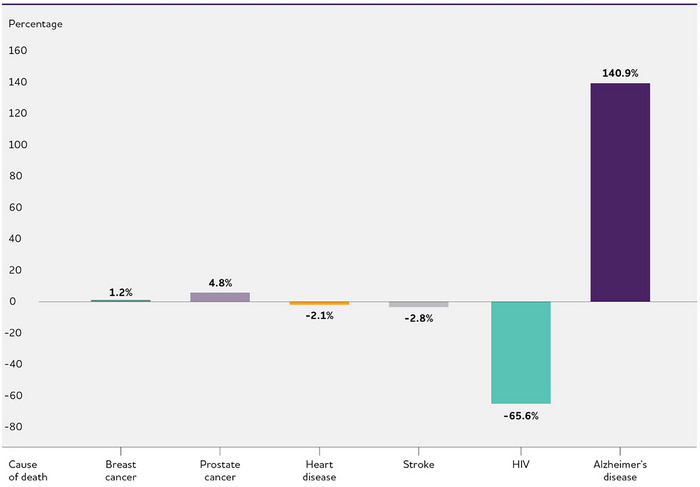
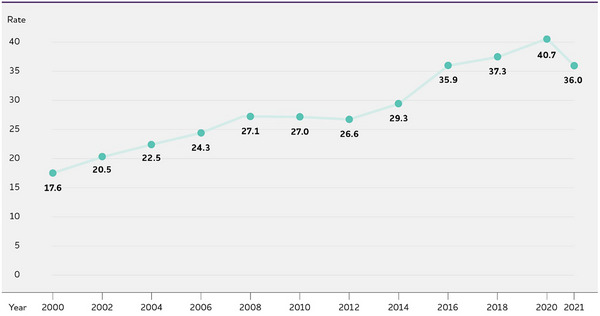
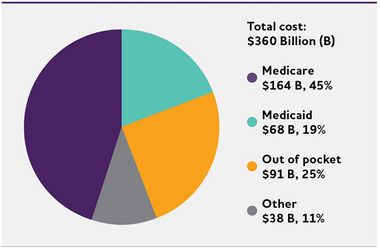
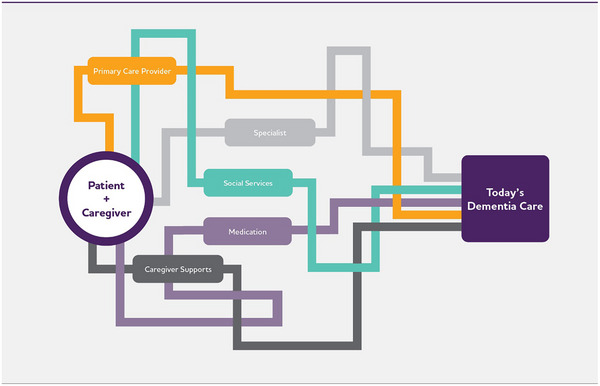
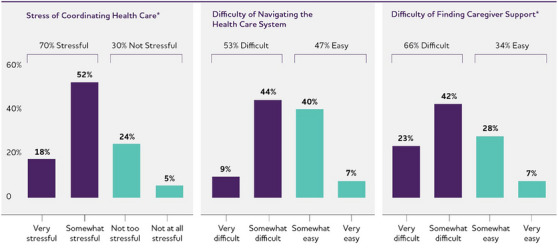
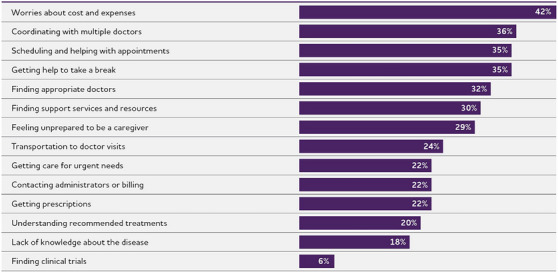
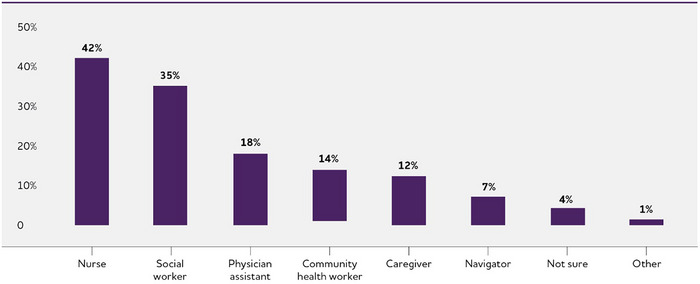
This article describes the public health impact of Alzheimer's disease (AD), including prevalence and incidence, mortality and morbidity, use and costs of care and the ramifications of AD for family caregivers, the dementia workforce and society. The Special Report discusses the larger health care system for older adults with cognitive issues, focusing on the role of caregivers and non-physician health care professionals. An estimated 6.9 million Americans age 65 and older are living with Alzheimer's dementia today. This number could grow to 13.8 million by 2060, barring the development of medical breakthroughs to prevent or cure AD. Official AD death certificates recorded 119,399 deaths from AD in 2021. In 2020 and 2021, when COVID-19 entered the ranks of the top ten causes of death, Alzheimer's was the seventh-leading cause of death in the United States. Official counts for more recent years are still being compiled. Alzheimer's remains the fifth-leading cause of death among Americans age 65 and older. Between 2000 and 2021, deaths from stroke, heart disease and HIV decreased, whereas reported deaths from AD increased more than 140%. More than 11 million family members and other unpaid caregivers provided an estimated 18.4 billion hours of care to people with Alzheimer's or other dementias in 2023. These figures reflect a decline in the number of caregivers compared with a decade earlier, as well as an increase in the amount of care provided by each remaining caregiver. Unpaid dementia caregiving was valued at $346.6 billion in 2023. Its costs, however, extend to unpaid caregivers' increased risk for emotional distress and negative mental and physical health outcomes. Members of the paid health care and broader community-based workforce are involved in diagnosing, treating and caring for people with dementia. However, the United States faces growing shortages across different segments of the dementia care workforce due to a combination of factors, including the absolute increase in the number of people living with dementia. Therefore, targeted programs and care delivery models will be needed to attract, better train and effectively deploy health care and community-based workers to provide dementia care. Average per-person Medicare payments for services to beneficiaries age 65 and older with AD or other dementias are almost three times as great as payments for beneficiaries without these conditions, and Medicaid payments are more than 22 times as great. Total payments in 2024 for health care, long-term care and hospice services for people age 65 and older with dementia are estimated to be $360 billion. The Special Report investigates how caregivers of older adults with cognitive issues interact with the health care system and examines the role non-physician health care professionals play in facilitating clinical care and access to community-based services and supports. It includes surveys of caregivers and health care workers, focusing on their experiences, challenges, awareness and perceptions of dementia care navigation.

Keywords: Alzheimer's dementia; Alzheimer's disease; Biomarkers; COVID‐19; Care navigation; Care navigator; Caregivers; Dementia; Dementia care navigation; Dementia workforce; Diagnostic criteria; Family caregiver; Health care costs; Health care expenditures; Health care professional; Health care utilization; Home and community‐based services; Incidence; Long‐term care costs; Long‐term care utilization; MCI due to Alzheimer's disease; Medicaid spending; Medicare spending; Mild cognitive impairment; Morbidity; Mortality; Navigator; Prevalence; Primary care physician; Risk factors.


Figures

FIGURE 1
FIGURE 1
Alzheimer's disease (AD) continuum. Although these arrows are of equal size, the components of the AD continuum are not equal in duration.
FIGURE 2
FIGURE 2
Number and ages of people 65 or older with Alzheimer's dementia, 2024. Percentages do not total 100 due to rounding. Created from data from Rajan et al. ,
FIGURE 3
FIGURE 3
Prevalence of Alzheimer's disease in the 50 U.S. states, including the 10 counties with the highest prevalence, 2020. Created from data from Dhana et al.
FIGURE 4
FIGURE 4
Estimated lifetime risk for Alzheimer's dementia, by sex, at ages 45 and 65. Created from data from Chene et al.
FIGURE 5
FIGURE 5
Projected number of people age 65 and older (total and by age) in the U.S. population with Alzheimer's dementia, 2020 to 2060. Created from data from Rajan et al. ,
FIGURE 6
FIGURE 6
Deaths due to Alzheimer's and other dementias in the United States in 2020 and 2021 compared with previous years. Data for 2021 are as of February 7, 2022. Created from data from the National Center for Health Statistics.
FIGURE 7
FIGURE 7
Percentage changes in selected causes of death (all ages) between 2000 and 2021. Created from data from the National Center for Health Statistics.,
FIGURE 8
FIGURE 8
U.S. annual Alzheimer's death rate (per 100,000 people) by year. Created from data from the National Center for Health Statistics.
FIGURE 9
FIGURE 9
Proportion of caregivers of people with Alzheimer's or other dementias versus caregivers of other older people who provide help with specific activities of daily living, United States, 2015. Created from data from the National Alliance for Caregiving in partnership with the Alzheimer's Association.
FIGURE 10
FIGURE 10
Percentage of caregivers who report high to very high stress due to caregiving. Created from data from the Alzheimer's Association.
FIGURE 11
FIGURE 11
Work‐related changes among caregivers of people with Alzheimer's or other dementias who had been employed at any time since they began caregiving. Created from data from the National Alliance for Caregiving in partnership with the Alzheimer's Association.
FIGURE 12
FIGURE 12
Person‐centered care delivery. Created from data from the Alzheimer's Association.
FIGURE 13
FIGURE 13
Distribution of aggregate costs of care by payment source for Americans age 65 and older with Alzheimer's or other dementias, 2023. Data are in 2023 dollars. Created from data from the Lewin Model. “Other” payment sources include private insurance, health maintenance organizations, other managed care organizations and uncompensated care. The sum of individual dollar amounts does not equal the total cost due to rounding.
FIGURE 14
FIGURE 14
Percentage changes in emergency department visits per 1,000 fee‐for‐service Medicare beneficiaries with selected health conditions between 2008 and 2018. Includes Medicare beneficiaries with a claims‐based diagnosis of each chronic condition. Beneficiaries may have more than one chronic condition. Created from data from U.S. Centers for Medicare & Medicaid Services.
FIGURE 15
FIGURE 15
Place of death due to Alzheimer's disease, 2002 to 2021. Created from data from the National Center for Health Statistics.,
FIGURE 16
FIGURE 16
Hospital stays per 1,000 Medicare beneficiaries age 65 and older with specified coexisting medical conditions, with and without Alzheimer's or other Dementias, 2019. Created from unpublished data from the National 100% Sample Medicare Fee‐for‐Service Beneficiaries for 2019.
FIGURE 17
FIGURE 17
Today's dementia care.
FIGURE 18
FIGURE 18
Difficulties and stressors that caregivers experience. *Percentages of bars may not total the percentages above due to rounding.
FIGURE 19
FIGURE 19
Stressors when getting health care for care recipients.
FIGURE 20
FIGURE 20
Navigator's professional role.
FIGURE 21
FIGURE 21
Preferred channels for communicating with a care navigator.
FIGURE 22
FIGURE 22
Access to care navigators with cultural competency by race/ethnicity of care recipient.
FIGURE 23
FIGURE 23
Health care professionals’ views on cultural competence.
FIGURE 24
FIGURE 24
Anticipated outcomes for care recipients of a navigator program.
FIGURE 25
FIGURE 25
Anticipated outcomes for caregivers of a navigator program.
FIGURE 26
FIGURE 26
Care navigator services that would be valuable to dementia caregivers.
FIGURE 27
FIGURE 27
Community‐based services that would be valuable to dementia caregivers.
FIGURE 28
FIGURE 28
Time spent on navigator‐type services and percentage of patients with cognitive issues receiving navigation services.
FIGURE 29
FIGURE 29
Focus of dementia care support provided.
FIGURE 30
FIGURE 30
Services provided that support dementia care for patients and their families.
FIGURE 31
FIGURE 31
Most valuable services in supporting dementia care for patients and their families.
FIGURE 32
FIGURE 32
Health care workers’ views on the effectiveness of dementia care navigation.
FIGURE 33
FIGURE 33
Barriers to dementia care navigation.
FIGURE 34
FIGURE 34
Professionals who help dementia patients and caregivers navigate health care.
FIGURE 35
FIGURE 35
The ideal future state of dementia care.

References

    1. Villemagne VL, Burnham S, Bourgeat P, et al. Amyloid ß deposition, neurodegeneration, and cognitive decline in sporadic Alzheimer's disease: A prospective cohort study. Lancet Neurol. 2013;12(4):357‐367. - PubMed
    1. Reiman EM, Quiroz YT, Fleisher AS, et al. Brain imaging and fluid biomarker analysis in young adults at genetic risk for autosomal dominant Alzheimer's disease in the presenilin 1 E280A kindred: A case‐control study. Lancet Neurol. 2012;11(2):1048‐1056. - PMC - PubMed
    1. Jack CR, Lowe VJ, Weigand SD, et al. Serial PiB and MRI in normal, mild cognitive impairment and Alzheimer's disease: Implications for sequence of pathological events in Alzheimer's disease. Brain. 2009;132:1355‐1365. - PMC - PubMed
    1. Bateman RJ, Xiong C, Benzinger TL, et al. Clinical and biomarker changes in dominantly inherited Alzheimer's disease. N Engl J Med. 2012;367(9):795‐804. - PMC - PubMed
    1. Gordon BA, Blazey TM, Su Y, et al. Spatial patterns of neuroimaging biomarker change in individuals from families with autosomal dominant Alzheimer's disease: A longitudinal study. Lancet Neurol. 2018;17(3):241‐250. - PMC - PubMed