. 2024 May;14(5):e1670.
doi: 10.1002/ctm2.1670.

WNT5B drives osteosarcoma stemness, chemoresistance and metastasis

Affiliations

WNT5B drives osteosarcoma stemness, chemoresistance and metastasis

Rachel S Perkins et al. Clin Transl Med. 2024 May.

Abstract

Background: Treatment for osteosarcoma, a paediatric bone cancer with no therapeutic advances in over three decades, is limited by a lack of targeted therapies. Osteosarcoma frequently metastasises to the lungs, and only 20% of patients survive 5 years after the diagnosis of metastatic disease. We found that WNT5B is the most abundant WNT expressed in osteosarcoma tumours and its expression correlates with metastasis, histologic subtype and reduced survival.

Methods: Using tumor-spheroids to model cancer stem-like cells, we performed qPCR, immunoblotting, and immunofluorescence to monitor changes in gene and protein expression. Additionally, we measured sphere size, migration and forming efficiency to monitor phenotypic changes. Therefore, we characterised WNT5B's relevance to cancer stem-like cells, metastasis, and chemoresistance and evaluated its potential as a therapeutic target.

Results: In osteosarcoma cell lines and patient-derived spheres, WNT5B is enriched in stem cells and induces the expression of the stemness gene SOX2. WNT5B promotes sphere size, sphere-forming efficiency, and cell proliferation, migration, and chemoresistance to methotrexate (but not cisplatin or doxorubicin) in spheres formed from conventional cell lines and patient-derived xenografts. In vivo, WNT5B increased osteosarcoma lung and liver metastasis and inhibited the glycosaminoglycan hyaluronic acid via upregulation of hyaluronidase 1 (HYAL1), leading to changes in the tumour microenvironment. Further, we identified that WNT5B mRNA and protein correlate with the receptor ROR1 in primary tumours. Targeting WNT5B through inhibition of WNT/ROR1 signalling with an antibody to ROR1 reduced stemness properties, including chemoresistance, sphere size and SOX2 expression.

Conclusions: Together, these data define WNT5B's role in driving osteosarcoma cancer stem cell expansion and methotrexate resistance and provide evidence that the WNT5B pathway is a promising candidate for treating osteosarcoma patients.

Key points: WNT5B expression is high in osteosarcoma stem cells leading to increased stem cell proliferation and migration through SOX2. WNT5B expression in stem cells increases rates of osteosarcoma metastasis to the lungs and liver in vivo. The hyaluronic acid degradation enzyme HYAL1 is regulated by WNT5B in osteosarcoma contributing to metastasis. Inhibition of WNT5B with a ROR1 antibody decreases osteosarcoma stemness.

Keywords: WNT5B; cancer stem cells; metastasis; osteosarcoma.


Conflict of interest statement

The authors declare no conflicts of interest.

Figures
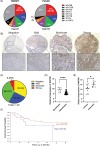
FIGURE 1
FIGURE 1
WNT5B is expressed in osteosarcoma patients and correlates with survival and metastasis. (A) Percentage of osteosarcoma (OS) patient samples expressing a WNT ligand. RNA sequencing data from the TARGET database, n = 97, and PeCan Data Portal, n = 107. (B) 4× and 20× images of WNT5B staining on osteosarcoma primary tumour tissue microarray (TMA), scale bar = 200 µm. n = 40. (C) Staining intensity scoring from the tissue microarray in (B). n = 40. (D) WNT5B expression analysis of osteosarcoma tumours sorted into subtypes, n = 62. ****p < .0001, data from Kuijjer et al. (E) WNT5B expression from global gene expression profiling of human osteosarcoma primary tumours vs. metastatic, n = 23. *p < .05, data from GSE32981. (F) Kaplan‒Meier survival curve of WNT5B in OS, data from R2: Genomics Analysis, Kuijjer et al. High WNT5B expression = blue line, low expression = red. Expression cutoff = 171.2; cutoff mode = scan. n = 86 total, n = 18 high, n = 68 low. *p < .05.
FIGURE 2
FIGURE 2
WNT5B expression is enhanced in osteosarcoma stem cells. (A) WNT5B expression in spheres (Sph) compared to adherent cells (Adh) by qPCR and normalised to ACTB, n = 3, *p < .05, ***p < .001. (B) WNT5B western blot in spheres (Sph) and adherent cells (Adh). Normalised to β‐Actin (ACTB), n = 3. (C) Quantification of western blots from (B), ***p < .001, **p < .01. (D) Immunofluorescence of 143B adherent cells and paraffin‐embedded spheres. Representative 40× microscopy images, WNT5B = green, DAPI nuclear stain = blue. Scale bar = 100 µm. (E) WNT5B expression analysis on RNA from two independent osteosarcoma PDX‐derived samples grown as adherent cell lines or spheres. qPCR normalised to ACTB, n = 3, ***p < .001.
FIGURE 3
FIGURE 3
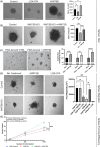
WNT5B drives osteosarcoma sphere size, sphere migration, and sphere‐forming efficiency. (A) 143B spheres treated with either 20 µM LGK‐974 or 10 ng/mL rWNT5B for 72 h. Sphere size quantified using ImageJ. n = > 40 spheres per group, *p < .05, Scale bar = 400 µm. (B) 143B Control and WNT5B KO spheres treated with 10 ng/mL rWNT5B for 72 h. Sphere area quantified using ImageJ, n = > 70 spheres per group, **p < .01, ***p < .001, scale bar = 400 µm. (C) Representative 10× microscopy images of osteosarcoma PDX‐derived spheres treated with 50 ng/mL rWNT5B compared to the untreated control, followed by ImageJ quantification of the sphere area. n = > 150 spheres per group, **p < .01, ***p < .001, ****p < .0001, scale bar = 400 µm. (D) 143B control and WNT5B KO spheres plated as single spheres in collagen‐coated wells and treated with either 10 ng/mL rWNT5B or 20 µM LGK‐974. Spheres were left to migrate onto the collagen for 24 h. Spheres were imaged at 10×, and the area of migration was quantified using ImageJ. n = average of 7 wells/group, *p < .05, **p < .01, scale bar = 400 µm. (E) 143B control (blue), WNT5B KO (red), and WNT5B KO + 10 ng/mL rWNT5B (green) cells were plated in sphere‐forming conditions in a limiting dilution and allowed to form spheres. Whole wells were scanned at 4×, and the sphere number was counted using Adobe Photoshop. Experiments were repeated three times with similar results, **p < .01, ***p < .001. KO, Knockout.
FIGURE 4
FIGURE 4
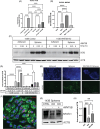
WNT5B induces the expression of SOX2. (A) 143B WNT5B KO spheres treated with 10 ng/mL rWNT5B for 6 h compared to untreated 143B WNT5B KO and 143B control spheres, Adh = adherent, Sph = sphere, qPCR normalised to ACTB, n = 3, ***p < .001, ****p < .0001. (B) MG63 spheres treated with 10 ng/mL rWNT5B or 20 µM LGK‐974 for 6 h, Adh = adherent, Sph = sphere, qPCR normalised to ACTB, n = 3, *p < .05, ***p < .001, ****p < .0001. (C) Western blot of the SOX2 expression in spheres and adherent 143B cells comparing control and WNT5B KO cells treated with 50 ng/mL rWNT5B for 15 min or 6 h. Normalised to β‐actin (ACTB), n = 3 experimental replicates. (D) Quantification of western blot from (C). *p < .05, **p < .01, ***p < .001, ****p < .0001. (E) Immunofluorescence of 143B adherent cells, 143B spheres, and 143B WNT5B KO spheres. 10× microscopy images, SOX2 = green, DAPI nuclear stain = blue. Scale bar = 400 µm. (F) Immunofluorescence of paraffin‐embedded 143B spheres. 40× images, WNT5B = green, SOX2 = red, DAPI nuclear stain = blue. Scale bar = 50 µm. (G) Western blots of NFATc1 and ACTB in 143B spheres comparing control, WNT5B KO, and WNT5B KO cells treated with 50 ng/mL rWNT5B for 15 min. (H) Quantification of western blots from (G). Normalised to β‐actin (ACTB), n = 3 experimental replicates. *p < .05, **p < .01, ***p < .001. KO, Knockout.
FIGURE 5
FIGURE 5
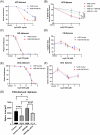
WNT5B regulates osteosarcoma chemoresistance to MTX. (A) Drug response curve of increasing doses of MTX on adherent 143B control and WNT5B KO cells. n = 3. ****p < .0001. (B) 143B control and WNT5B KO spheres treated with vehicle control, 10 ng/mL rWNT5B, 20 µM LGK‐974, and/or MTX at increasing doses. n = > 43 spheres per group. *p < .05, ****p < .0001. (C) Adherent 143B control and WNT5B KO cells treated with vehicle or CIS at increasing doses. n = 3. D) 143B sphere control and WNT5B KO cells treated with vehicle or CIS at increasing doses. n = > 82 spheres per group. (E) Adherent 143B control and WNT5B KO cells treated with vehicle or DOX at increasing doses. n = 3. (F) 143B sphere control and WNT5B KO cells treated with vehicle or DOX in increasing doses. n = > 93 spheres per group. (G) Patient‐derived spheres treated with 50 ng/mL rWNT5B and/or 1000 ng/mL MTX for 72 h. Sphere size quantified with ImageJ. n = > 170 spheres per group, *p < .05, ***p < .001, ****p < .0001. MTX, Methotrexate; KO, Knockout.
FIGURE 6
FIGURE 6
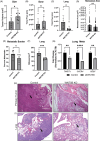
WNT5B enhances lung metastasis and cell density in vivo. (A) 143B control and WNT5B KO primary tumours at the last measured volume (cm3). n = 7 control, n = 9 WNT5B KO, *p < .05. (B) Ex vivo total flux (photons/second; p/s) measure of luciferase in bones immediately following dissection. n = 7 control, n = 9 WNT5B KO, ns = not significant. (C) Ex vivo total flux measure of lungs immediately following dissection. n = 7 control, n = 9 WNT5B KO, **p < .01. (D) Average area of all metastases from H&E staining of n = 7 control, n = 9 WNT5B KO mice, measured using ImageJ, **p < .01. (E) Percentage of total lung‐bearing metastasis (total metastatic area/total lung area × 100). n = 6 control, n = 9 WNT5B KO, *p < .05. (F) The average count of mitoses/mm2 from lung metastases in the control vs. WNT5B KO groups. n = 7 control, n = 9 WNT5B KO mice, ***p < .001. (G) qPCR analysis of osteosarcoma lung metastases from mice intratibially injected with 143B control or WNT5B knockdown (shWNT5B) cells. Primers are specific to human TWIST1, CXCR4, and VEGF. The qPCR was normalised to ACTB, n = 3. **p < .01, ****p < .0001. (H) 4× H&E staining images of primary bone tumours depicting cell density differences in the control vs. WNT5B KO groups. The arrow indicates an area of most visible density differences. Scale bar = 1000 µm. (I) 10× H&E staining images of metastatic lung tumours depicting metastatic size, total burden and cell density differences in the control vs. WNT5B KO groups. The arrow indicates an area of most visible density differences. Scale bar = 400 µm. KO, Knockout.
FIGURE 7
FIGURE 7
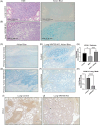
WNT5B inhibits GAG accumulation by increasing the expression of the GAG degradation enzyme HYAL1. (A,B) 100× (10× objective) comparison images of the lung metastases from control and WNT5B KO spheres in the same area between H&E and alcian blue staining. Scale bar = .100 mm. (C,D) 10× images of the primary tumours grown from control and WNT5B KO spheres stained with alcian blue. Scale bar = 400 µm. (E,F) 20× images of alcian blue stained lung WNT5B KO samples incubated with PBS (E) or 1 unit/mL hyaluronidase (F). Scale bar = 200 µm. (G) qPCR of HYAL1 from 143B control spheres compared to 143B WNT5B KO (5BKO) and 143B WNT5B KO spheres treated with 50 ng/mL rWNT5B for 6 h. The qPCR was normalised to ACTB, n = 3, *p < .05, ***p < .001. (H) qPCR analysis of osteosarcoma lung metastases from mice intratibially injected with 143B control or WNT5B knockdown (shWNT5B) adherent cells, primers specific to human HYAL1. The qPCR was normalised to ACTB, n = 3 control, n = 2 shWNT5B. ****p < .0001. (I,J) 10× images of lung metastases from control and WNT5B KO spheres stained with an antibody to HYAL1. Scale bar = 400 µm. GAG, Glycosaminoglycans; KO, knockout.
FIGURE 8
FIGURE 8
ROR1 is a therapeutic target for osteosarcoma stem cells. (A) Expression array correlation data showing a significantly positive correlation between WNT5B and ROR1 in osteosarcoma samples. Data were analysed using the R2 genomics analysis and visualization platform, and data generated by Kuijjer et al. n = 127, p < 3.5 × 10−14. (B) Representative images of immunohistochemistry on an osteosarcoma tissue microarray stained for ROR1 and WNT5B. Matched images from two samples, one low for both WNT5B and ROR1 and one high for both WNT5B and ROR1. n = 40 cores in duplicate, scale bar = 400 µm. (C) Correlation graph of osteosarcoma tissue microarray depicted in (B. Average immune reactive scoring of all WNT5B and ROR1 cores indicates a positive correlation between WNT5B and ROR1 in osteosarcoma patient samples. n = 40 cores, p = .0007. (D) Immunofluorescence of 143B adherent cells and spheres. 10× microscopy images, WNT5B = green, ROR1 = red, DAPI nuclear stain = blue. White arrows indicate areas of WNT5B/ROR1 colocalisation (yellow), scale bar = 400 µm. (E) 143B spheres treated with siRNA to ROR1 or scrambled siRNA for 72 h. Sphere size quantified using ImageJ. n = > 380 spheres per group, ****p < .0001. (F) 143B spheres treated with 100 µg/mL D10 and/or 50 ng/mL rWNT5B for 48 h. The sphere area was quantified using ImageJ. n ≥ 80 spheres per group, *p < .05. (G) 143B spheres treated with a low dose of (40 µg/mL) D10 and/or high dose (10 µg/mL) MTX for 48 h to assess reduction in chemoresistance. The sphere area was quantified using ImageJ. n ≥ 110 spheres per group, *p < .05, ****p < .0001. (H) PDX‐derived spheres treated with increasing doses (0, 10, 40, 100 µg/mL) of D10. Sphere area quantified using ImageJ. n ≥ 210 spheres per group, **p < .01. (I) SOX2 western blot of 143B spheres control, spheres treated with 40 µg/mL D10 for 48 h, and 143B WNT5B KO spheres. (J) ImageJ quantification of the western blot in (I). *p < .05, **p < .01, ns = not significant. Normalised to β‐Actin, n = 3 experimental replicates. PDX, Patient‐derived xenograft; MTX, methotrexate.

References

    1. Bielack SS, Hecker‐Nolting S, Blattmann C, Kager L. Advances in the management of osteosarcoma. F1000Res. 2016;5:2767. doi:10.12688/f1000research.9465.1 - DOI - PMC - PubMed
    1. Rojas GA, Hubbard AK, Diessner BJ, Ribeiro KB, Spector LG. International trends in incidence of osteosarcoma (1988–2012). Int J Cancer. 2021;149:1044‐1053. doi:10.1002/ijc.33673 - DOI - PMC - PubMed
    1. Kansara M, Teng MW, Smyth MJ, Thomas DM. Translational biology of osteosarcoma. Nat Rev Cancer. 2014;14:722‐735. doi:10.1038/nrc3838 - DOI - PubMed
    1. Longo‐Sorbello GS, Bertino JR. Current understanding of methotrexate pharmacology and efficacy in acute leukemias. Use of newer antifolates in clinical trials. Haematologica. 2001;86:121‐127. - PubMed
    1. Hattinger CM, Patrizio MP, Fantoni L, Casotti C, Riganti C, Serra M. Drug resistance in osteosarcoma: emerging biomarkers, therapeutic targets and treatment strategies. Cancers. 2021;13:2878. doi:10.3390/cancers13122878 - DOI - PMC - PubMed

Publication types

MeSH terms

Associated data

LinkOut - more resources