. 2024 May 24;9(5):2662-2672.
doi: 10.1021/acssensors.4c00527. Epub 2024 Apr 30.

Optimized Fabrication of Carbon-Fiber Microbiosensors for Codetection of Glucose and Dopamine in Brain Tissue

Affiliations

Optimized Fabrication of Carbon-Fiber Microbiosensors for Codetection of Glucose and Dopamine in Brain Tissue

Alexandra G Forderhase et al. ACS Sens. .

Abstract

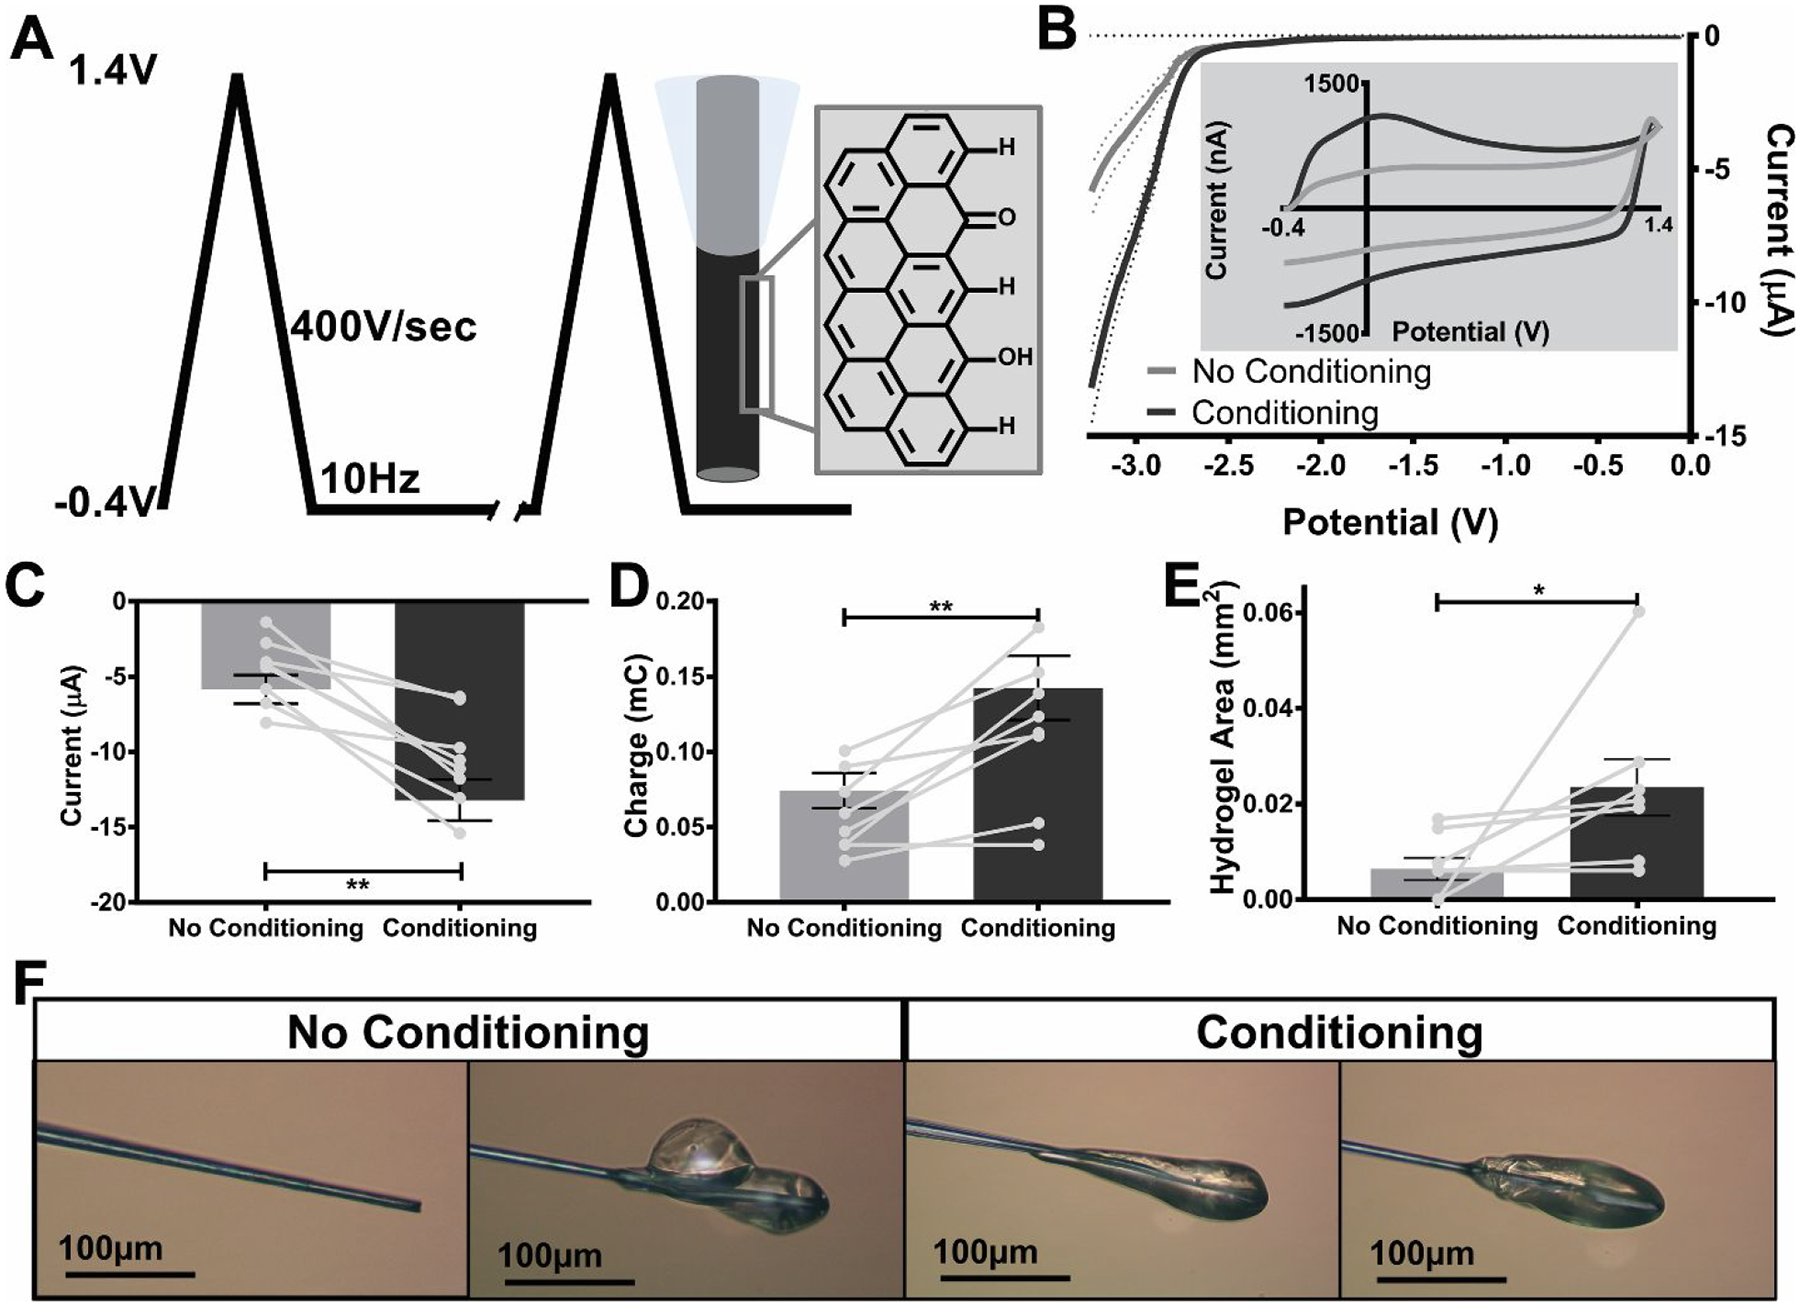
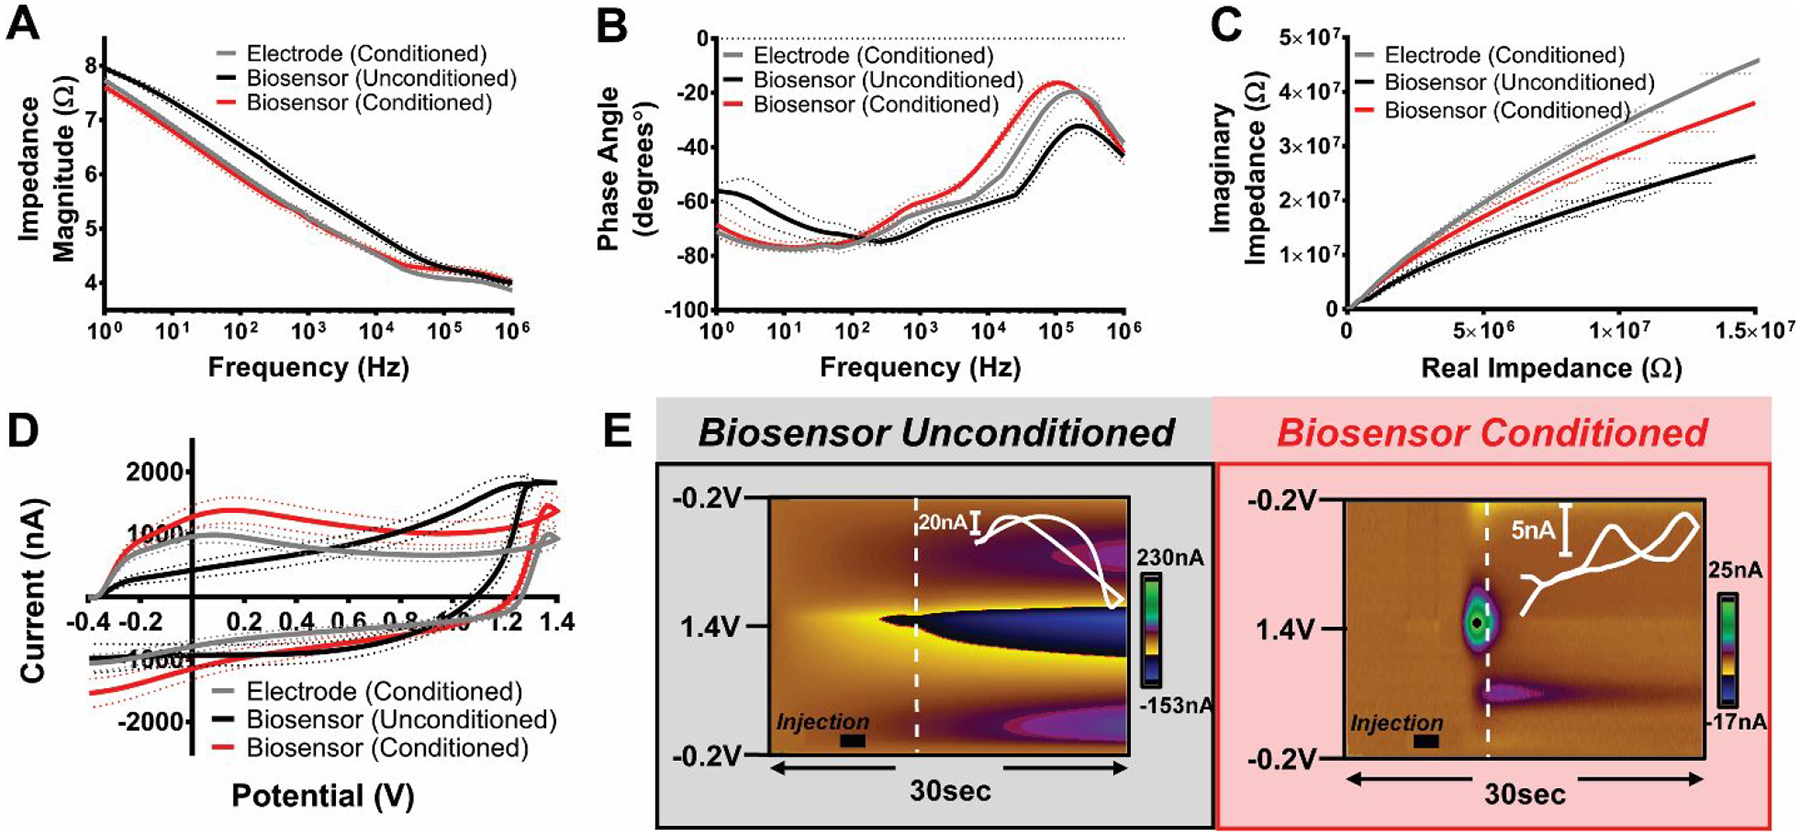
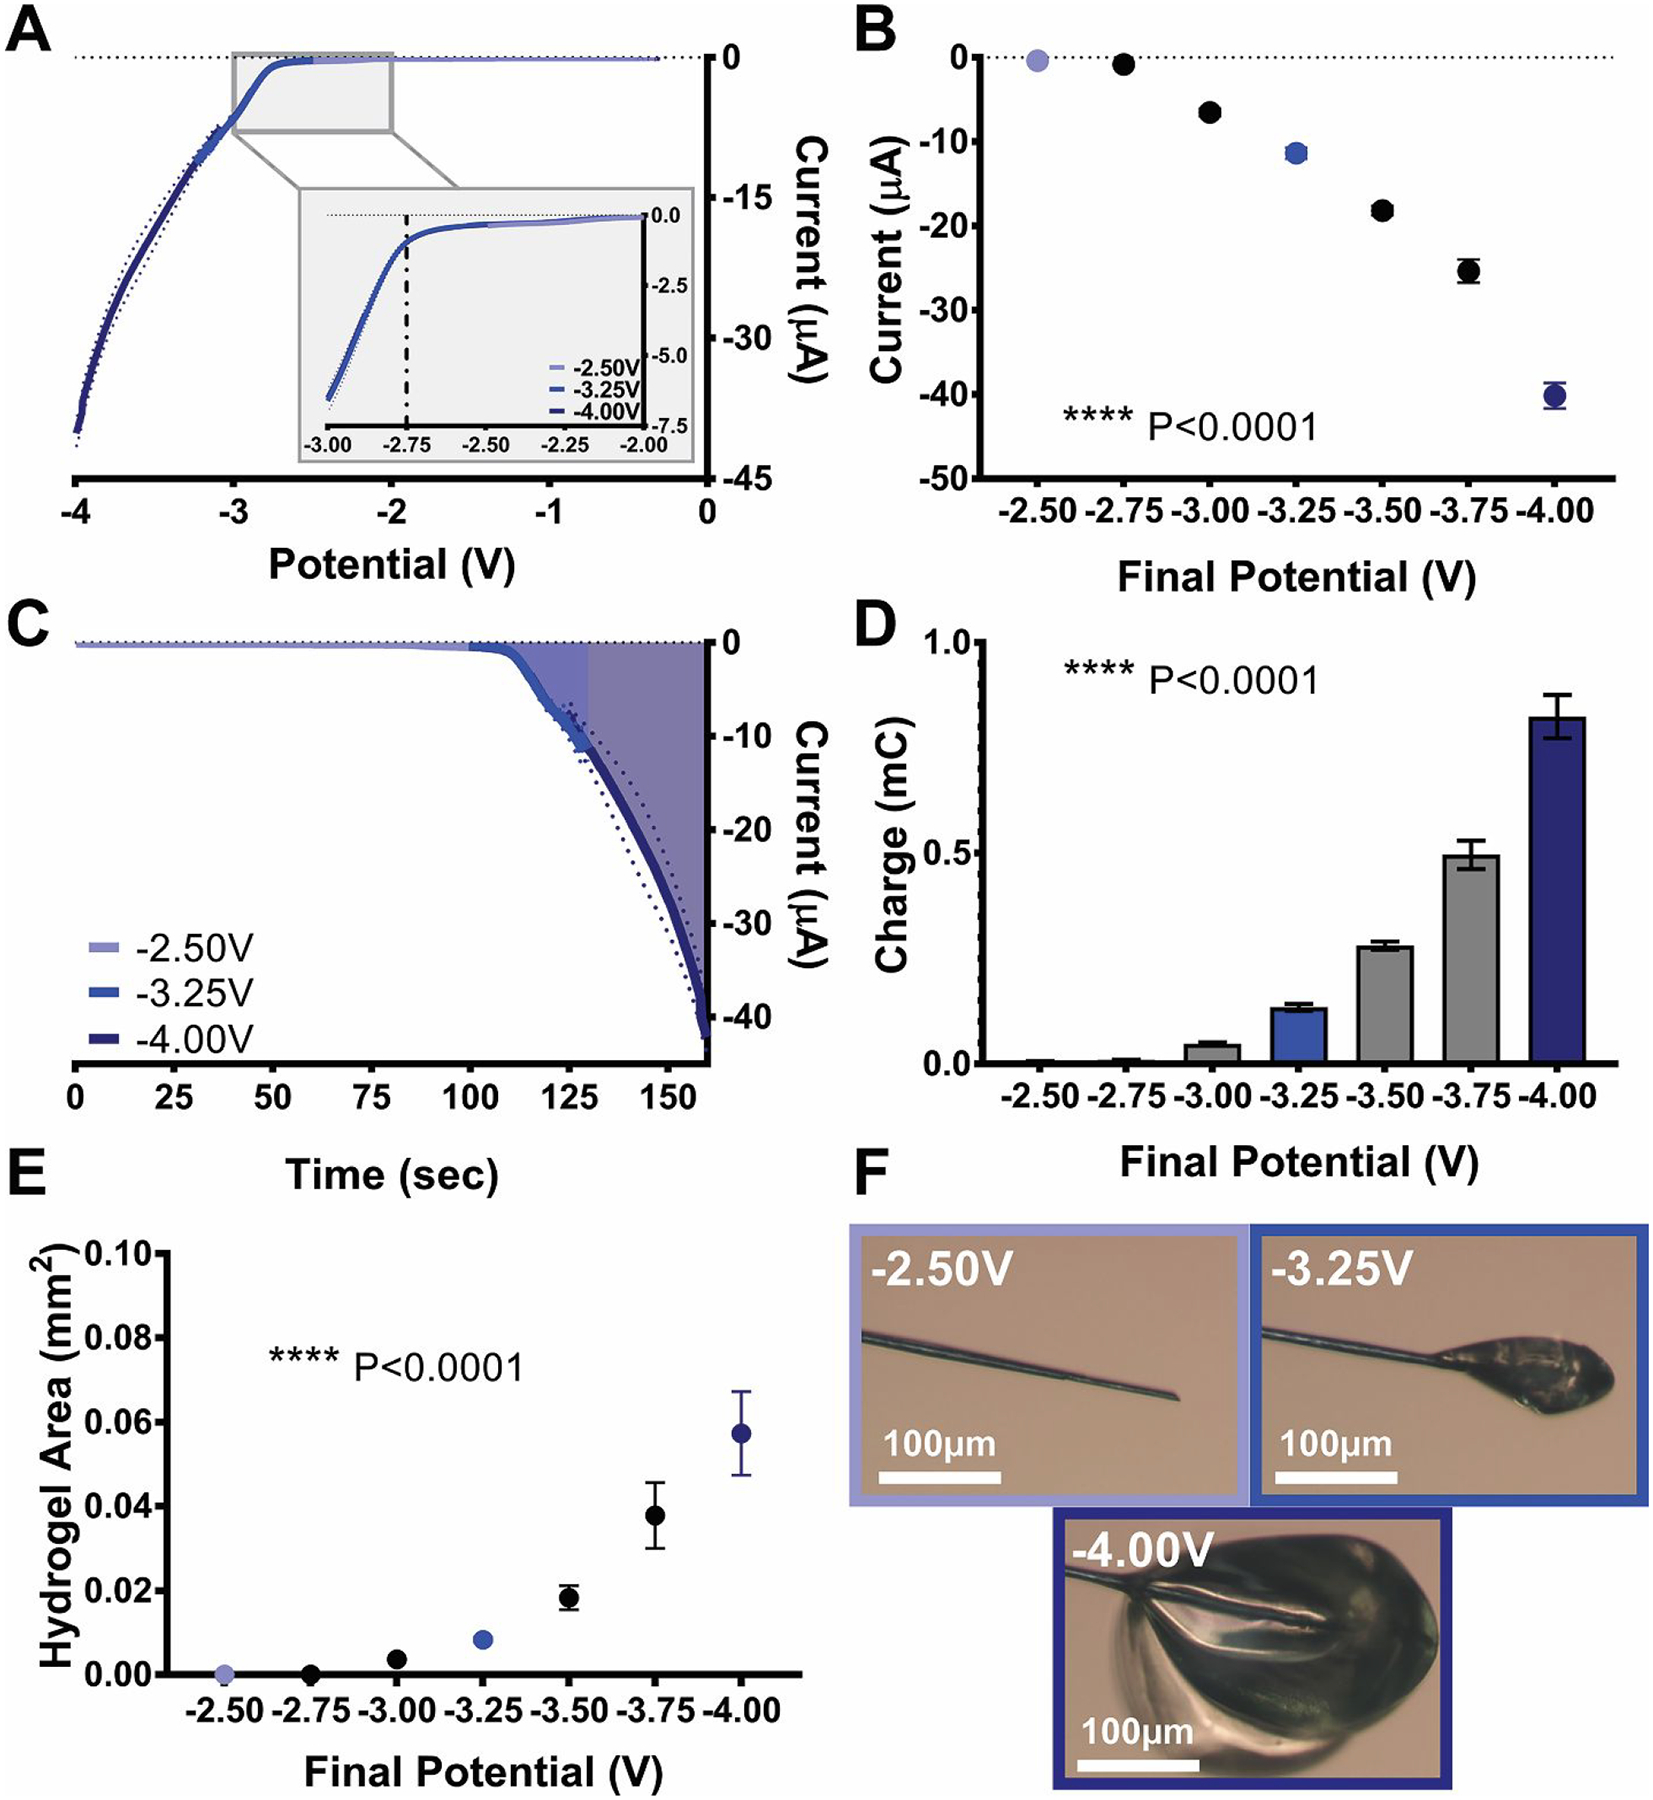
Dopamine (DA) signaling is critically important in striatal function, and this metabolically demanding process is fueled largely by glucose. However, DA and glucose are typically studied independently and, as such, the precise relationship between DA release and glucose availability remains unclear. Fast-scan cyclic voltammetry (FSCV) is commonly coupled with carbon-fiber microelectrodes to study DA transients. These microelectrodes can be modified with glucose oxidase (GOx) to generate microbiosensors capable of simultaneously quantifying real-time and physiologically relevant fluctuations of glucose, a nonelectrochemically active substrate, and DA, which is readily oxidized and reduced at the electrode surface. A chitosan hydrogel can be electrodeposited to entrap the oxidase enzyme on the sensor surface for stable, sensitive, and selective codetection of glucose and DA using FSCV. This strategy can also be used to entrap lactate oxidase on the carbon-fiber surface for codetection of lactate and DA. However, these custom probes are individually fabricated by hand, and performance is variable. This study characterizes the physical nature of the hydrogel and its effects on the acquired electrochemical data in the detection of glucose (2.6 mM) and DA (1 μM). The results demonstrate that the electrodeposition of the hydrogel membrane is improved using a linear potential sweep rather than a direct step to the target potential. Electrochemical impedance spectroscopy data relate information on the physical nature of the electrode/solution interface to the electrochemical performance of bare and enzyme-modified carbon-fiber microelectrodes. The electrodeposition waveform and scan rate were characterized for optimal membrane formation and performance. Finally, codetection of both DA/glucose and DA/lactate was demonstrated in intact rat striatum using probes fabricated according to the optimized protocol. Overall, this work improves the reliable fabrication of carbon-fiber microbiosensors for codetection of DA and important energetic substrates that are locally delivered to the recording site to meet metabolic demand.

Keywords: chitosan; electrodeposition; fast-scan cyclic voltammetry; hydrogel; hydrogen peroxide; oxidase.


Conflict of interest statement

This work was supported by the National Institute of Health (NIH R44MH119870), and NC State Department of Chemistry. The authors declare no competing interests.

Figures

Figure 1.
Figure 1.. Voltammetric co-detection of dopamine and glucose.
(A) GOx oxidizes glucose to gluconolactone at the biosensor surface in the presence of the enzyme co-substrate, oxygen (O2), which is simultaneously reduced to H2O2. Gluconolactone is ultimately hydrolyzed to gluconic acid. (B) Left: The voltammetric waveform (−0.2V to 1.4V, 400V/sec) allows for identification and quantification of DA (pink) and H2O2 (green) at the biosensor surface. The peak oxidation and reduction potential for each analyte is indicated with an asterisk. Right: The background-subtracted voltammograms reveal distinct contributions from DA (pink) and H2O2 (green). (C) The physical quality of biosensors fabricated using a classic potential step in the enzyme electrodeposition process is highly variable, with some sensors being of suitable quality (left) and some unsuitable (right).
Figure 2.
Figure 2.. Membrane quality is dependent on the electrodeposition waveform.
(A) Left: Potential is applied to the carbon-fiber microelectrode in acidic solution containing dissolved chitosan and GOx via a potential step (orange, top) or a linear scan (purple, bottom) to ~−23V. Right: Proton reduction locally raises solution pH. When the pH exceeds the pKa, chitosan is electrodeposited, entrapping the enzyme. (B) A scanning electron micrograph of an ideal biosensor, scale bar = 50 μm. (C) Representative brightfield images of biosensors fabricated using a potential step (orange, top) or a linear scan (purple, bottom) in electrodeposition. (D) Deposition using a potential step achieved a defect-free membrane in 50% of the biosensors. Using a linear scan increased the defect-free membrane formation to 68%.
Figure 3.
Figure 3.. Electrochemical pre-conditioning improves hydrogel formation.
(A) Electrochemical conditioning (-0.4 V to 1.4 V, 400 V/sec) oxidizes the carbon surface. (B) Linear-sweep voltammograms generated in enzyme deposition on electrodes with no prior conditioning (light grey) and pre-conditioned sensors (black, 0 V to −3.25 V, 25 mV/sec). Background voltammograms collected during conditioning are inset. The CVs generated at the pre-conditioned electrodes were larger than those generated at the unconditioned probes, indicative of a roughened surface area. Higher electrodeposition current (C) and charge (D) were generated on pre-conditioned sensors as compared to unconditioned probes. (E) The hydrogels generated on pre-conditioned sensors were larger, as determined by estimating the membrane area in bright-field images such as those shown in (F). Scale bar = 100 μm (*p<0.05, *p>0.0<0.01, Student’s t-test, n=8).
Figure 4.
Figure 4.. Electrochemical conditioning of the completed biosensor tunes the sensing interface.
(A) Electrochemical impedance, (B) phase angle, and (C) capacitive reactance are dependent on electrochemical conditioning; pre-conditioned carbon-fiber electrode (grey), the biosensor without any post-deposition conditioning (black), and the conditioned biosensor (red, n=6 for all groups). (D) Averaged background CVs collected using an unconditioned biosensor exhibited characteristics consistent with increased impedance and decreased reactance, as compared to the other groups. (E) Representative color plots comprised of raw, background-subtracted CVs for a bolus of glucose (2.6 mM) and DA (1 μM) detected in a benchtop flow cell using a biosensor before (left, gray) and after (right, red) electrochemical conditioning. The scale bar for current is shown to the right of each plot. Prior to conditioning, the data are dominated by a large shift in the background current (drift), which appears as a dark streak of current across the color plot. This obscured the faradaic signal generated in response to the analytes. After conditioning, electrochemical performance was greatly improved. The DA and glucose signals are evident as discrete spots on the plot that can be used to identify and quantify each species. In both plots, an individual CV is extracted at the time of the dashed vertical line and shown as an inset (white).
Figure 5.
Figure 5.. Hydrogel formation is dependent on the target potential.
Biosensors were fabricated using a linear-sweep electrodeposition (25 mV/sec) that ranged from 0 V to a final potential of −2.5 V to −4 V. (A) Averaged currents collected during electrodeposition using a final potential of −2.50 V (light blue), −3.25 V (medium blue), and −4.00 V (dark blue). An expanded view from −2 V to −3 V is inset. (B) The average current increased as the final potential was incrementally increased. (C) The amount of charge generated in electrodeposition is depicted in the shaded area of the representative recordings for each of the target potentials. (D) The charge generated was also dependent on the potential wavelimit. (E) Increasing the electrodeposition overpotential to more negative final values yielded larger hydrogels. (F) Representative images of biosensors fabricated with a wavelimit of −2.50 V (light blue), −3.25 V (blue), and −4.00 V (dark blue). Scale bar = 100 μm, ****p<0.0001, one-way ANOVA, n = 6.
Figure 6.
Figure 6.. Hydrogel size is dependent on electrodeposition scan rate.
Biosensors were fabricated using a waveform from 0 V to −3.25 V at scan rates of 5 – 75 mV/sec. (A) Averaged recordings obtained in electrodeposition were qualitatively similar across scan rates; 5 mV/sec (dark red), 25 mV/sec (medium red), and 75 mV/sec (light red), with electrodeposition waveforms inset. (B) Electrodeposition current was independent of scan rate (p>0.05). (C-D) By contrast, the charge generated in electrodeposition (shaded) was inversely proportional to scan rate, as shown in the averaged current verses time plots (C) and quantified in (D). (E) Slower scan rates yielded larger hydrogel membranes. (F) Representative images of biosensors fabricated using 5 mV/sec (dark red), 25 mV/sec (red), and 75 mV/sec (light red) electrodeposition scan rates. Scale bar = 100 μm, ****p<0.0001, one-way ANOVA, n=5.
Figure 7.
Figure 7.. Biosensor performance is dependent on hydrogel size.
(A) Top: Graphical depiction of biosensors fabricated using an electrodeposition waveform from 0V to −3.25V swept at 5 mV/sec (too big), 25 mV/sec (just right), and 75 mV/sec (too small). Bottom: Color plots of background-subtracted voltammograms collected in the detection of a mixture of glucose (2.6 mM) and DA (1 μM), introduced to the electrode in 2-sec long injections (black bar). Cyclic voltammograms extracted from the plots at the time of the dashed vertical line are inset in white. (B) Averaged maximum current collected in detection of 2.6 mM glucose. The biosensors fabricated using a scan rate of 25 mV/sec generated the largest response. (C) Averaged maximum current collected in detection of 1 μM DA. Biosensors fabricated using the 25 mV/sec and 75 mV/sec scan rates generated more current in response to DA than those fabricated with a 5 mV/sec electrodeposition waveform (***p<0.001, ****p<0.0001, one-way ANOVA with Tukey’s post-hoc test, n = 6).
Figure 8.
Figure 8.. Carbon-fiber microbiosensors - a tunable and generalizable tool.
The oxidase enzyme incorporated into biosensor design can be exchanged to allow for detection of other non-electroactive molecules. Left: Color plots of voltammetric data collected in the simultaneous detection of glucose (2.6 mM, green) and DA (1 μM, pink asterisk) in a benchtop flow cell (top) and in intact rat striatum (bottom, 60 Hz, 120 pulse stimulation of the midbrain). Right: When lactate oxidase is immobilized on the electrode surface (rather than GOx), H2O2 is generated in the presence of lactate (1 mM, right blue box) with simultaneous detection of DA (1 μM, pink asterisk). Cyclic voltammograms (white, inset) extracted from the plots at the time of the dashed vertical line allow for simultaneous identification and quantification of multiple molecules. Injection (top) or stimulation (bottom) times are denoted by a black bar (2 sec in length).

Similar articles

Cited by

References

    1. Hoyer S Abnormalities of Glucose Metabolism in Alzheimer’s Disease. Annals of the New York Academy of Sciences 1991, 640 (1), 53–58. 10.1111/j.1749-6632.1991.tb00190.x. - DOI - PubMed
    1. Blum K; Thanos PK; Gold MS Dopamine and Glucose, Obesity, and Reward Deficiency Syndrome. Front Psychol 2014, 5, 919. 10.3389/fpsyg.2014.00919. - DOI - PMC - PubMed
    1. Kuhl DE; Metter EJ; Riege WH Patterns of Local Cerebral Glucose Utilization Determined in Parkinson’s Disease by the [18F]Fluorodeoxyglucose Method. Ann Neurol. 1984, 15 (5), 419–424. 10.1002/ana.410150504. - DOI - PubMed
    1. Kalaria RN; Harik SI Reduced Glucose Transporter at the Blood-Brain Barrier and in Cerebral Cortex in Alzheimer Disease. J Neurochem 1989, 53 (4), 1083–1088. 10.1111/j.1471-4159.1989.tb07399.x. - DOI - PubMed
    1. Goldstein RZ; Leskovjan AC; Hoff AL; Hitzemann R; Bashan F; Khalsa SS; Wang G-J; Fowler JS; Volkow ND Severity of Neuropsychological Impairment in Cocaine and Alcohol Addiction: Association with Metabolism in the Prefrontal Cortex. Neuropsychologia 2004, 42 (11), 1447–1458. 10.1016/j.neuropsychologia.2004.04.002. - DOI - PubMed

Publication types

MeSH terms

LinkOut - more resources