. 2024 Jun;15(3):868-882.
doi: 10.1002/jcsm.13433. Epub 2024 Apr 30.

Metabolomic analysis of dietary-restriction-induced attenuation of sarcopenia in prematurely aging DNA repair-deficient mice

Affiliations

Metabolomic analysis of dietary-restriction-induced attenuation of sarcopenia in prematurely aging DNA repair-deficient mice

Yupeng He et al. J Cachexia Sarcopenia Muscle. 2024 Jun.

Abstract

Background: Sarcopenia is characterized by loss of skeletal muscle mass and function, and is a major risk factor for disability and independence in the elderly. Effective medication is not available. Dietary restriction (DR) has been found to attenuate aging and aging-related diseases, including sarcopenia, but the mechanism of both DR and sarcopenia are incompletely understood.

Methods: In this study, mice body weight, fore and all limb grip strength, and motor learning and coordination performance were first analysed to evaluate the DR effects on muscle functioning. Liquid chromatography-mass spectrometry (LC-MS) was utilized for the metabolomics study of the DR effects on sarcopenia in progeroid DNA repair-deficient Ercc1∆/- and Xpg-/- mice, to identify potential biomarkers for attenuation of sarcopenia.

Results: Muscle mass was significantly (P < 0.05) decreased (13-20%) by DR; however, the muscle quality was improved with retained fore limbs and all limbs grip strength in Ercc1∆/- and Xpg-/- mice. The LC-MS results revealed that metabolites and pathways related to oxidative-stress, that is, GSSG/GSH (P < 0.01); inflammation, that is, 9-HODE, 11-HETE (P < 0.05), PGE2, PGD2, and TXB2 (P < 0.01); and muscle growth (PGF) (P < 0.01) and regeneration stimulation (PGE2) (P < 0.05) are significantly downregulated by DR. On the other hand, anti-inflammatory indicator and several related metabolites, that is, β-hydroxybutyrate (P < 0.01), 14,15-DiHETE (P < 0.0001), 8,9-EET, 12,13-DiHODE, and PGF1 (P < 0.05); consumption of sources of energy (i.e., muscle and liver glycogen); and energy production pathways, that is, glycolysis (glucose, glucose-6-P, fructose-6-P) (P < 0.01), tricarboxylic acid cycle (succinyl-CoA, malate) (P < 0.001), and gluconeogenesis-related metabolite, alanine (P < 0.01), are significantly upregulated by DR. The notably (P < 0.01) down-modulated muscle growth (PGF) and regeneration (PGE2) stimulation metabolite and the increased consumption of glycogen in muscle and liver may be related to the significantly (P < 0.01) lower body weight and muscle mass by DR. The downregulated oxidative stress, pro-inflammatory mediators, and upregulated anti-inflammatory metabolites resulted in a lower energy expenditure, which contributed to enhanced muscle quality together with upregulated energy production pathways by DR. The improved muscle quality may explain why grip strength is maintained and motor coordination and learning performance are improved by DR in Ercc1∆/- and Xpg-/- mice.

Conclusions: This study provides fundamental supporting information on biomarkers and pathways related to the attenuation of sarcopenia, which might facilitate its diagnosis, prevention, and clinical therapy.

Keywords: Dietary restriction; Energy generation; Inflammation; Muscle aging; Oxidative stress; Progeria.


Conflict of interest statement

The authors declare no competing interests.

Figures
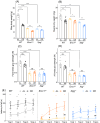
Figure 1
Figure 1
The effects of dietary restriction on body weight, muscle dry weight, grip strength, and motor coordination in WT (n = 8 or 9), Ercc1 ∆/− (n = 4 or 5), and Xpg −/− (n = 4) mice with only male and age 14/16 weeks. *P < 0.05, **P < 0.01, ***P < 0.001, ****P < 0.0001, t test with false discovery rate (FDR) correction. †P < 0.05, t test with FDR correction between AL and DR in each type of mice. # P < 0.05, ## P < 0.01, t test with FDR correction between WT and mutated (Ercc1 ∆/− or Xpg −/− ) animals under AL conditions in each trial. (A) Mouse body weight, (B) quadriceps femoris muscle (Quad) dry weight, (C) fore limbs grip strength, (D) all limbs grip strength, (E) motor learning and coordination performance. (Trial 1, 2, 3 and 4 means the 1st, 2nd, 3rd and 4th trial, respectively). The dots represent the value of each replicate, and the error bars represent standard error.
Figure 2
Figure 2
(A) The partial least squares‐discriminant analysis (PLS‐DA) score plot for the effect of accelerated aging on oxidative‐stress‐related, pro‐inflammatory, anti‐inflammatory, and energy‐related metabolites in AL mice; the effects of accelerated aging on the representative indicators of (B) oxidative stress and pro‐inflammation, (C) anti‐inflammation, and (D) energy status. WT (n = 9), Ercc1 ∆/− (n = 5), and Xpg −/− (n = 4). *P < 0.05, t test with FDR correction.
Figure 3
Figure 3
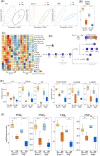
Footprint of the effects of DR on pro‐inflammatory and oxidative‐stress‐related pathways and metabolites for sarcopenia in WT (n = 9), Ercc1 ∆/− (n = 5), and Xpg −/− (n = 4) mice. (A) The PLS‐DA score plot for the effect of DR on pro‐inflammatory and oxidative‐stress‐related metabolites. (B) The effects of DR on oxidative stress indicator, the ratio of GSSG to GSH in Ercc1 ∆/− and Xpg −/− mouse muscle (we focused here and in the other analyses on the Ercc1 ∆/− and Xpg −/− mice because of the overall strong effect of DR in these mutants). (C) Heatmap representation of the pro‐inflammatory and oxidative‐stress‐related metabolites between AL and DR in Ercc1 ∆/− and Xpg −/− mouse muscle (each column represents one mouse). (D) The fold change of metabolites significantly (P < 0.05) regulated by DR in the pro‐inflammatory pathways (t test with FDR correction). (E, F) The effects of DR on (E) ω6 polyunsaturated fatty acids and ROS‐stimulated metabolites, (F) pro‐inflammatory, muscle growth and regeneration stimulation metabolites in Ercc1 ∆/− and Xpg −/− mouse muscle. *P < 0.05, **P < 0.01, ***P < 0.001, t test with FDR correction.
Figure 4
Figure 4
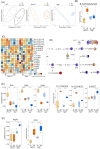
Footprint of the effects of DR on anti‐inflammatory metabolites and pathways for sarcopenia in WT (n = 9), Ercc1 ∆/− (n = 5), and Xpg −/− (n = 4) mice. (A) The PLS‐DA score plot for the effect of DR on anti‐inflammatory metabolites. (B) The effects of DR on anti‐aging indicator (β‐hydroxybutyrate) in Ercc1 ∆/− and Xpg −/− mouse muscle. (C) Heatmap profile of the anti‐inflammatory metabolites between AL and DR in Ercc1 ∆/− and Xpg −/− mouse muscle (background colour was used for the non‐detected metabolites, and each column represents one mouse). (D) The fold change of metabolites significantly (P < 0.05) regulated by DR in the anti‐inflammatory pathways (t test with FDR correction). (E, F) The effects of DR on (E) ω3 polyunsaturated fatty acids and anti‐inflammatory metabolites, (F) metabolites in LA pathway to inhibit the AA generation and GSH in Ercc1 ∆/− and Xpg −/− mouse muscle. *P < 0.05, **P < 0.01, ***P < 0.001, ****P < 0.0001, t test with FDR correction.
Figure 5
Figure 5
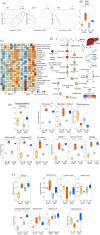
Footprint of the effects of DR on energy‐generation‐related metabolites and pathways for sarcopenia in WT (n = 9), Ercc1 ∆/− (n = 5), and Xpg −/− (n = 4) mice. (A) The PLS‐DA score plot for the effect of DR on energy‐generation‐related metabolites. (B) The effects of DR on the ratio of ATP to ADP in Ercc1 ∆/− and Xpg −/− mouse muscle. (C) Heatmap profile of the energy‐generation‐related metabolites between AL and DR in Ercc1 ∆/− and Xpg −/− mouse muscle (each column represents one mouse). (D) The fold change of metabolites significantly (P < 0.05) regulated in the energy‐generation‐related pathways (t test with FDR correction). (E, F) The effects of DR on (E) phosphocreatine to creatine, energy substrates (i.e., glucose in muscle and blood, and glucose‐1‐phosphate in muscle), metabolites in glycolysis, and metabolites in tricarboxylic acid cycle; (F) metabolite that stimulating gluconeogenesis, saturated fatty acids, metabolites in pentose phosphate pathway (PPP), and α‐ketoglutarate in Ercc1 ∆/− and Xpg −/− mouse muscle. *P < 0.05, **P < 0.01, ***P < 0.001, ****P < 0.0001, t test with FDR correction.
Figure 6
Figure 6
Overview of the metabolites and pathways regulated by DR to improve muscle quality and function in sarcopenia in DNA‐repair‐deficient prematurely aging mouse mutants.

References

    1. Cruz‐Jentoft AJ, Sayer AA. Sarcopenia. Lancet 2019;393:2636–2646. - PubMed
    1. Garatachea N, Pareja‐Galeano H, Sanchis‐Gomar F, Santos‐Lozano A, Fiuza‐Luces C, Moran M, et al. Exercise attenuates the major hallmarks of aging. Rejuvenation Res 2015;18:57–89. - PMC - PubMed
    1. von Haehling S, Morley JE, Anker SD. An overview of sarcopenia: facts and numbers on prevalence and clinical impact. J Cachexia Sarcopenia Muscle 2010;1:129–133. - PMC - PubMed
    1. Partridge L, Deelen J, Slagboom PE. Facing up to the global challenges of ageing. Nature 2018;561:45–56. - PubMed
    1. Kwak JY, Kwon K‐S. Pharmacological interventions for treatment of sarcopenia: current status of drug development for sarcopenia. Ann Geriatr Med Res 2019;23:98–104. - PMC - PubMed