. 2024 Apr 10;27(5):109709.
doi: 10.1016/j.isci.2024.109709. eCollection 2024 May 17.

Hepatokine ITIH3 protects against hepatic steatosis by downregulating mitochondrial bioenergetics and de novo lipogenesis

Affiliations

Hepatokine ITIH3 protects against hepatic steatosis by downregulating mitochondrial bioenergetics and de novo lipogenesis

Noble Kumar Talari et al. iScience. .

Abstract

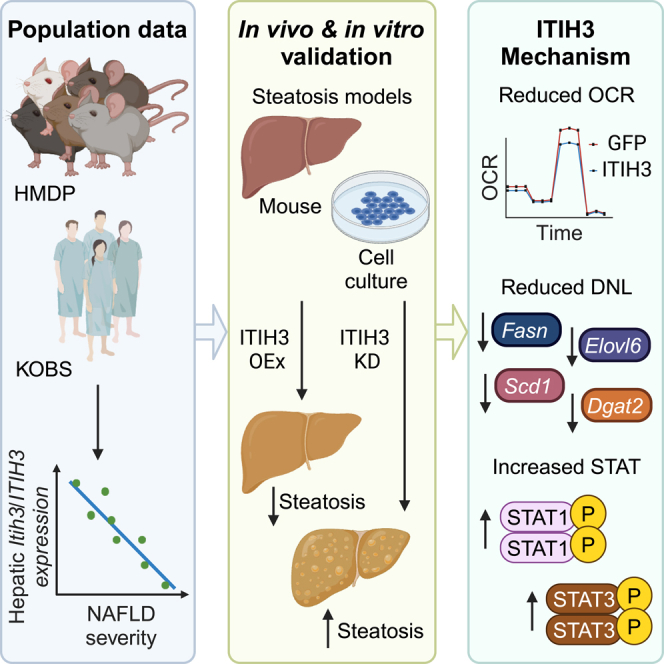
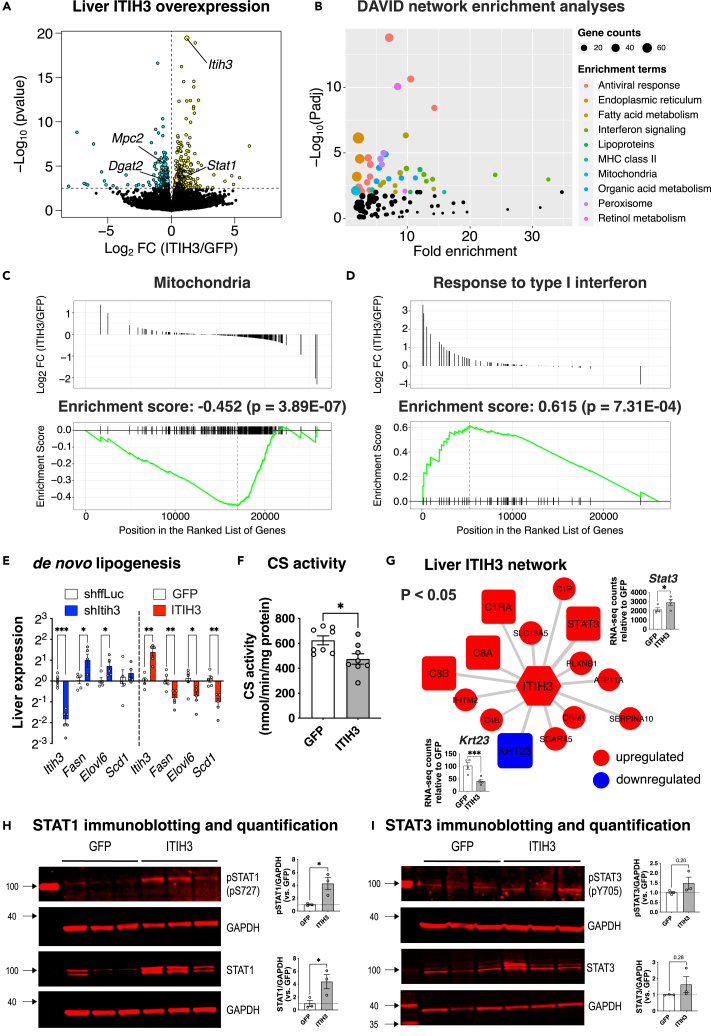
Recent studies demonstrate that liver secretory proteins, also known as hepatokines, regulate normal development, obesity, and simple steatosis to non-alcoholic steatohepatitis (NASH) progression. Using a panel of ∼100 diverse inbred strains of mice and a cohort of bariatric surgery patients, we found that one such hepatokine, inter-trypsin inhibitor heavy chain 3 (ITIH3), was progressively lower in severe non-alcoholic fatty liver disease (NAFLD) disease states highlighting an inverse relationship between Itih3/ITIH3 expression and NAFLD severity. Follow-up animal and cell culture models demonstrated that hepatic ITIH3 overexpression lowered liver triglyceride and lipid droplet accumulation, respectively. Conversely, ITIH3 knockdown in mice increased the liver triglyceride in two independent NAFLD models. Mechanistically, ITIH3 reduced mitochondrial respiration and this, in turn, reduced liver triglycerides, via downregulated de novo lipogenesis. This was accompanied by increased STAT1 signaling and Stat3 expression, both of which are known to protect against NAFLD/NASH. Our findings indicate hepatokine ITIH3 as a potential biomarker and/or treatment for NAFLD.

Keywords: Biochemistry; Biological sciences; Cell biology; Physiology.


Conflict of interest statement

The authors declare no conflict of interests.

Figures

None
Graphical abstract
Figure 1
Figure 1
ITIH3 is negatively associated with NAFLD/NASH in both mice and humans (A) Overlay of HMDP bicorrelation directionality on ITIH3 key driver (KD) network from our previous study. ITIH3 is represented in hexagon shape, other key driver genes are represented in square shapes, and the rest of the network genes are represented in circle shapes. Red represents positive and blue represents negative correlation with liver Itih3 expression from HMDP strains maintained on HF/HS diet (n = 113 HMDP strains). (B) Liver Itih3 expression from HMDP strains maintained on chow (n = 96 HMDP strains) or HF/HS (n = 113 HMDP strains) or western (n = 102 HMDP strains) diet. (C) Correlation plot between hepatic Itih3 expression and triglyceride in HMDP strains maintained on HF/HS diet (n = 113 HMDP strains). (D) DAVID pathway and (E) ToppGene disease enrichment analyses of highly correlated HMDP liver genes (listed in Table S1) with liver Itih3 expression (bicor > |±0.3|; p < 1E-05). Hepatic ITIH3 expression from KOBS cohort (n = 262) grouped by (F) steatosis grade and (G) Fibrosis. (H) Correlation plot between hepatic ITIH3 expression and triglycerides. Data are presented as median and interquartile range (boxplots). p values were calculated by (A and C) bicor; (B) one-factor ANOVA corrected by post-hoc “Holm-Sidak’s” multiple comparisons test; (F and G) ANCOVA corrected for age, BMI, and sex; (H) partial correlation adjusting for age, BMI, and sex. HMDP, hybrid mouse diversity panel; bicor, biweight midcorrelation; BMI, body mass index.
Figure 2
Figure 2
ITIH3 lowers liver triglyceride accumulation both in vivo and in vitro Comparisons of body weight measurements and hepatic lipid levels from (A and B) 15% fructose in drinking water or (C and D) HF/HS fed ITIH3 silencing (KD) mice or (E and F) HF/HS fed ITIH3 overexpressing (OEx) mice, respectively. Oil Red O staining of AML12 cells overexpressing GFP or ITIH3 with (G) representative images and (H) quantification. Data are presented as mean ± SEM (n = 6–8 mice per group; n = 2 independent experiments for AML12 cells). p values were calculated by (A, C, and E) repeated measures two-factor ANOVA; (B, D, and F) two-factor ANOVA corrected by post-hoc “Holm-Sidak’s” multiple comparisons test; (H) t test. ∗p < 0.05; ∗∗∗p < 0.001. TG, triglyceride; TC, total cholesterol; UC, unesterified cholesterol; PL, phospholipids.
Figure 3
Figure 3
ITIH3 lowers mitochondrial respiration both in vivo and in vitro Respirometry traces of isolated liver mitochondria from GFP or ITIH3 overexpressing mice offered (A) pyruvate with malate (Complex I) or (B) succinate with rotenone (Complex II) and their respective (C) State 3 and (D) State 3u mitochondrial respiration. Respirometry traces of intact AML12 cells (E) overexpressing GFP or ITIH3, or (J) exogenously treated with control or rhITIH3 and their respective (F and K) mitochondrial (datapoint 15 subtracted from 3), (G and L) ATP-linked (datapoint 6 subtracted from 3), (H and M) maximal respiration (datapoint 15 subtracted from 12) and (I and N) spare capacity (datapoint 3 subtracted from 12), respectively. Data are presented as mean ± SEM (n = 8 mice per group; n = 14–15 replicates per group for AML12 cells). p values were calculated by (A, B, E and J) repeated measures two-factor ANOVA; (C and D) multiple t tests corrected by post-hoc ‘Holm-Sidak’s’ multiple comparisons test; (F–I and K–N) t test. ∗p < 0.05; ∗∗p < 0.01; ∗∗∗p < 0.001.
Figure 4
Figure 4
ITIH3 protects against steatosis via downregulating mitochondria and de novo lipogenesis while upregulating STAT1 signaling (A) Global genome-wide transcriptomics of livers extracted from GFP or ITIH3 overexpressing mice. Turquoise and yellow represent down-regulated and up-regulated genes, respectively. (B) DAVID pathway enrichment analyses of 480 DEGs (listed in Table S2). Gene set enrichment analysis (GSEA) of ranked DEGs revealed a significant enrichment of (C) Mitochondria and (D) Response to type I interferon. Follow-up (E) qPCR analyses of Itih3 and liver DNL genes such as Fasn, Elovl6, and Scd1 in ITIH3 knockdown and overexpression mice and their respective controls and (F) citrate synthase (CS) activity measured in GFP or ITIH3 overexpression mice. (G) Overlay of DEGs on ITIH3 network from Figure 1A. Blue represents genes going down and red represents genes going up in ITIH3 overexpressing mice (p < 0.05). Inset shows RNA counts of Stat3 and Krt23 in ITIH3 overexpressing mice. Follow-up immunoblot analyses and their respective quantification of liver proteins such as (H) pSTAT1 and STAT1, (I) pSTAT3 and STAT3 in GFP or ITIH3 overexpressing mice. GAPDH was used as a loading control. Data are presented as mean ± SEM (n = 4 mice for transcriptomics, n = 5–6 mice for qPCR, n = 8 for CS activity and n = 3 mice for immunoblot analyses per group). p values were calculated by (A and G) Wald test; (E) multiple t tests corrected by post-hoc “Benjamini, Krieger, Yekutieli” FDR approach for multiple comparisons test; (F, H, and I) t test. ∗p < 0.05; ∗∗p < 0.01; ∗∗∗p < 0.001.

References

    1. Adams L.A., Lymp J.F., St Sauver J., Sanderson S.O., Lindor K.D., Feldstein A., Angulo P. The natural history of nonalcoholic fatty liver disease: a population-based cohort study. Gastroenterology. 2005;129:113–121. doi: 10.1053/j.gastro.2005.04.014. - DOI - PubMed
    1. Browning J.D., Szczepaniak L.S., Dobbins R., Nuremberg P., Horton J.D., Cohen J.C., Grundy S.M., Hobbs H.H. Prevalence of hepatic steatosis in an urban population in the United States: impact of ethnicity. Hepatology. 2004;40:1387–1395. doi: 10.1002/hep.20466. - DOI - PubMed
    1. Kopec K.L., Burns D. Nonalcoholic fatty liver disease: a review of the spectrum of disease, diagnosis, and therapy. Nutr. Clin. Pract. 2011;26:565–576. doi: 10.1177/0884533611419668. - DOI - PubMed
    1. Clark J.M., Brancati F.L., Diehl A.M. Nonalcoholic fatty liver disease. Gastroenterology. 2002;122:1649–1657. doi: 10.1053/gast.2002.33573. - DOI - PubMed
    1. Falck-Ytter Y., Younossi Z.M., Marchesini G., McCullough A.J. Clinical features and natural history of nonalcoholic steatosis syndromes. Semin. Liver Dis. 2001;21:17–26. doi: 10.1055/s-2001-12926. - DOI - PubMed