

Inefficacy of anti-VEGF therapy reflected in VEGF-mediated photoreceptor degeneration
- PMID: 38689803
- PMCID: PMC11059333
- DOI: 10.1016/j.omtn.2024.102176
Inefficacy of anti-VEGF therapy reflected in VEGF-mediated photoreceptor degeneration
Abstract
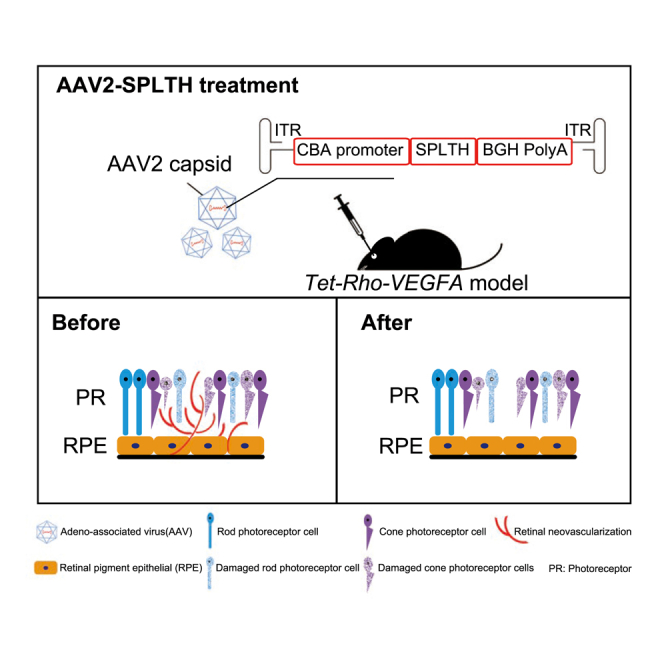
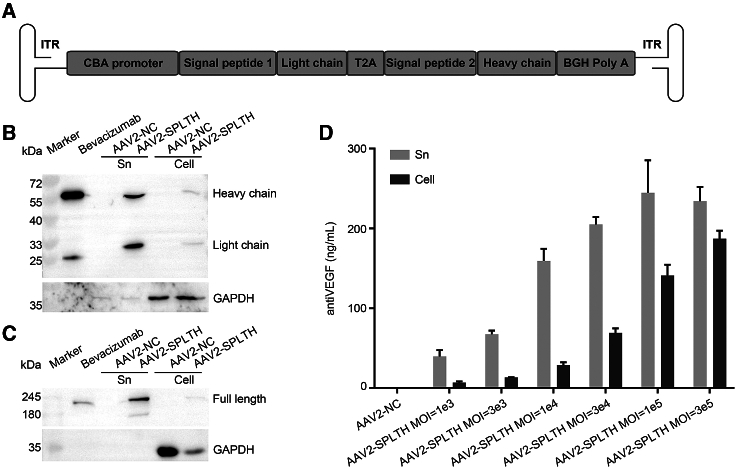
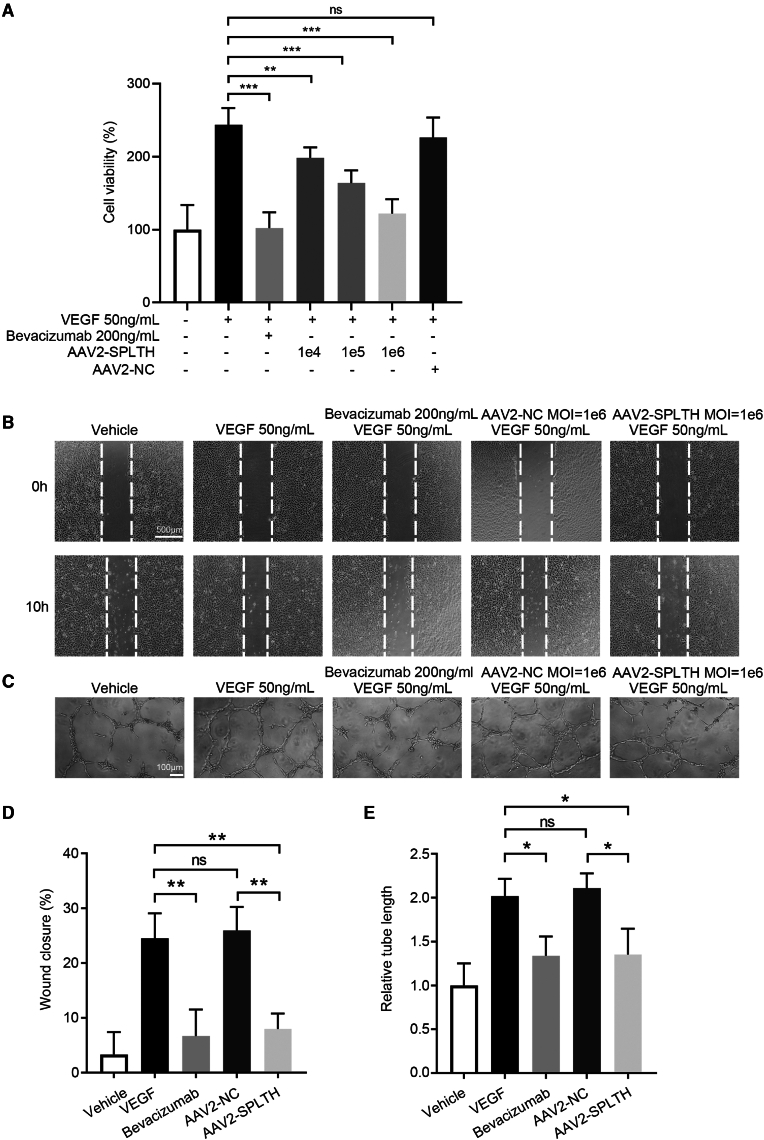
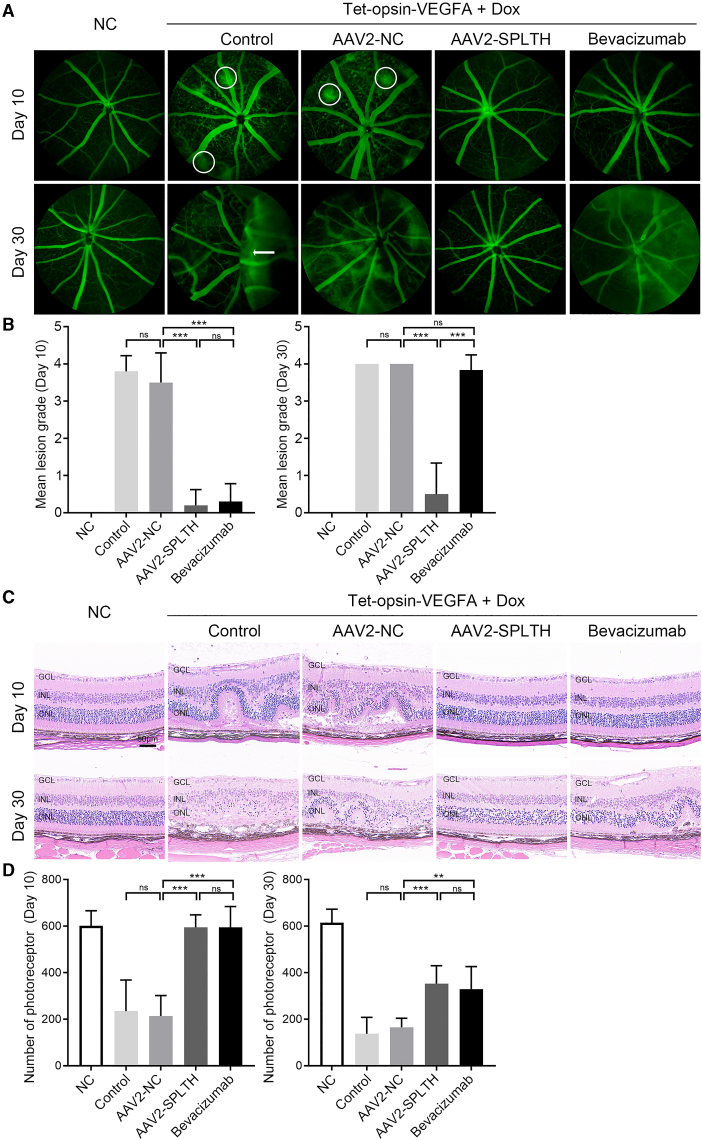
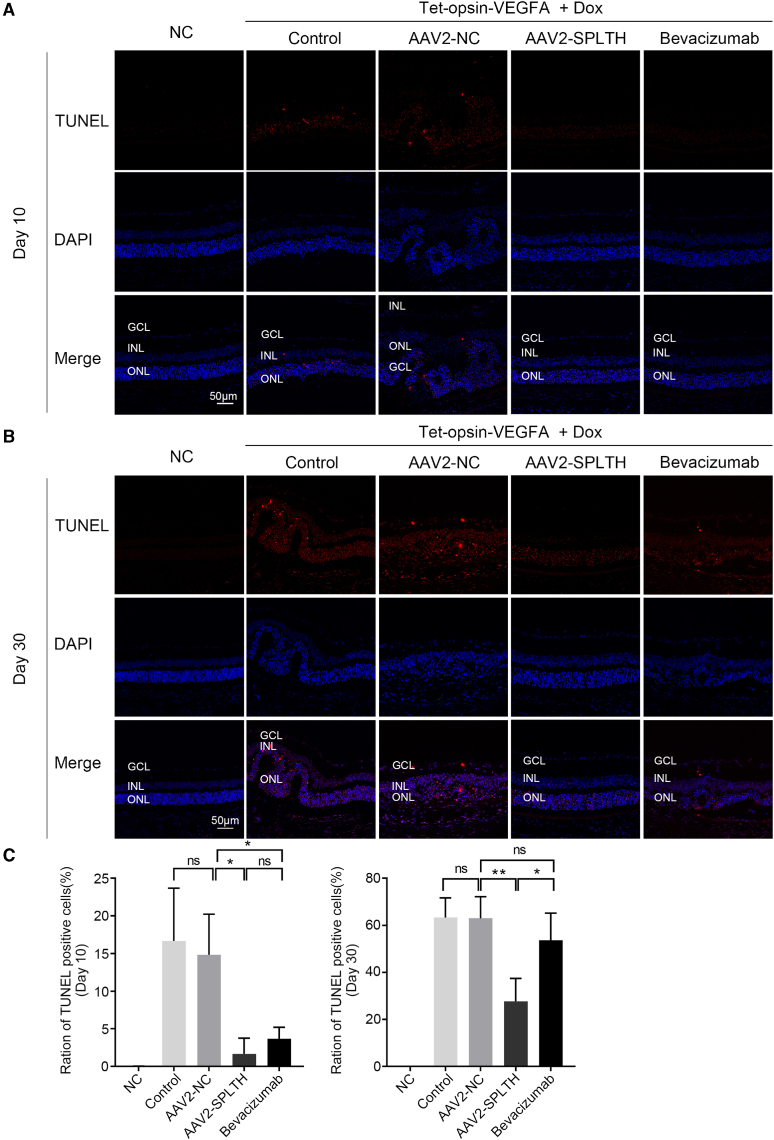
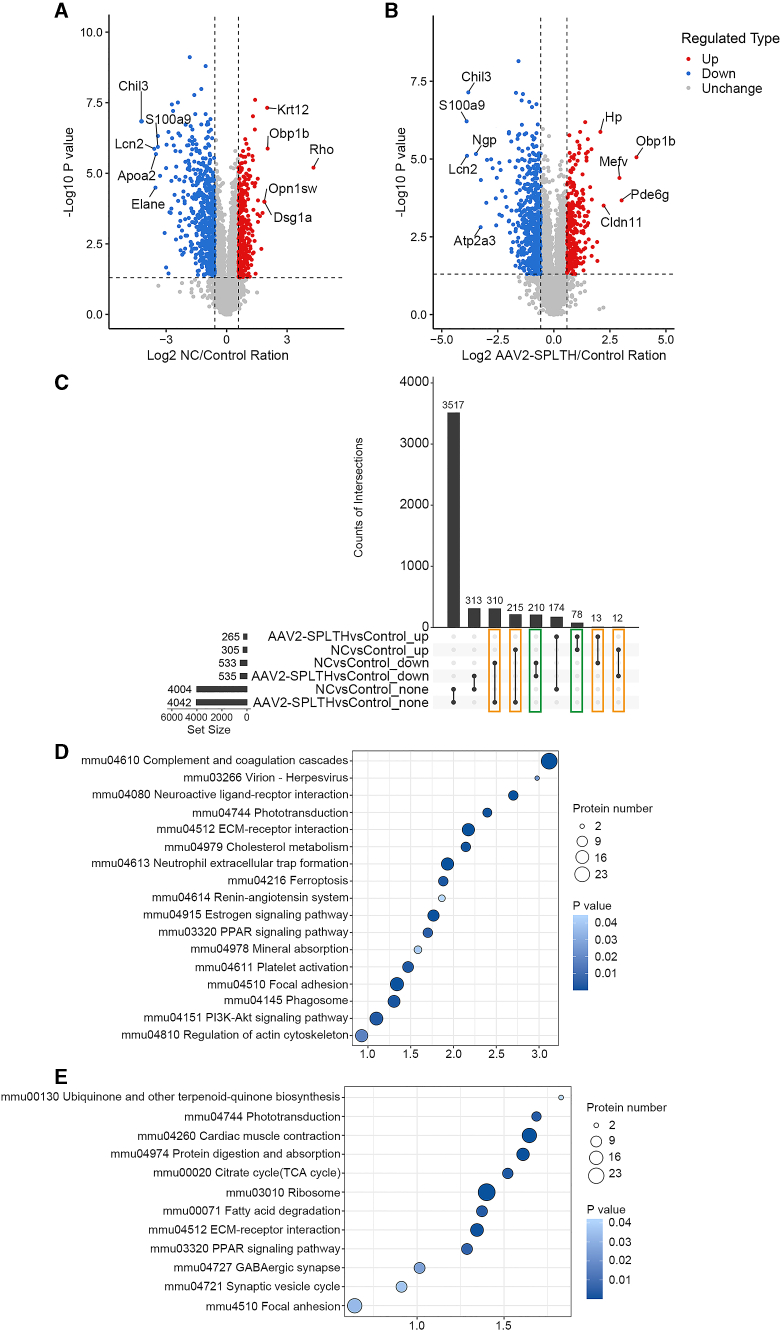
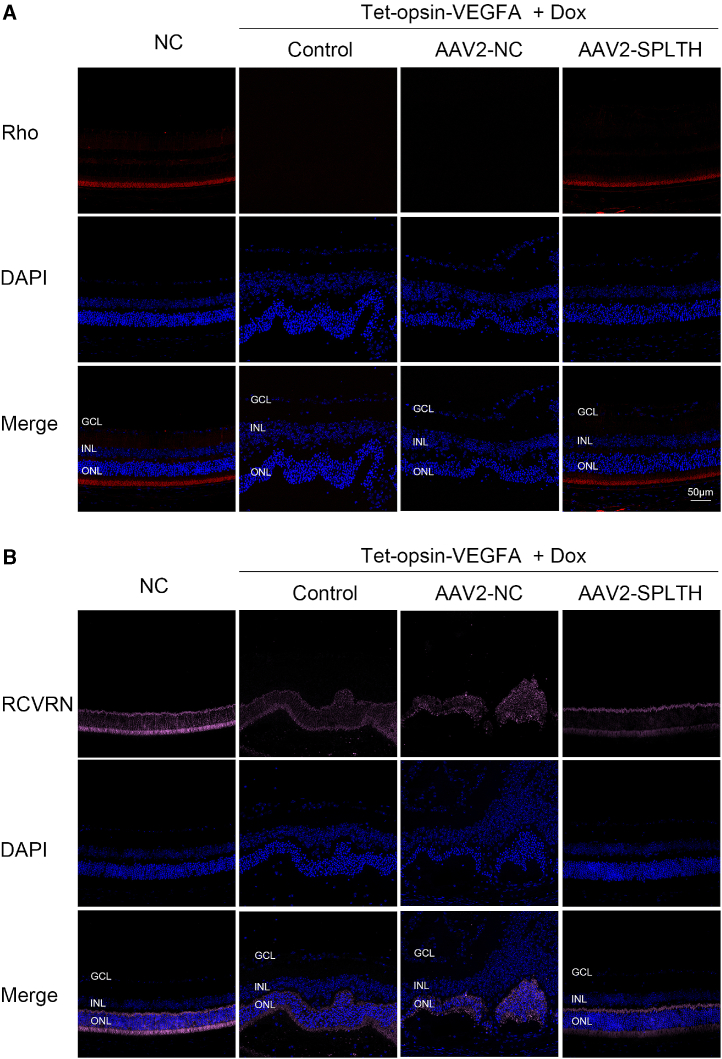
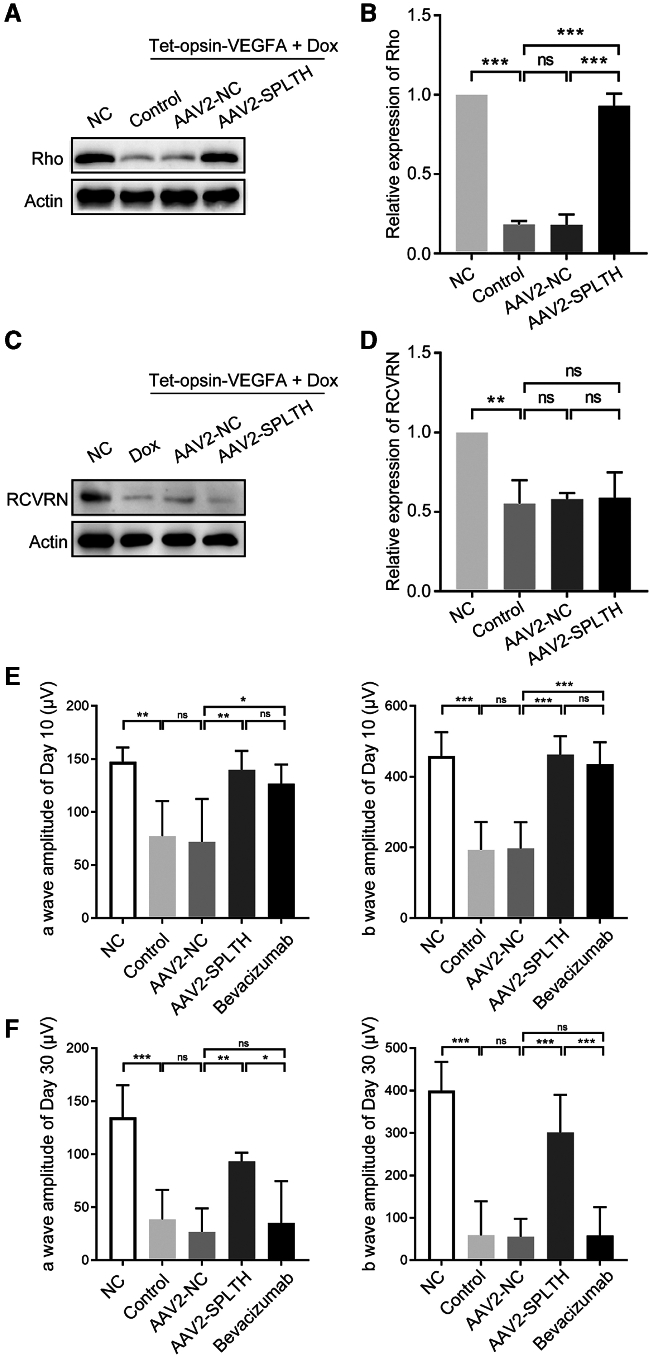
Retinal neovascularization (RNV) is primarily driven by vascular endothelial growth factor (VEGF). However, current anti-VEGF therapies are limited by short half-lives and repeated injections, which reduce patient quality of life and increase medical risks. Additionally, not all patients benefit from anti-VEGF monotherapy, and some problems, such as unsatisfactory vision recovery, persist after long-term treatment. In this study, we constructed a recombinant adeno-associated virus (AAV), AAV2-SPLTH, which encodes an anti-VEGF antibody similar to bevacizumab, and assessed its effects in a doxycycline-induced Tet-opsin-VEGFA mouse model of RNV. AAV2-SPLTH effectively inhibited retinal leakage, RNV progression, and photoreceptor apoptosis in a Tet-opsin-VEGF mouse model. However, proteomic sequencing showed that AAV2-SPLTH failed to rescue the expression of phototransduction-related genes, which corresponded to reduced photoreceptor cell numbers. This study suggests that anti-VEGF monotherapy can significantly inhibit RNV to some extent but may not be enough to save visual function in the long term.
Keywords: MT: Delivery Strategies; anti-VEGF monotherapy; gene therapy; oxidative stress; photoreceptor degeneration; retinal neovascularization.
© 2024 The Author(s).
Conflict of interest statement
The authors declare no competing interests.
Figures
Similar articles
-
AAV2-antiVEGFscFv gene therapy for retinal neovascularization.Mol Ther Methods Clin Dev. 2023 Oct 29;31:101145. doi: 10.1016/j.omtm.2023.101145. eCollection 2023 Dec 14. Mol Ther Methods Clin Dev. 2023. PMID: 38027065 Free PMC article.
-
Inhibition of integrin α5β1 ameliorates VEGF-induced retinal neovascularization and leakage by suppressing NLRP3 inflammasome signaling in a mouse model.Graefes Arch Clin Exp Ophthalmol. 2018 May;256(5):951-961. doi: 10.1007/s00417-018-3940-x. Epub 2018 Mar 3. Graefes Arch Clin Exp Ophthalmol. 2018. PMID: 29502235 Free PMC article.
-
Development of gene therapy for treatment of age-related macular degeneration.Acta Ophthalmol. 2014 Jul;92 Thesis3:1-38. doi: 10.1111/aos.12452. Acta Ophthalmol. 2014. PMID: 24953666
-
Emerging vascular endothelial growth factor antagonists to treat neovascular age-related macular degeneration.Expert Opin Emerg Drugs. 2017 Sep;22(3):235-246. doi: 10.1080/14728214.2017.1362390. Epub 2017 Aug 4. Expert Opin Emerg Drugs. 2017. PMID: 28756707 Review.
-
Clinical evidence of intravitreal triamcinolone acetonide in the management of age-related macular degeneration.Curr Drug Targets. 2011 Feb;12(2):149-72. doi: 10.2174/138945011794182746. Curr Drug Targets. 2011. PMID: 20887246 Review.
Cited by
-
Advances in the molecular signaling mechanisms of VEGF/VEGFR2 in fundus neovascularization disease (Review).Exp Ther Med. 2025 May 20;30(1):143. doi: 10.3892/etm.2025.12893. eCollection 2025 Jul. Exp Ther Med. 2025. PMID: 40496761 Free PMC article. Review.
References
-
- Fleckenstein M., Keenan T.D.L., Guymer R.H., Chakravarthy U., Schmitz-Valckenberg S., Klaver C.C., Wong W.T., Chew E.Y. Age-related macular degeneration. Nat. Rev. Dis. Prim. 2021;7:31. - PubMed
-
- Wong T.Y., Cheung C.M.G., Larsen M., Sharma S., Simó R. Diabetic retinopathy. Nat. Rev. Dis. Prim. 2016;2 - PubMed
LinkOut - more resources
Full Text Sources
