

Impact of Beam Shape on Print Accuracy in Digital Light Processing Additive Manufacture
- PMID: 38689905
- PMCID: PMC11057548
- DOI: 10.1089/3dp.2022.0193
Impact of Beam Shape on Print Accuracy in Digital Light Processing Additive Manufacture
Abstract
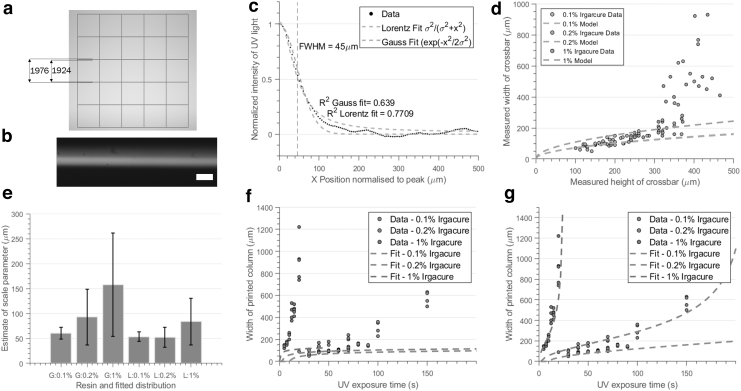
Photopolymerization-based additive manufacturing requires selectively exposing a feedstock resin to ultraviolet (UV) light, which in digital light processing is achieved either using a digital micromirror device or a digital mask. The minimum tolerances and resolution for a multilayer process are separate for resolution through the Z-axis, looking through the thickness of a printed part, and resolution in the XY-axes, in the plane of the printed layer. The former depends wholly on the rate of attenuation of the incident UV light through the material relative to the mechanical motion of the build layer, while the latter is determined by a two-dimensional pattern of irradiance on the resin formed by the digital micromirror device or the digital mask. The size or the spacing of elements or pixels of this digital mask is frequently given by manufacturers as the "resolution" of the device, however, in practice the achievable resolution is first determined by the beam distribution from each pixel. The beam distribution is, as standard, modeled as a two-parameter Gaussian distribution but the key parameters of peak intensity and standard deviation of the beam are hidden to the user and difficult to measure directly. The ability of models based on the Gaussian distribution to correctly predict the polymerization of printed features in the microscale is also typically poor. In this study, we demonstrate an alternative model of beam distribution based on a heavy-tailed Lorentzian model, which is able to more accurately predict small build areas for both positive and negative features. We show a simple calibration method to derive the key space parameters of the beam distribution from measurements of a single-layer printed model. We propose that the standard Gaussian model is insufficient to accurately predict a print outcome as it neglects higher-order terms, such as beam skew and kurtosis, and in particular failing to account for the relatively heavy tails of the beam distribution. Our results demonstrate how the amendments to the beam distribution can avoid errors in microchannel formation, and better estimates of the true XY-axes resolution of the printer. The results can be used as the basis for voxel-based models of print solidification that allow software prediction of the photopolymerization process.
Keywords: beam profiling; digital light processing; polymerization mechanics.
Copyright 2024, Mary Ann Liebert, Inc., publishers.
Conflict of interest statement
No competing financial interests exist.
Figures


Similar articles
-
Voxel based method for predictive modelling of solidification and stress in digital light processing based additive manufacture.Soft Matter. 2021 Feb 21;17(7):1881-1887. doi: 10.1039/d0sm01968b. Epub 2021 Jan 7. Soft Matter. 2021. PMID: 33410451
-
Mechanics of shape distortion of DLP 3D printed structures during UV post-curing.Soft Matter. 2019 Aug 14;15(30):6151-6159. doi: 10.1039/c9sm00725c. Epub 2019 Jul 18. Soft Matter. 2019. PMID: 31317163
-
A systematic evaluation of medical 3D printing accuracy of multi-pathological anatomical models for surgical planning manufactured in elastic and rigid material using desktop inverted vat photopolymerization.Med Phys. 2021 Jun;48(6):3223-3233. doi: 10.1002/mp.14850. Epub 2021 Apr 16. Med Phys. 2021. PMID: 33733499
-
A Review of Critical Issues in High-Speed Vat Photopolymerization.Polymers (Basel). 2023 Jun 17;15(12):2716. doi: 10.3390/polym15122716. Polymers (Basel). 2023. PMID: 37376363 Free PMC article. Review.
-
Pharmaceutical applications and requirements of resins for printing by digital light processing (DLP).Pharm Dev Technol. 2024 Jun;29(5):445-456. doi: 10.1080/10837450.2024.2345144. Epub 2024 Apr 25. Pharm Dev Technol. 2024. PMID: 38641968 Review.
Cited by
-
Dimensional accuracy and surface characteristics of complete-arch cast manufactured by six 3D printers.Heliyon. 2024 May 11;10(10):e30996. doi: 10.1016/j.heliyon.2024.e30996. eCollection 2024 May 30. Heliyon. 2024. PMID: 38778963 Free PMC article.
-
Effect of Pixel Offset Adjustments for XY Plane Dimensional Compensation in Digital Light Processing 3D Printing on the Surface Trueness and Fit of Zirconia Crowns.J Funct Biomater. 2025 Mar 14;16(3):103. doi: 10.3390/jfb16030103. J Funct Biomater. 2025. PMID: 40137382 Free PMC article.
References
-
- Zhang H, Yao Y, Hui Y, et al. . A 3D-printed microfluidic gradient concentration chip for rapid antibiotic-susceptibility testing. Bio Des Manuf 2022;5(1):210–219; doi: 10.1007/s42242-021-00173-0 - DOI
-
- Zhang Y-F, Ng CJ-X, Chen Z, et al. . Miniature pneumatic actuators for soft robots by high-resolution multimaterial 3D printing. Adv Mater Technol 2019;4(10):1900427; doi: 10.1002/admt.201900427 - DOI
-
- Zhai Z, Wu L, Jiang H. Mechanical metamaterials based on origami and kirigami. Appl Phys Rev 2021;8(4):041319; doi: 10.1063/5.0051088 - DOI
LinkOut - more resources
Full Text Sources