. 2024 Apr 1;11(2):435-445.
doi: 10.1089/3dp.2022.0218. Epub 2024 Apr 16.

Three-Dimensional Printing of Ultrasoft Silicone with a Functional Stiffness Gradient

Affiliations

Three-Dimensional Printing of Ultrasoft Silicone with a Functional Stiffness Gradient

Clayton A Young et al. 3D Print Addit Manuf. .

Abstract

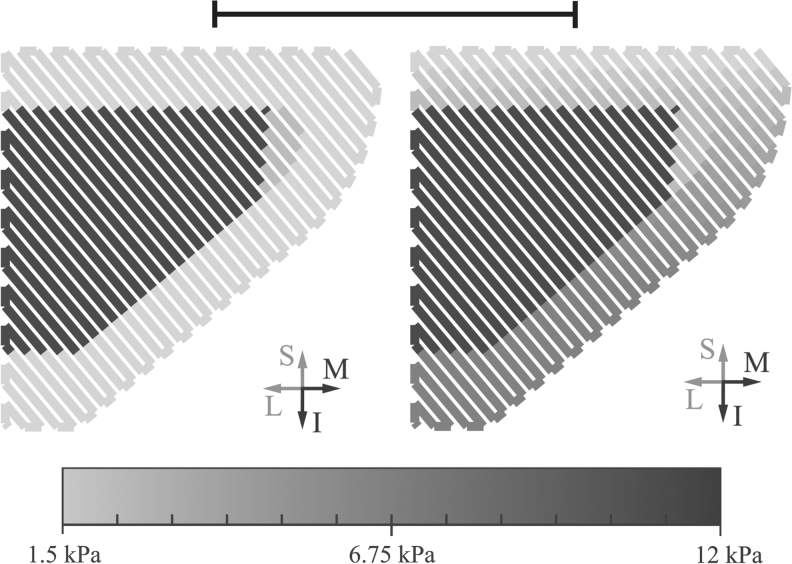
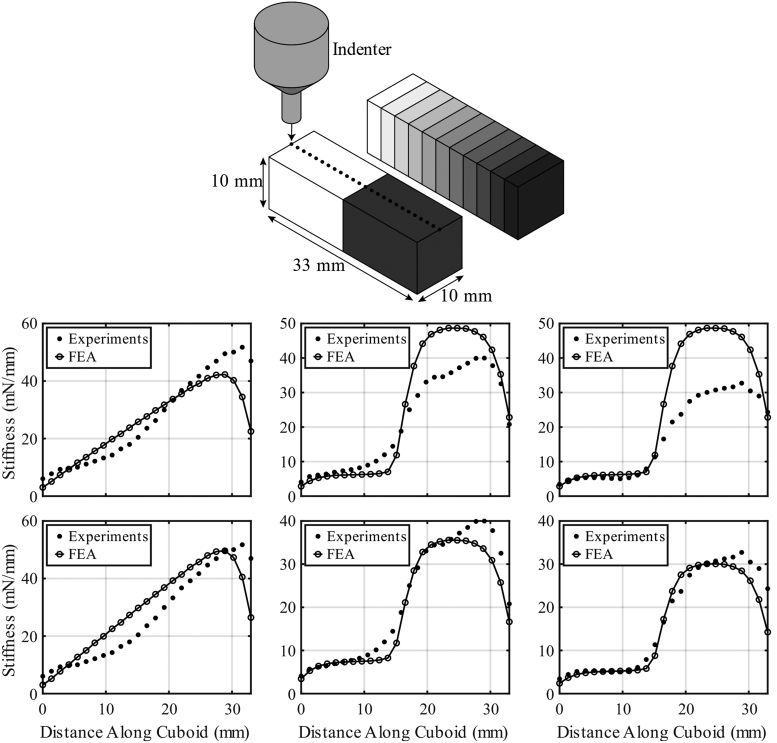
A methodology for three-dimensionally printing ultrasoft silicone with a functional stiffness gradient is presented. Ultraviolet-cure silicone was deposited via two independently controlled extruders into a thixotropic, gel-like, silicone oil-based support matrix. Each extruder contained a different liquid silicone formulation. The extrusion rates were independently varied during printing such that the combined selectively deposited material contained different ratios of the two silicones, resulting in localized control of material stiffness. Tests to validate the process are reported, including tensile testing of homogeneous cubic specimens to quantify the range of material stiffness that could be printed, indentation testing of cuboid specimens to characterize printed stiffness gradients, and vibratory testing of synthetic multilayer vocal fold (VF) models to demonstrate that the method may be applied to the fabrication of biomechanical models for voice production research. The cubic specimens exhibited linear stress-strain data with tensile elasticity modulus values between 1.11 and 27.1 kPa, more than a factor of 20 in stiffness variation. The cuboid specimens exhibited material variations that were visually recognizable and quantifiable via indentation testing. The VF models withstood rigorous phonatory flow-induced vibration and exhibited vibratory characteristics comparable to those of previous models. Overall, while process refinements are needed, the results of these tests demonstrate the ability to print ultrasoft silicone with stiffness gradients.

Keywords: biomechanical modeling; functional stiffness gradient; functionally graded 3D printing; multi-material printing; silicone 3D printing; ultrasoft 3D printing.


Conflict of interest statement

Brigham Young University has filed a Patent Cooperation Treaty (PCT) application, with C.A.Y. and S.L.T. included among the co-inventors, on 3D printing materials within a locally curable support matrix. C.A.Y., M.O., and S.L.T. have no other financial or personal conflicts of interest to declare.

Figures

FIG. 1.
FIG. 1.
(a) Illustration of frontal view of the human larynx showing VF tissue layers. (b) EPI VF model with (c) cutaway view of corresponding material layers. Model measures ∼17 mm in the A–P direction. Anatomical orientations are anterior (A), posterior (P), inferior (I), superior (S), medial (M), and lateral (L). Illustrations used and modified with permission as follows: (a) Vaterlaus and Greenwood, (b, c) Greenwood and Thomson. EPI, epithelium; VF, vocal fold.
FIG. 2.
FIG. 2.
(a) Rendering of custom dual extruder and (b) illustration of blunt tip needles (green, brown) guided through two tapered dispensing tips in series (red, blue).
FIG. 3.
FIG. 3.
Print paths of EPI (left) and VSG (right) VF models, with gray scale denoting target material stiffness. Material variation can be observed in the SLP layer of the VSG model. Scale bar (top) is ∼10 mm. The models measured 17 mm in the out-of-page (anterior–posterior) dimension. SLP, superficial lamina propria; VSG, vertical stiffness gradient.
FIG. 4.
FIG. 4.
(a) Images of cube tensile testing between −10% and +50% strain. (b) Stress versus strain for cubes with mixing ratios as depicted in the legend (three cubes per ratio). Symbols denote data points, and dashed lines are linear curve fits. The 95% confidence interval was calculated using twice the standard deviation. (c) Corresponding tensile modulus values (slopes of linear curve fits) versus mixing ratio. Bar chart labels are averages, with standard deviations in parentheses. Inset shows rational polynomial curve fit to the modulus versus mixing ratio data as given by the equation y=1.554x+28.73x1.056, where y denotes the modulus in kPa and x denotes the thinner ratio (e.g., 1:x).
FIG. 5.
FIG. 5.
Illustrations (top row) and images from different views (bottom three rows) of printed cuboids with n = 11 and 45° infill orientation (left column), n = 2 and 45° orientation (center), and n = 2 and 90° orientation (right). Cuboids were printed in the orientation as shown in the perspective view, with the top face being printed as the last layer. Dimensions are given with average error shown in parentheses.
FIG. 6.
FIG. 6.
(Top illustrations): Illustration of compression testing of cuboids with n = 2 (lower left) and n = 11 (upper right) material sections. Dots denote the 25 testing locations. (Bottom charts): Pre-tuned (top row) and post-tuned (bottom row) stiffness versus distance data from experiments and FEA with n = 11, 45° orientation (left column); n = 2, 45° orientation (middle column); and n = 2, 90° orientation (right column). Stiffnesses were calculated using linear fits to force versus plunge depth data. The clear-to-blue regions pictured in Figure 5 correspond to 0–33 mm, respectively, in these plots. FEA, finite element analysis.
FIG. 7.
FIG. 7.
(a–c) Printed EPI model with red and blue dye corresponding to the body and SLP layers, respectively (no epithelial layer). About 2 mm of the anterior and posterior ends of the model have been cut away for improved layer visibility. Scale bar is ∼5 mm. (d) A different printed model, mounted, with fiber inserted, and inclined for pouring of epithelial layer. Models were printed with an anterior–posterior build direction. (e) Micro-CT scan of mounted EPI model (blue) and mount (orange) (the near side of the mount was not segmented to enable visibility of the VF model). The white dashed line denotes the approximate location of the inner 15 mm region of the VF used to create the image in (f). (f) Superimposed perimeters from more than 200 sections (black) with design perimeter (solid red) and ±0.5 mm offset (dashed red) for reference. The red perimeter was defined using the same scale as the black perimeter, but positioned by minimizing the average error. CT, computed tomography.
FIG. 8.
FIG. 8.
Onset pressure, frequency, and maximum glottal width for all EPI and VSG VF models in non-tension (top) and tension (bottom) from weeks 1 and 2. Wk, week.

References

    1. Kniesburges S, Thomson SL, Barney A, et al. . In vitro experimental investigation of voice production. Curr Bioinform 2011;6:305–322. - PMC - PubMed
    1. Murray PR, Thomson SL. Synthetic, multi-layer, self-oscillating vocal fold model fabrication. J Vis Exp 2011;58:e3498. - PMC - PubMed
    1. Murray PR, Thomson SL. Vibratory responses of synthetic, self-oscillating vocal fold models. J Acoust Soc Am 2012;132:3428–3438. - PMC - PubMed
    1. Patel DK, Sakhaei AH, Layani M, et al. . Highly stretchable and UV curable elastomers for digital light processing based 3D printing. Adv Mater 2017;29:1606000. - PubMed
    1. Zhao T, Yu R, Li S, et al. . Superstretchable and processable silicone elastomers by digital light processing 3D printing. ACS Appl Mater Interfaces 2019;11:14391–14398. - PubMed

LinkOut - more resources