. 2024 Mar 19;10(7):e28358.
doi: 10.1016/j.heliyon.2024.e28358. eCollection 2024 Apr 15.

Comparative analysis of 10X Chromium vs. BD Rhapsody whole transcriptome single-cell sequencing technologies in complex human tissues

Affiliations

Comparative analysis of 10X Chromium vs. BD Rhapsody whole transcriptome single-cell sequencing technologies in complex human tissues

Stefan Salcher et al. Heliyon. .

Abstract

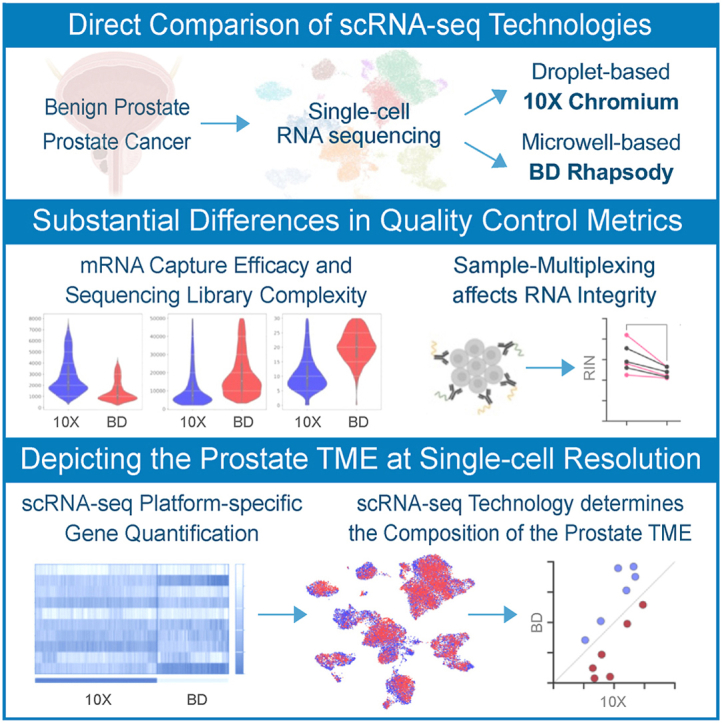
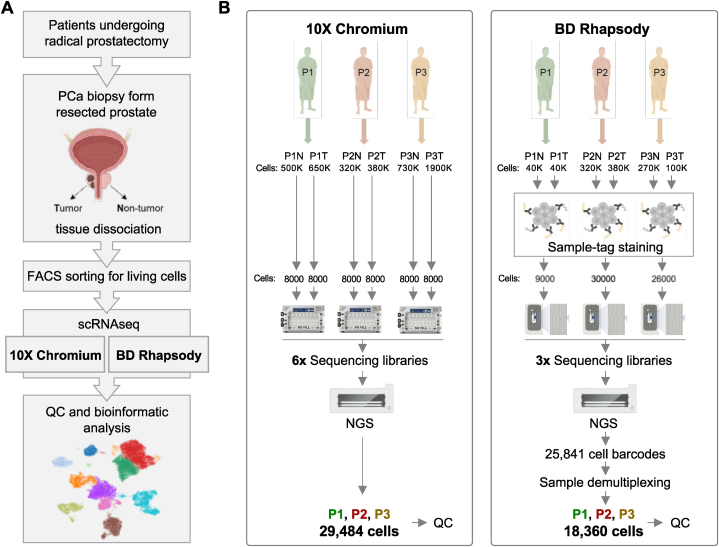
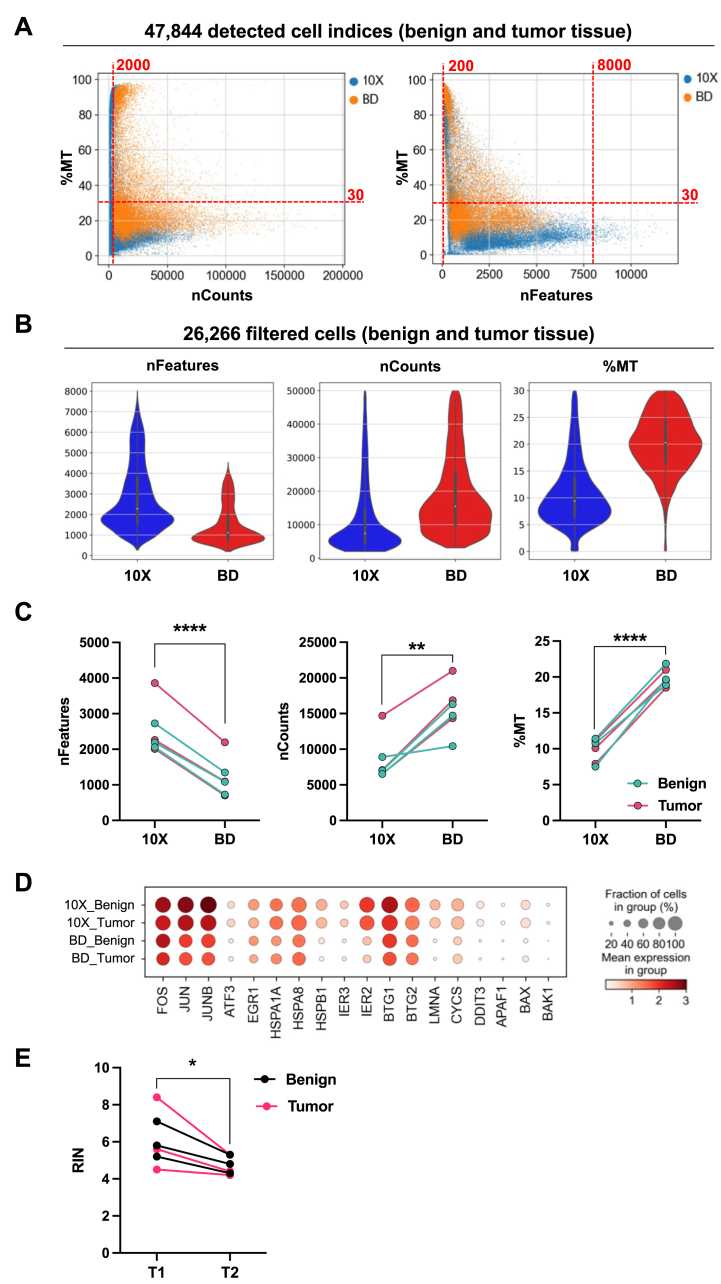
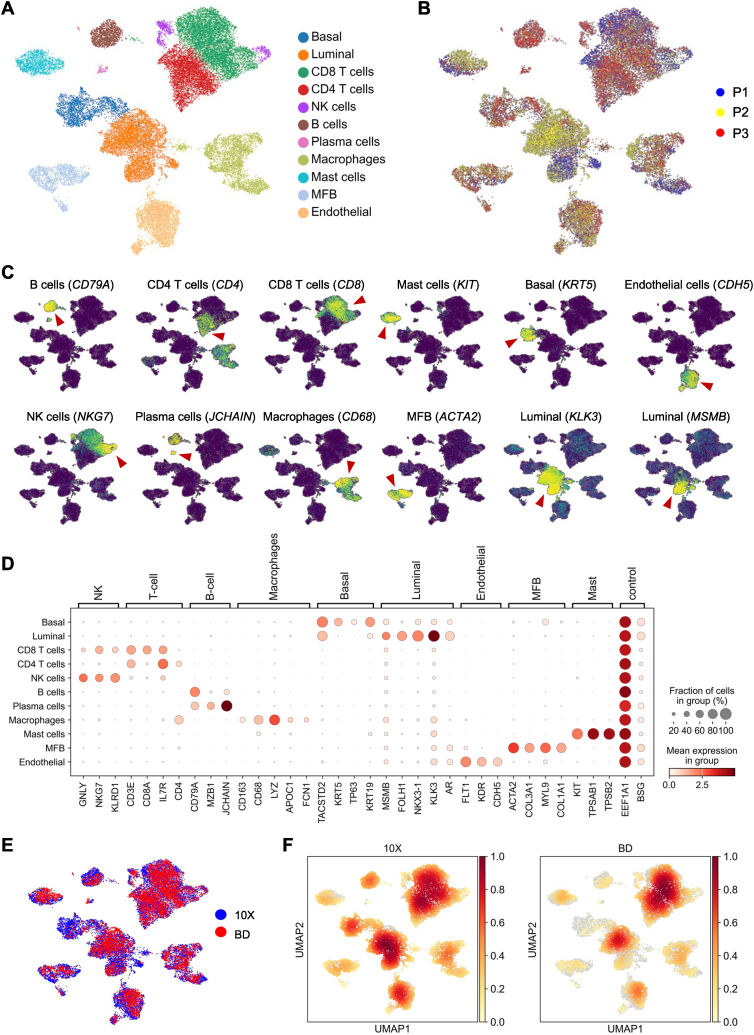
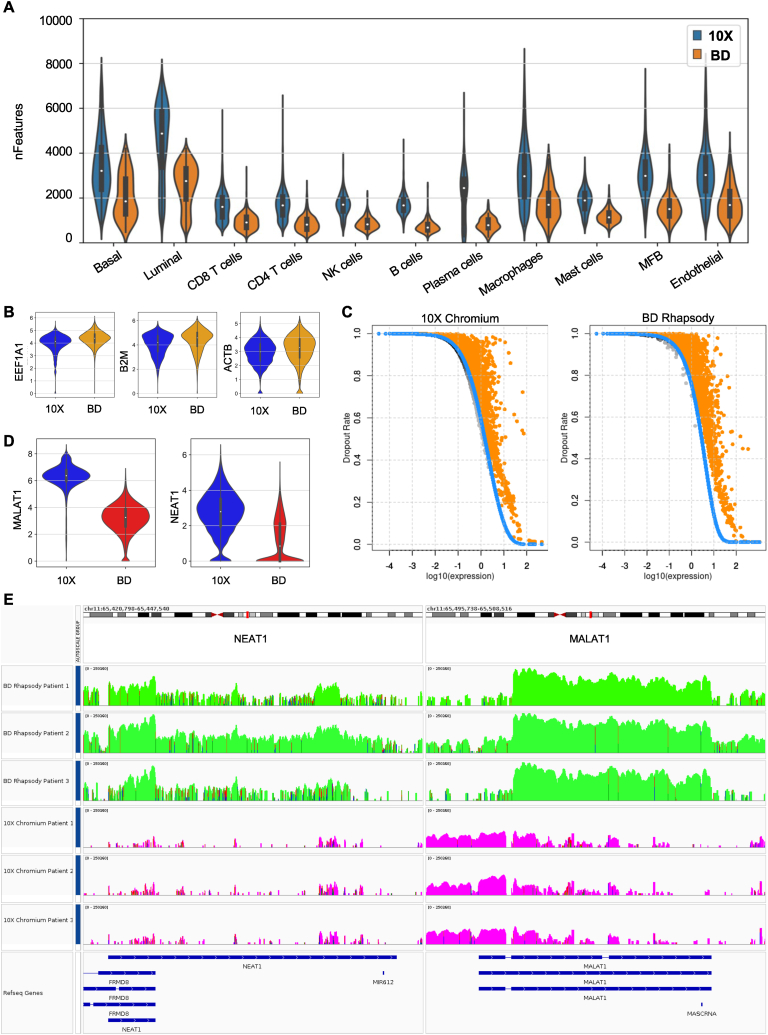
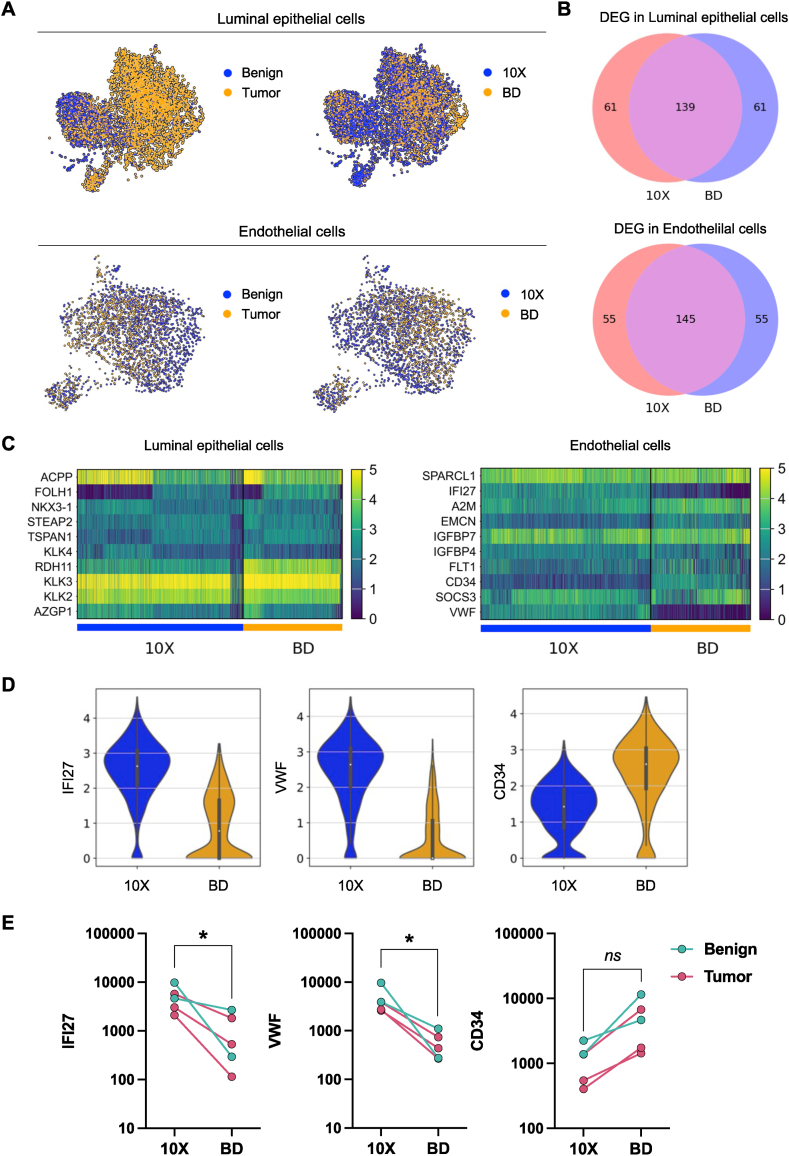
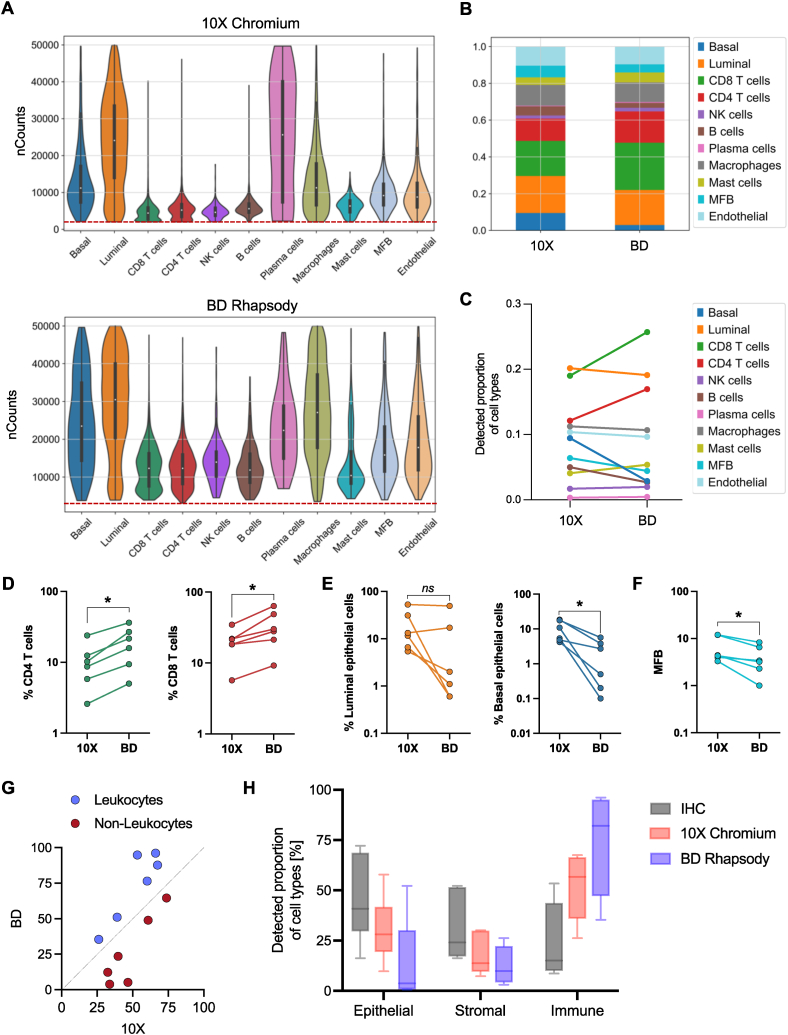
The development of single-cell omics tools has enabled scientists to study the tumor microenvironment (TME) in unprecedented detail. However, each of the different techniques may have its unique strengths and limitations. Here we directly compared two commercially available high-throughput single-cell RNA sequencing (scRNA-seq) technologies - droplet-based 10X Chromium vs. microwell-based BD Rhapsody - using paired samples from patients with localized prostate cancer (PCa) undergoing a radical prostatectomy. Although high technical consistency was observed in unraveling the whole transcriptome, the relative abundance of cell populations differed. Cells with low mRNA content such as T cells were underrepresented in the droplet-based system, at least partly due to lower RNA capture rates. In contrast, microwell-based scRNA-seq recovered less cells of epithelial origin. Moreover, we discovered platform-dependent variabilities in mRNA quantification and cell-type marker annotation. Overall, our study provides important information for selection of the appropriate scRNA-seq platform and for the interpretation of published results.

Keywords: 10X Chromium; BD Rhapsody; Low-mRNA content cells; Neutrophils; Prostate cancer; Single-cell RNA sequencing.


Conflict of interest statement

The authors declare that they have no known competing financial interests or personal relationships that could have appeared to influence the work reported in this paper.

Figures

Image 1
Graphical abstract
Fig. 1
Fig. 1
Experimental setup. (A) Summary of the analysis workflow. (B) scRNA-seq datasets were generated from freshly isolated benign prostate (n = 3) and PCa (n = 3) tissues using the 10X Chromium and BD Rhapsody platforms, respectively. Cell numbers are shown for each step starting with number of isolated cells from each sample used for the two platforms. In the 10X Chromium dataset 29,484 cells (cells with >100 genes expressed in ≥3 cells) were detected and subjected to quality control processing. In the BD Rhapsody dataset 25,841 cell barcodes were identified and 21,196 cell barcodes with sample-tag information could be recovered during sample demultiplexing. Thereof, 18,360 cells (cells with >100 genes expressed in ≥3 cells) were subjected to quality control processing.
Fig. 2
Fig. 2
QC metrics in datasets generated with 10X Chromium and BD Rhapsody. (A) Correlation of %MT with nCounts and nFeatures quality metrics in data generated with 10X Chromium and BD Rhapsody using cells expressing >100 genes (features). Applied cut-off values to filter for high quality cells are indicated (nCounts >2000, nFeatures >200 and < 8000, %MT < 30%). (B) nFeature, nCount, and %MT quality metrics in filtered cells derived from benign and PCa tumor tissues. (C) nFeature, nCount, and %MT levels in individual samples processed with 10X Chromium and BD Rhapsody (n = 6; benign n = 3, tumor n = 3). Paired t-test, **p ≤ 0.01, ****p ≤ 0.0001. (D) Expression of stress-related transcripts in 10X Chromium and BD Rhapsody data generated from benign prostate and PCa samples. (E) RNA quality (RIN) before (T1) and after (T2) the sample-tag staining procedure in freshly isolated lung cancer (NSCLC) tumor tissues (n = 6). Paired t-test, *p ≤ 0.05.
Fig. 3
Fig. 3
Prostate cancer tumor microenvironment revealed by 10X Chromium and BD Rhapsody. (A) Uniform manifold approximation and projection (UMAP) plot of 26,266 high-quality cells, color-coded by cell type. (B) UMAP plot colored by cells derived from individual patients. (C) UMAP plots colored for the expression of indicated celltype-specific marker genes. (D) Gene expression levels of cell type-specific markers. (E) UMAP plot colored by cells derived from datasets generated with 10X Chromium or BD Rhapsody. (F) UMAP plots showing the cell-density in datasets generated with 10X Chromium or BD Rhapsody. (For interpretation of the references to color in this figure legend, the reader is referred to the Web version of this article.)
Fig. 4
Fig. 4
Molecule detection efficiency and sequencing library complexity. (A) Number of genes detected per cell in individual cell types depicted by 10X Chromium and BD Rhapsody. (B) Gene expression levels of indicated house-keeping genes in datasets generated with 10X Chromium and BD Rhapsody. (C) Dropout ratios as a function of log10 expression for 10X Chromium (left) and BD Rhapsody (right). Orange dots represent the significant features under the DANB model (at 1% FDR) while gray dots represent the non-significant features. Blue dots represent the expected dropout probabilities as returned from the DANB model. (D) Gene expression levels of MALAT1 and NEAT1 in datasets generated with 10X Chromium and BD Rhapsody. (E) Gene body read coverage of NEAT1 (left) and MALAT1 (right). BD Rhapsody samples are represented with green and 10X Chromium samples with purple colours. Data range is set to 0–250360 (the min - max read output of both platforms for the specific genomic regions) and a log scale is used to visualize the data and to allow comparisons. The blue and red bands indicate mismatches between the reads and the reference genome's nucleotide sequences. (For interpretation of the references to color in this figure legend, the reader is referred to the Web version of this article.)
Fig. 5
Fig. 5
Platform-specific gene quantification and cell-type marker identification. (A) UMAP blots of luminal epithelial cells and endothelial cells colored by cells derived from benign and PCa tumor tissues as well as by cells derived from datasets generated with 10X Chromium and BD Rhapsody. (B) VENN diagram of top 200 DEG detected by 10X Chromium or BD Rhapsody in luminal epithelial cells (upper panel) and endothelial cells (lower panel). (C) Top expressed genes in luminal epithelial cells and endothelial cells in datasets generated with 10X Chromium and BD Rhapsody. (D) Gene expression levels of IFI27, VWF, and CD34 detected in endothelial cells by 10X Chromium and BD Rhapsody. (E) Gene expression levels of IFI27, VWF, and CD34 in individual samples. Each dot refers to a sample (benign or tumor tissue) with at least 40 endothelial cells in both 10X Chromium and BD Rhapsody groups. Paired t-test, *p ≤ 0.05.
Fig. 6
Fig. 6
Platform-dependent cellular composition in single-cell RNA sequencing data. (A) Number of captured transcripts (total counts) in individual cell types recovered with 10X Chromium (upper panel) and BD Rhapsody (lower panel). (B) Relative cell-type composition in benign prostate and PCa tissues from three individual patients in data generated with 10X Chromium and BD Rhapsody. (C) Detected proportion of cell-types in benign prostate and PCa tissues from three individual patients in data generated with 10X Chromium vs. BD Rhapsody. (D–F) The proportion of CD4 T cells and CD8 T cells (D), luminal and basal epithelial cells (E), and myofibroblasts (MFB) (F), depicted by 10X Chromium vs. BD Rhapsody in individual samples. Paired t-test, *p ≤ 0.05. (G) The proportion of leukocytes and non-leukocytes depicted by 10X Chromium vs BD Rhapsody. (H) Proportions of epithelial, stromal, and CD45+ immune cells in benign prostate and PCa tissues from three individual patients determined by IHC and by scRNA-seq using 10X Chromium or BD Rhapsody.

Similar articles

Cited by

References

    1. Lambrechts D., Wauters E., Boeckx B., Aibar S., Nittner D., Burton O., et al. Phenotype molding of stromal cells in the lung tumor microenvironment. Nature medicine. 2018;24:1277–1289. - PubMed
    1. Guo X., Zhang Y., Zheng L., Zheng C., Song J., Zhang Q., et al. Global characterization of T cells in non-small-cell lung cancer by single-cell sequencing. Nature medicine. 2018;24:978–985. - PubMed
    1. Zhang Q., He Y., Luo N., Patel S.J., Han Y., Gao R., et al. Landscape and dynamics of single immune cells in hepatocellular carcinoma. Cell. 2019;179:829–845 e820. - PubMed
    1. Goveia J., Rohlenova K., Taverna F., Treps L., Conradi L.C., Pircher A., et al. An integrated gene expression landscape profiling approach to identify lung tumor endothelial cell heterogeneity and angiogenic candidates. Cancer Cell. 2020;37:421. - PubMed
    1. Azizi E., Carr A.J., Plitas G., Cornish A.E., Konopacki C., Prabhakaran S., et al. Single-cell map of diverse immune phenotypes in the breast tumor microenvironment. Cell. 2018;174:1293–1308 e1236. - PMC - PubMed

LinkOut - more resources