. 2024 Mar 22;10(7):e28345.
doi: 10.1016/j.heliyon.2024.e28345. eCollection 2024 Apr 15.

In-vivo 3-dimensional spine and lower body gait symmetry analysis in healthy individuals

Affiliations

In-vivo 3-dimensional spine and lower body gait symmetry analysis in healthy individuals

Paul G Arauz et al. Heliyon. .

Abstract

Background: Numerous research studies have delved into the biomechanics of walking, focusing on the spine and lower extremities. However, understanding the symmetry of walking in individuals without health issues poses a challenge, as those with normal mobility may exhibit uneven movement patterns due to inherent functional differences between their left and right limbs. The goal of this study is to examine the three-dimensional kinematics of gait symmetry in the spine and lower body during both typical and brisk overground walking in healthy individuals. The analysis will utilize statistical methods and symmetry index approaches. Furthermore, the research aims to investigate whether factors such as gender and walking speed influence gait symmetry.

Methods: Sixty young adults in good health, comprising 30 males and 30 females, underwent motion capture recordings while engaging in both normal and fast overground walking. The analysis focused on interlimb comparisons and corresponding assessments of side-specific spine and pelvis motions.

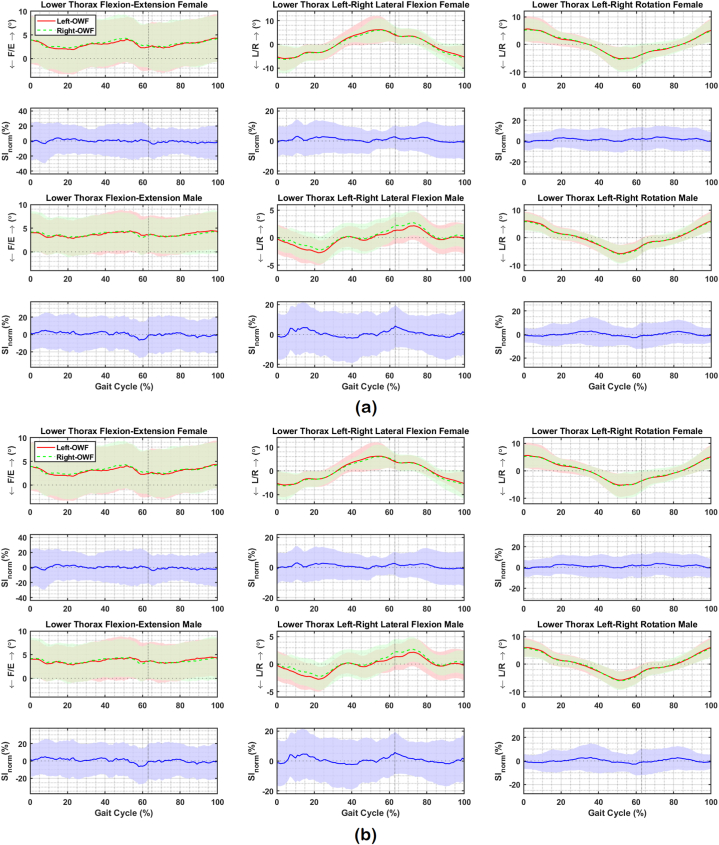
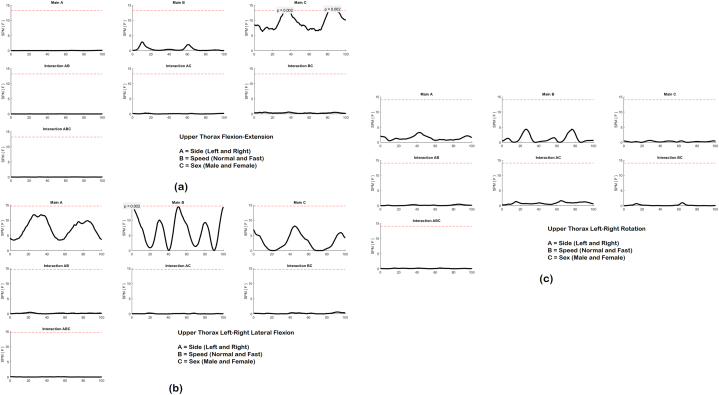
Results: Statistical Parametric Mapping (SPM) predominantly revealed gait symmetries between corresponding left and right motions in the spine, pelvis, hip, knee, and ankle during both normal and fast overground walking. Notably, both genders exhibited asymmetric pelvis left-right obliquity, with women and men showing an average degree of asymmetry between sides of 0.9 ± 0.1° and 1.5 ± 0.1°, respectively. Furthermore, the analysis suggested that neither sex nor walking speed appeared to exert influence on the 3D kinematic symmetry of the spine, pelvis, and lower body in healthy individuals during gait. While the maximum normalized symmetry index (SInorm) values for the lower thorax, upper lumbar, lower lumbar, pelvis, hip, knee, and ankle displayed significant differences between sexes and walking speeds for specific motions, no interaction between sex and walking speed was observed.

Significance: The findings underscore the potential disparities in data interpretations between the two approaches. While SPM discerns temporal variations in movement, these results offer valuable insights that may enhance our comprehension of gait symmetry in healthy individuals, surpassing the limitations of straightforward discrete parameters like the maximum SInorm. The information gleaned from this study could serve as reference indicators for diagnosing and evaluating abnormal gait function.

Keywords: Gait symmetry; Lower body kinematics; Overground; Sex; Speed; Spine kinematics; Statistical parametric mapping; Symmetry index; Walking.


Conflict of interest statement

The authors declare that they have no known competing financial interests or personal relationships that could have appeared to influence the work reported in this paper.

Figures

Fig. 1
Fig. 1
Full body marker set. Prefixes denote the following: L: Left, R: Right, U: Upper, L: Lower, L: Lateral, and M: Medial. The following landmarks were used: Spinous process at T1 (T1), spinous process at T6 (T6), spinous process at L1 (L1), spinous process at L3 (L3), spinous process at L5 (L5), thorax (TH), lumbar (LB), anterior superior iliac spine (ASI), posterior superior iliac spine (PSI), femur (THI), epicondyle of femur (KN), tibia (TB), malleoli (AK), and foot (FT).
Fig. 2
Fig. 2
Three-dimensional coordinate systems defined for upper thorax, lower thorax, upper lumbar, lower lumbar, pelvis, left and right thigh, left and right tibia, and left and right foot segments. Local z axes were determined between T1 and T6, T6 and L1, L1 and L3, and L3 and L5 for upper thorax, lower thorax, upper lumbar, and lower lumbar segments, respectively. Cross product of the z axis and the vector defined by the two midpoint markers determined the x axis of each spine segment. Joint angles defined for the upper thorax, lower thorax, upper lumbar, and lower lumbar. The left and right anterior superior iliac spine (ASIS) and posterior superior iliac spine (PSIS) markers defined the local pelvis axes, with the y axis defined between left and right ASIS, and the x axis pointing anteriorly. Anatomical hip, knee, ankle joint axes were projected on thigh, tibia, and foot clusters, respectively, with the local z axis along the long axis of the femur, tibia, and foot, and the local y axis pointing laterally.
Fig. 3
Fig. 3
Average and standard deviation of upper thorax flexion-extension (F/E), left-right (L/R) lateral flexion, and (L/R) rotation, for left and right sides of males and females during one gait cycle of (a) normal overground walking (OWN) and (b) fast overground walking (OWF) in sixty healthy participants. The normalized symmetry index (SInorm) calculated during one gait cycle of OWN and OWF. Solid and dashed lines correspond to average left and right sides, as well as average SInorm, and shaded areas correspond to standard deviation. Black dotted vertical lines denote toe-off.
Fig. 4
Fig. 4
Average and standard deviation of lower thorax flexion-extension (F/E), left-right (L/R) lateral flexion, and (L/R) rotation, for left and right sides of males and females during one gait cycle of (a) normal overground walking (OWN) and (b) fast overground walking (OWF) in sixty healthy participants. The normalized symmetry index (SInorm) calculated during one gait cycle of OWN and OWF. Solid and dashed lines correspond to average left and right sides, as well as average SInorm, and shaded areas correspond to standard deviation. Black dotted vertical lines denote toe-off.
Fig. 5
Fig. 5
Average and standard deviation of upper lumbar flexion-extension (F/E), left-right (L/R) lateral flexion, and (L/R) rotation, for left and right sides of males and females during one gait cycle of (a) normal overground walking (OWN) and (b) fast overground walking (OWF) in sixty healthy participants. The normalized symmetry index (SInorm) calculated during one gait cycle of OWN and OWF. Solid and dashed lines correspond to average left and right sides, as well as average SInorm, and shaded areas correspond to standard deviation. Black dotted vertical lines denote toe-off.
Fig. 6
Fig. 6
Average and standard deviation of lower lumbar flexion-extension (F/E), left-right (L/R) lateral flexion, and (L/R) rotation, for left and right sides of males and females during one gait cycle of (a) normal overground walking (OWN) and (b) fast overground walking (OWF) in sixty healthy participants. The normalized symmetry index (SInorm) calculated during one gait cycle of OWN and OWF. Solid and dashed lines correspond to average left and right sides, as well as average SInorm, and shaded areas correspond to standard deviation. Black dotted vertical lines denote toe-off.
Fig. 7
Fig. 7
Average and standard deviation of pelvis posterior-anterior (P/A) flexion, left-right (L/R) lateral obliquity, and (L/R) rotation, for left and right sides of males and females during one gait cycle of (a) normal overground walking (OWN) and (b) fast overground walking (OWF) in sixty healthy participants. Green bars on the horizontal axis depict where, in % of gait cycle, left side angles were greater or lesser than right side angles. The normalized symmetry index (SInorm) calculated during one gait cycle of OWN and OWF. Solid and dashed lines correspond to average left and right sides, as well as average SInorm, and shaded areas correspond to standard deviation. Black dotted vertical lines denote toe-off. (For interpretation of the references to colour in this figure legend, the reader is referred to the Web version of this article.)
Fig. 8
Fig. 8
Average and standard deviation of hip flexion-extension (F/E), adduction-abduction (Ad/Ab), and internal-external (Int/Ext) rotation, for left and right sides of males and females during one gait cycle of (a) normal overground walking (OWN) and (b) fast overground walking (OWF) in sixty healthy participants. The normalized symmetry index (SInorm) calculated during one gait cycle of OWN and OWF. Solid and dashed lines correspond to average left and right sides, as well as average SInorm, and shaded areas correspond to standard deviation. Black dotted vertical lines denote toe-off.
Fig. 9
Fig. 9
Average and standard deviation of knee flexion-extension (F/E), adduction-abduction (Ad/Ab), and internal-external (Int/Ext) rotation, for left and right sides of males and females during one gait cycle of (a) normal overground walking (OWN) and (b) fast overground walking (OWF) in sixty healthy participants. The normalized symmetry index (SInorm) calculated during one gait cycle of OWN and OWF. Solid and dashed lines correspond to average left and right sides, as well as average SInorm, and shaded areas correspond to standard deviation. Black dotted vertical lines denote toe-off.
Fig. 10
Fig. 10
Average and standard deviation of ankle dorsi-plantar flexion (DF/PF), eversion-inversion (Eve/Inv), and internal-external (Int/Ext) rotation, for left and right sides of males and females during one gait cycle of (a) normal overground walking (OWN) and (b) fast overground walking (OWF) in sixty healthy participants. The normalized symmetry index (SInorm) calculated during one gait cycle of OWN and OWF. Solid and dashed lines correspond to average left and right sides, as well as average SInorm, and shaded areas correspond to standard deviation. Black dotted vertical lines denote toe-off.
Fig. A1
Fig. A1
Results of a three-way ANOVA SPM analysis for upper thorax (a) flexion-extension, (b) left-right lateral flexion, and (c) left-right rotation angles during a gait cycle of overground walking. Plots indicate whether there is a statistically significant relationship between each factor: associated side (left vs. right) motion, walking speed (normal vs. fast), and sex (male vs. female), and the response variable: joint angle, along with whether there are any interaction effects between the factors. Supra-thresholds clusters indicating significance difference withing each factor and between factors are indicated in gray, and the critical threshold as red dashed line.
Fig. A2
Fig. A2
Results of a three-way ANOVA SPM analysis for lower thorax (a) flexion-extension, (b) left-right lateral flexion, and (c) left-right rotation angles during a gait cycle of overground walking. Plots indicate whether there is a statistically significant relationship between each factor: associated side (left vs. right) motion, walking speed (normal vs. fast), and sex (male vs. female), and the response variable: joint angle, along with whether there are any interaction effects between the factors. Supra-thresholds clusters indicating significance difference withing each factor and between factors are indicated in gray, and the critical threshold as red dashed line.
Fig. A3
Fig. A3
Results of a three-way ANOVA SPM analysis for upper lumbar (a) flexion-extension, (b) left-right lateral flexion, and (c) left-right rotation angles during a gait cycle of overground walking. Plots indicate whether there is a statistically significant relationship between each factor: associated side (left vs. right) motion, walking speed (normal vs. fast), and sex (male vs. female), and the response variable: joint angle, along with whether there are any interaction effects between the factors. Supra-thresholds clusters indicating significance difference withing each factor and between factors are indicated in gray, and the critical threshold as red dashed line.
Fig. A4
Fig. A4
Results of a three-way ANOVA SPM analysis for lower lumbar (a) flexion-extension, (b) left-right lateral flexion, and (c) left-right rotation angles during a gait cycle of overground walking. Plots indicate whether there is a statistically significant relationship between each factor: associated side (left vs. right) motion, walking speed (normal vs. fast), and sex (male vs. female), and the response variable: joint angle, along with whether there are any interaction effects between the factors. Supra-thresholds clusters indicating significance difference withing each factor and between factors are indicated in gray, and the critical threshold as red dashed line.
Fig. A5
Fig. A5
Results of a three-way ANOVA SPM analysis for pelvis (a) posterior-anterior tilt, (b) left-right obliquity, and (c) left-right rotation angles during a gait cycle of overground walking. Plots indicate whether there is a statistically significant relationship between each factor: associated side (left vs. right) motion, walking speed (normal vs. fast), and sex (male vs. female), and the response variable: joint angle, along with whether there are any interaction effects between the factors. Supra-thresholds clusters indicating significance difference withing each factor and between factors are indicated in gray, and the critical threshold as red dashed line.
Fig. A6
Fig. A6
Results of a three-way ANOVA SPM analysis for hip (a) flexion-extension, (b) adduction-abduction, and (c) internal-external rotation angles during a gait cycle of overground walking. Plots indicate whether there is a statistically significant relationship between each factor: associated side (left vs. right) motion, walking speed (normal vs. fast), and sex (male vs. female), and the response variable: joint angle, along with whether there are any interaction effects between the factors. Supra-thresholds clusters indicating significance difference withing each factor and between factors are indicated in gray, and the critical threshold as red dashed line.
Fig. A7
Fig. A7
Results of a three-way ANOVA SPM analysis for knee (a) flexion-extension, (b) adduction-abduction, and (c) internal-external rotation angles during a gait cycle of overground walking. Plots indicate whether there is a statistically significant relationship between each factor: associated side (left vs. right) motion, walking speed (normal vs. fast), and sex (male vs. female), and the response variable: joint angle, along with whether there are any interaction effects between the factors. Supra-thresholds clusters indicating significance difference withing each factor and between factors are indicated in gray, and the critical threshold as red dashed line.
Fig. A8
Fig. A8
Results of a three-way ANOVA SPM analysis for ankle (a) dorsi-plantar flexion, (b) eversion-inversion, and (c) internal-external rotation angles during a gait cycle of overground walking. Plots indicate whether there is a statistically significant relationship between each factor: associated side (left vs. right) motion, walking speed (normal vs. fast), and sex (male vs. female), and the response variable: joint angle, along with whether there are any interaction effects between the factors. Supra-thresholds clusters indicating significance difference withing each factor and between factors are indicate.

Similar articles

Cited by

References

    1. Fukuchi C.A., Fukuchi R.K., Duarte M. Effects of walking speed on gait biomechanics in healthy participants: a systematic review and meta-analysis. Syst. Rev. 2019;8(1):1–11. - PMC - PubMed
    1. Eggleston J.D., et al. Analysis of gait symmetry during over-ground walking in children with autism spectrum disorder. Gait Posture. 2017;55:162–166. - PubMed
    1. Konz R.J., et al. A kinematic model to assess spinal motion during walking. Spine. 2006;31(24):E898–E906. - PubMed
    1. Arauz P., Peng Y., Kwon Y.-M. Knee motion symmetry was not restored in patients with unilateral bi-cruciate retaining total knee arthroplasty—in vivo three-dimensional kinematic analysis. Int. Orthop. 2018;42(12):2817–2823. - PubMed
    1. Arauz P., et al. In-vivo 3-Dimensional gait symmetry analysis in patients with bilateral total hip arthroplasty. J. Biomech. 2018;77:131–137. - PubMed

LinkOut - more resources