. 2024 Apr 16:14:1325794.
doi: 10.3389/fonc.2024.1325794. eCollection 2024.

Role of proteoglycan synthesis genes in osteosarcoma stem cells

Affiliations

Role of proteoglycan synthesis genes in osteosarcoma stem cells

Ryoma Osumi et al. Front Oncol. .

Abstract

Osteosarcoma stem cells (OSCs) contribute to the pathogenesis of osteosarcoma (OS), which is the most common malignant primary bone tumor. The significance and underlying mechanisms of action of proteoglycans (PGs) and glycosaminoglycans (GAGs) in OSC phenotypes and OS malignancy are largely unknown. This study aimed to investigate the role of PG/GAG biosynthesis and the corresponding candidate genes in OSCs and poor clinical outcomes in OS using scRNA-seq and bulk RNA-seq datasets of clinical OS specimens, accompanied by biological validation by in vitro genetic and pharmacological analyses. The expression of β-1,3-glucuronyltransferase 3 (B3GAT3), one of the genes responsible for the biosynthesis of the common core tetrasaccharide linker region of PGs, was significantly upregulated in both OSC populations and OS tissues and was associated with poor survival in patients with OS with high stem cell properties. Moreover, the genetic inactivation of B3GAT3 by RNA interference and pharmacological inhibition of PG biosynthesis abrogated the self-renewal potential of OSCs. Collectively, these findings suggest a pivotal role for B3GAT3 and PG/GAG biosynthesis in the regulation of OSC phenotypes and OS malignancy, thereby providing a potential target for OSC-directed therapy.

Keywords: 3glucuronyltransferase 3; glycosaminoglycan; osteosarcoma; osteosarcoma stem cell; proteoglycan; β-1.


Conflict of interest statement

EH received grants from the Japan Society for the Promotion of Science for this study. The remaining authors declare that the research was conducted in the absence of any commercial or financial relationships that could be constructed as a potential conflict of interest.

Figures
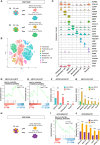
Figure 1
Figure 1
B3GAT3 is upregulated in the OSC population of patients with OS. (A) Schematic of the identification of the OSC population in GSE152048. (a) ABCG1, KLF4, and MYC co-expressing cells or (b) ABCG1, KLF4, and KIT co-expressing cells were defined as OSCs, respectively. (B) t-SNE plot of cell clusters classified in OS tissues. (C) Violin plots showing the normalized expression levels of 27 representative marker genes across 8 clusters. (D, E) Enrichment plot for a gene set related to “stemness” between OSCs ([D] ABCG1, KLF4, and MYC or [E] ABCG1, KLF4, and KIT co-expressing cells) and non-OSCs. (F, G) Barplot showing the expression levels of PG/GAG biosynthesis genes between OSCs ([F] ABCG1, KLF4, and MYC or [G] ABCG1, KLF4, and KIT co-expressing cells) and non-OSCs. (*P < 0.05, **P < 0.01, ***P < 0.001). (H) Schematic of the identification of the OSC population in GSE162454. SOX2, NES, and MYC co-expressing cells were defined as OSCs. (I) Enrichment plot for a gene set related to “stemness” between OSCs and non-OSCs. (J) Barplot showing the expression levels of PG/GAG biosynthesis genes between OSCs and non-OSCs. The top five most highly expressed genes in OSCs are shown (***P < 0.001).
Figure 2
Figure 2
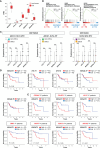
B3GAT3 is associated with poor prognosis in OS patients with high stemness. (A) The expression levels of B3GAT3, XYLT1, XYLT2, B4GALT7, and B3GALT6 in OS (n = 16) and non-tumor (n = 4) tissues using bulk RNA-seq dataset (PRJNA539828) (**P < 0.01, ***P < 0.001). (B) The enrichment plots for gene sets related to “PG metabolic process”, “PG biosynthetic process”, and “GAG biosynthesis” in OS (n = 16) and non-tumor (n = 4) tissues. (C) The expression levels of XYLT1, XYLT2, B4GALT7, and B3GALT6 in OSCs and non-OSCs using scRNA-seq datasets (GSE152048 and GSE162454). (D) Kaplan–Meier curves comparing patients with OS with high (n = 43) and low (n = 43) expression levels of B3GAT3, XYLT1, XYLT2, B4GALT7, and B3GALT6 respectively. (E) Kaplan–Meier curves comparing high (n = 22) and low (n = 21) B3GAT3 expression levels in patients with OS with high stemness. n.s., not significant.
Figure 3
Figure 3
Inhibition of B3GAT3 suppresses the self-renewal ability of 143B OS cells in vitro. (A) 143B cells were cultured under sphere or adherent conditions. (B) The mRNA expression levels of KLF4, ABCG1, SOX2, and BMI1 were determined in sphere and adherent cells using RT-qPCR (n = 4. *P < 0.05, ***P < 0.001). (C) The mRNA expression level of B3GAT3 was determined in sphere and adherent cells using RT-qPCR (n = 4. *P < 0.05). (D) B3GAT3 knockdown was verified via RT-qPCR (n = 5. **P < 0.01). (E) The sphere formation ability of 143B cells was assessed following B3GAT3 knockdown. Representative images are presented (left, scale bar = 30 μm). The number of spheres was counted (right, n = 8. **P < 0.01). (F) The mRNA expression levels of KLF4, ABCG1, SOX2, and BMI1 were determined in B3GAT3 knockdown 143B cells (n = 4. *P < 0.05, **P < 0.01). (G) 143B cells were treated with β-D-xyloside (0, 1, 2, 4, 6 mM), and sphere formation ability was assessed. Representative images are presented (left, scale bar = 30 μm). The number of spheres was counted (right, n = 5. **P < 0.01, ***P < 0.001 using Student’s t-test with Holm-Sidak correction for multiple comparisons). The mRNA expression level (normalized to GAPDH) is presented relative to that in (B, C) adherent cells and (D, F) cells treated with shCtrl. n.s., not significant.

Similar articles

Cited by

References

    1. Panez-Toro I, Muñoz-García J, Vargas-Franco JW, Renodon-Cornière A, Heymann MF, Lézot F, et al. . Advances in osteosarcoma. Curr osteoporosis Rep. (2023) 21:330–43. doi: 10.1007/s11914-023-00803-9 - DOI - PMC - PubMed
    1. Rickel K, Fang F, Tao J. Molecular genetics of osteosarcoma. Bone. (2017) 102:69–79. doi: 10.1016/j.bone.2016.10.017 - DOI - PMC - PubMed
    1. Beird HC, Bielack SS, Flanagan AM, Gill J, Heymann D, Janeway KA, et al. . Osteosarcoma. Nat Rev Dis Primers. (2022) 8:77. doi: 10.1038/s41572-022-00409-y - DOI - PubMed
    1. Gill J, Gorlick R. Advancing therapy for osteosarcoma. Nat Rev Clin Oncol. (2021) 18:609–24. doi: 10.1038/s41571-021-00519-8 - DOI - PubMed
    1. Brown HK, Schiavone K, Gouin F, Heymann MF, Heymann D. Biology of bone sarcomas and new therapeutic developments. Calcified Tissue Int. (2018) 102:174–95. doi: 10.1007/s00223-017-0372-2 - DOI - PMC - PubMed