. 2024 Sep;168(9):2577-2586.
doi: 10.1111/jnc.16118. Epub 2024 May 1.

Common anesthetic used in preclinical PET imaging inhibits metabolism of the PET tracer [18F]3F4AP

Affiliations

Common anesthetic used in preclinical PET imaging inhibits metabolism of the PET tracer [18F]3F4AP

Karla Ramos-Torres et al. J Neurochem. 2024 Sep.

Abstract

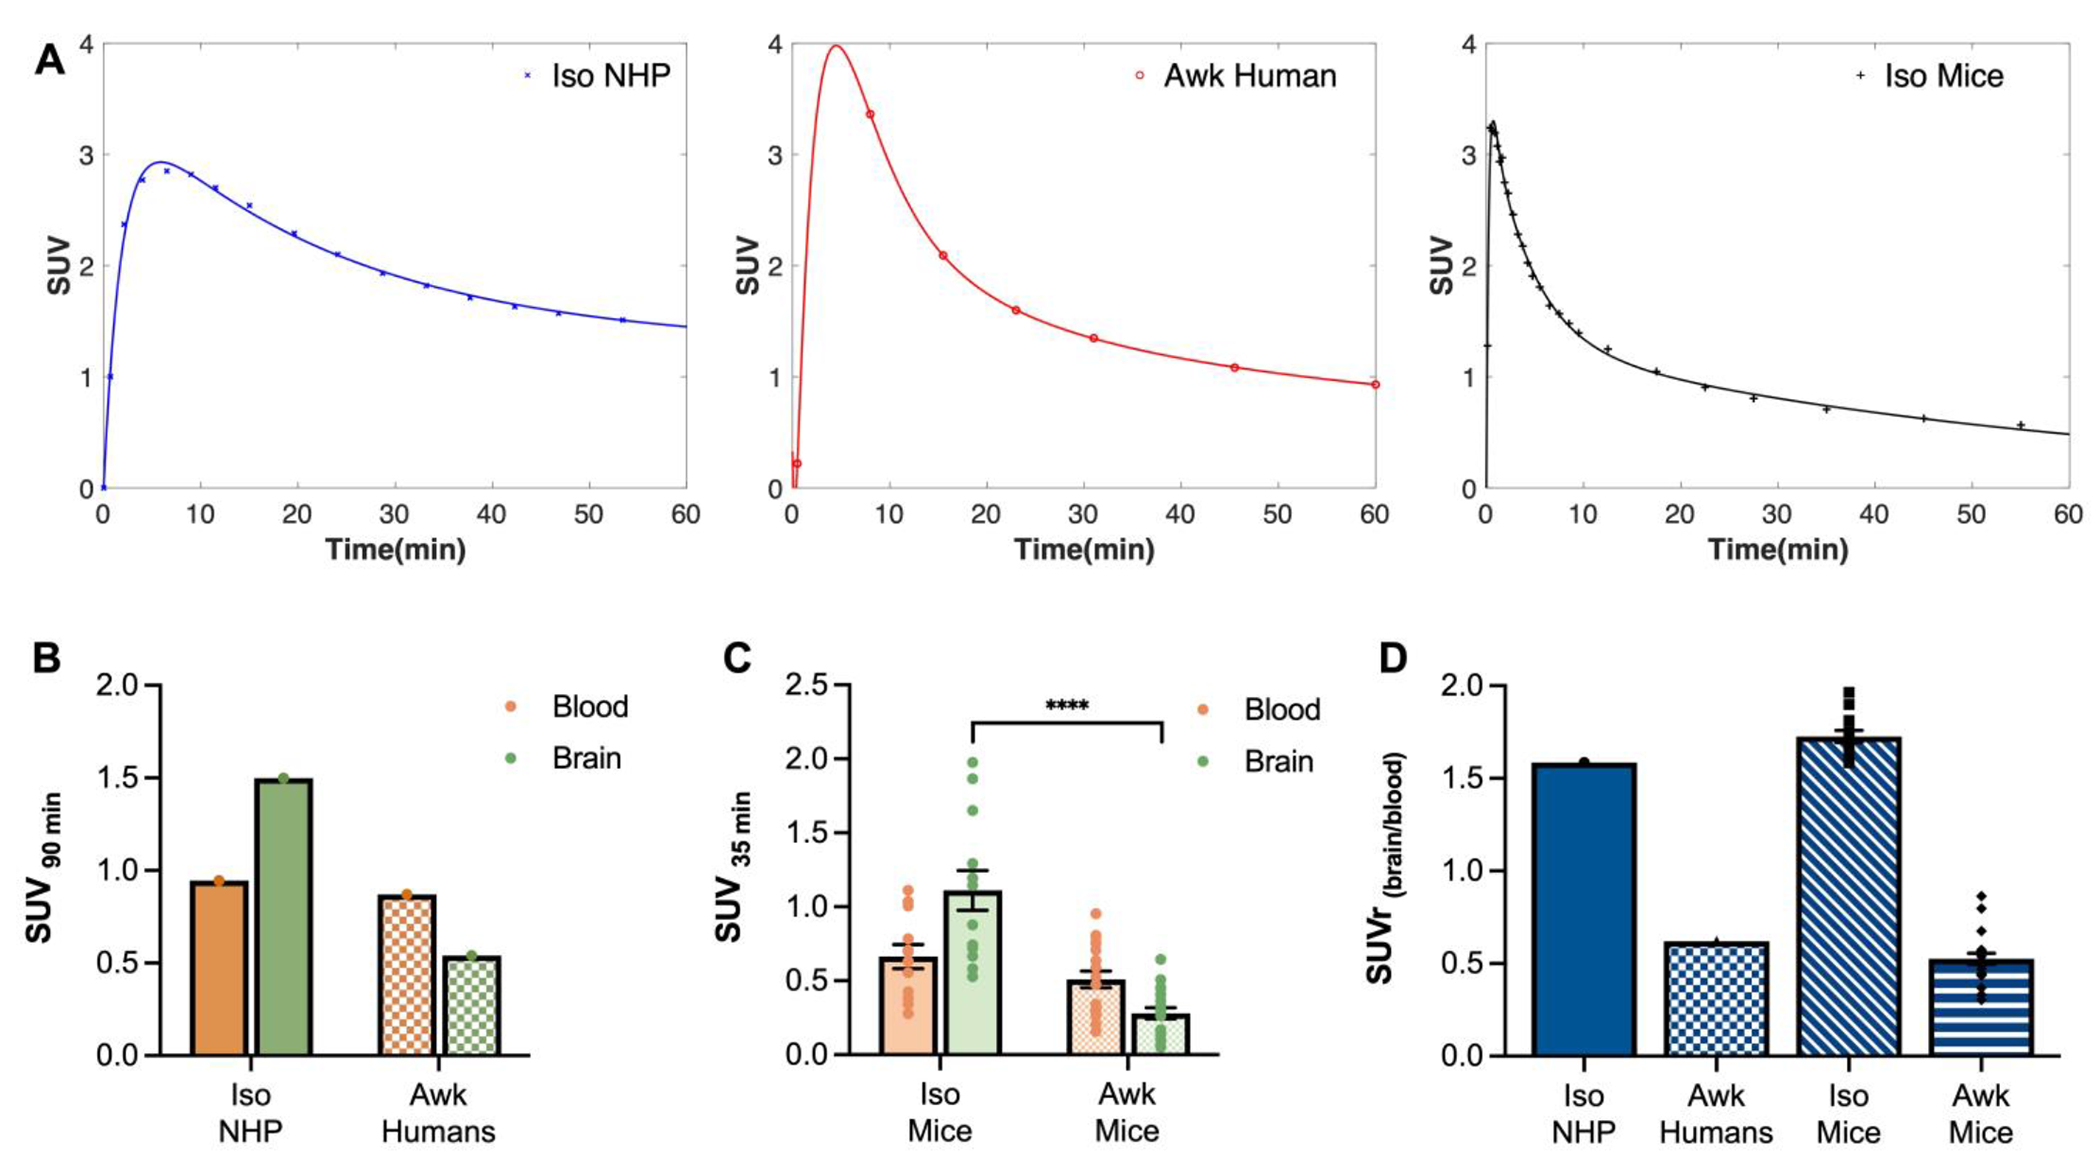
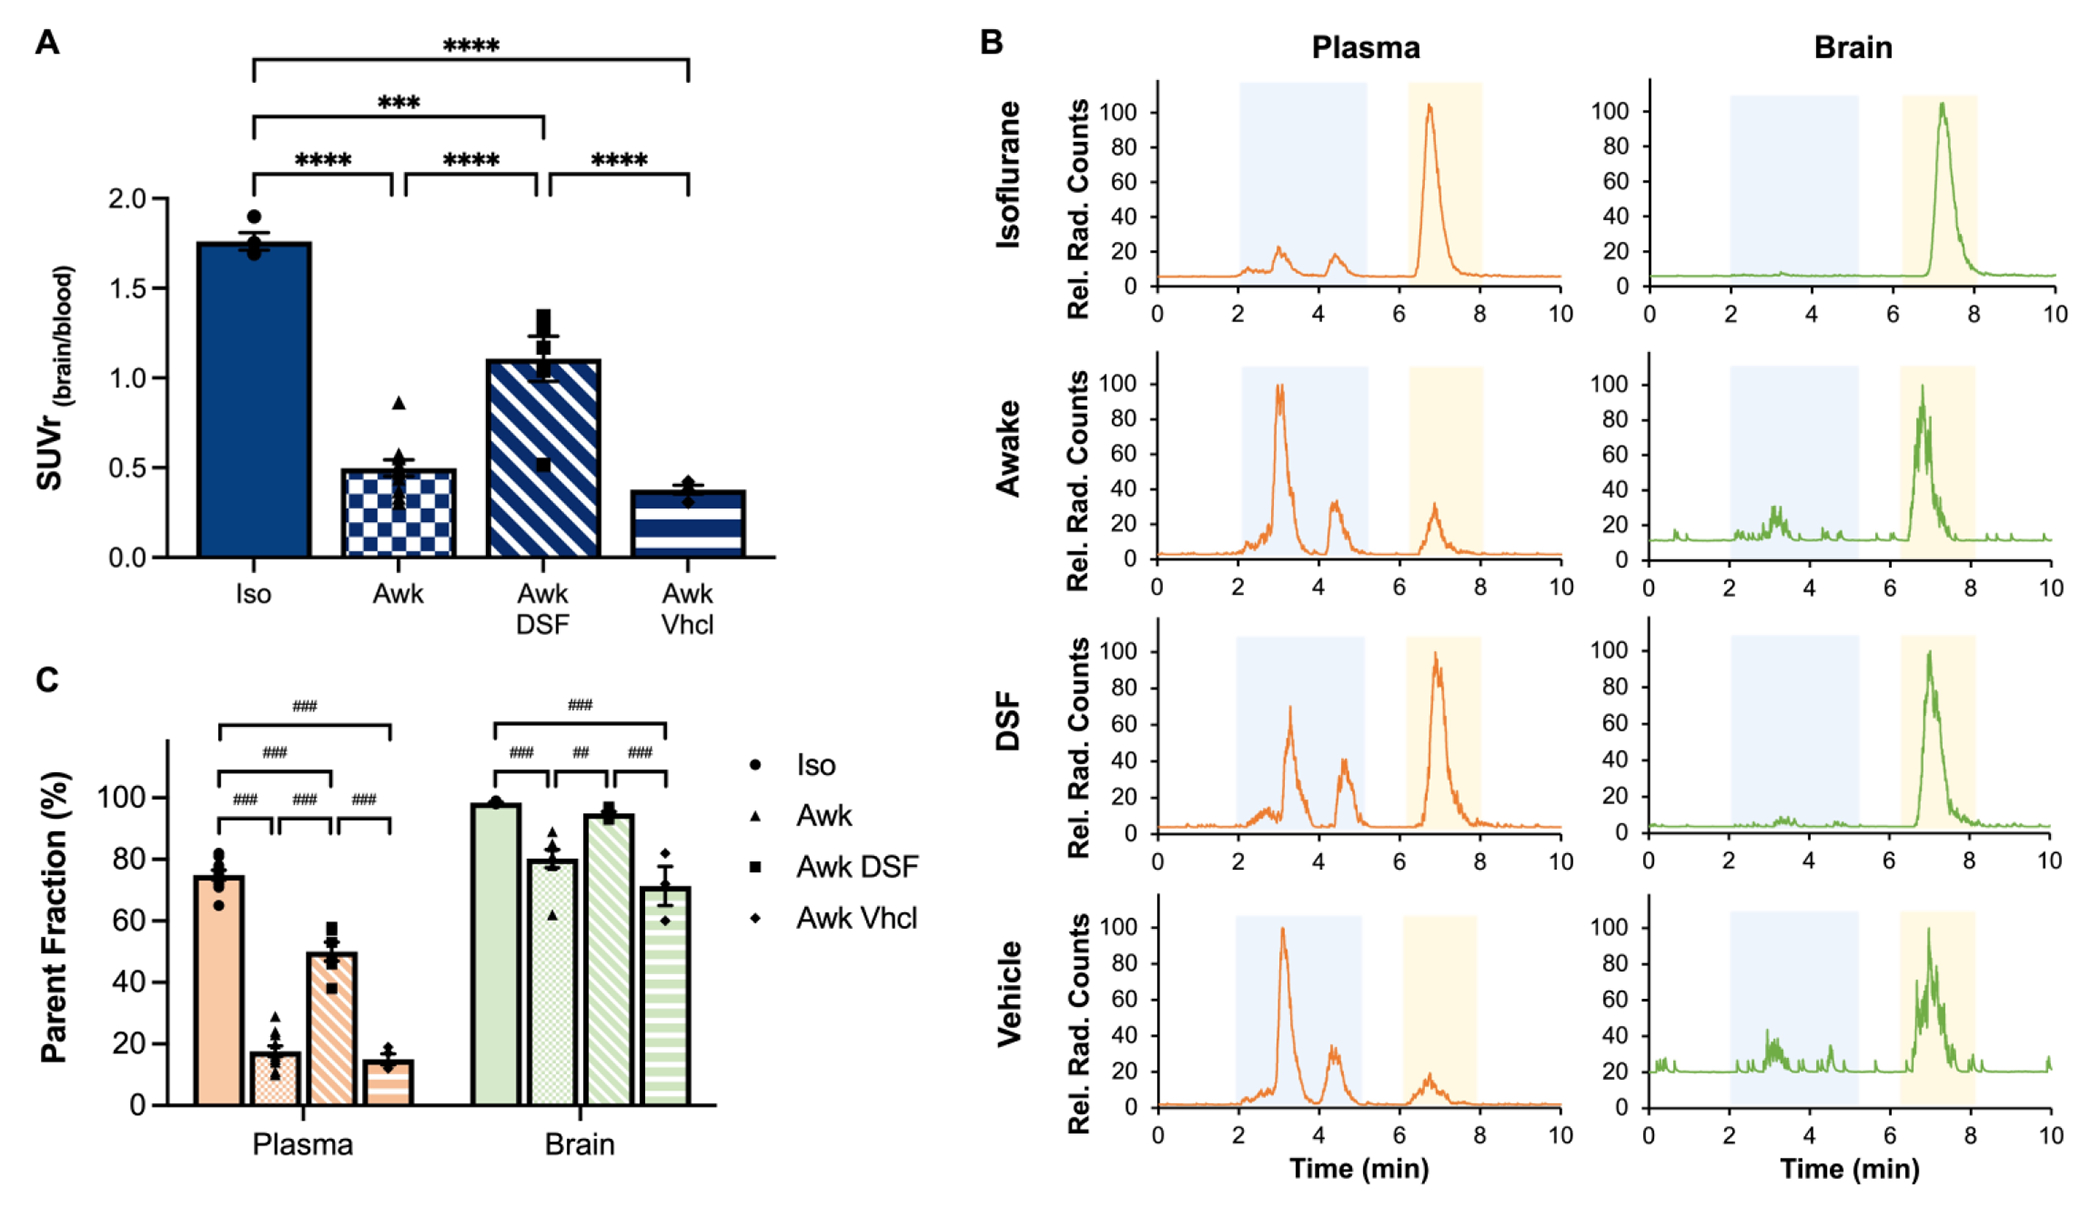
Positron emission tomography (PET) imaging studies in laboratory animals are almost always performed under isoflurane anesthesia to ensure that the subject stays still during the image acquisition. Isoflurane is effective, safe, and easy to use, and it is generally assumed to not have an impact on the imaging results. Motivated by marked differences observed in the brain uptake and metabolism of the PET tracer 3-[18F]fluoro-4-aminopyridine [(18F]3F4AP) between human and nonhuman primate studies, this study investigates the possible effect of isoflurane on this process. Mice received [18F]3F4AP injection while awake or under anesthesia and the tracer brain uptake and metabolism was compared between groups. A separate group of mice received the known cytochrome P450 2E1 inhibitor disulfiram prior to tracer administration. Isoflurane was found to largely abolish tracer metabolism in mice (74.8 ± 1.6 vs. 17.7 ± 1.7% plasma parent fraction, % PF) resulting in a 4.0-fold higher brain uptake in anesthetized mice at 35 min post-radiotracer administration. Similar to anesthetized mice, animals that received disulfiram showed reduced metabolism (50.0 ± 6.9% PF) and a 2.2-fold higher brain signal than control mice. The higher brain uptake and lower metabolism of [18F]3F4AP observed in anesthetized mice compared to awake mice are attributed to isoflurane's interference in the CYP2E1-mediated breakdown of the tracer, which was confirmed by reproducing the effect upon treatment with the known CYP2E1 inhibitor disulfiram. These findings underscore the critical need to examine the effect of isoflurane in PET imaging studies before translating tracers to humans that will be scanned without anesthesia.

Trial registration: ClinicalTrials.gov NCT04710550.

Keywords: PET imaging; [18F]3F4AP; anesthesia; metabolism; radiometabolites; radiotracer.


Conflict of interest statement

DISCLAIMER

PB has a financial interest in Fuzionaire Diagnostics and the University of Chicago. PB is a named inventor on patents related to [18F]3F4AP owned by the University of Chicago and licensed to Fuzionaire Diagnostics. Dr. Brugarolas’ interests were reviewed and are managed by MGH and Mass General Brigham in accordance with their conflict-of-interest policies. The other authors declare no conflict of interests.

Figures

Figure 1.
Figure 1.
Chemical structures of 4AP and [18F]3F4AP.
Figure 2.
Figure 2.. Experimental design.
Young adult mice are assigned to two groups (isoflurane and awake) arbitrarily. 35 min after intravenous administration of [18F]3F4AP the animals are euthanized, their blood (WB) and brain collected, and radioactivity concentration assessed. Tissue samples are processed, and plasma (PL) and brain homogenates analyzed for radiometabolite content.
Figure 3.
Figure 3.. [18F]3F4AP uptake in whole blood and brain of anesthetized and awake subjects.
A) Representative brain time-activity curves (TACs) for anesthetized non-human primates (Iso NHP), awake humans (Awk Humans), and anesthetized mice (Iso Mice) extracted from PET imaging. (B) Tracer uptake in anesthetized NHPs and awake humans in whole blood and brain at 90 min post-tracer administration. Values were calculated from previous reported experiments(10,11). C) Tracer uptake in whole blood and brain samples of anesthetized (n = 12) and awake (n = 20) mice at 35 min post-tracer administration. Values were calculated from ex vivo gamma counting of collected tissue. n = number of mice. D) Normalization by brain-blood ratios in anesthetized and awake subjects calculated from data in panels B and C. Statistical analysis was performed using two-tailed unpaired t test with Welch correction and Holm-Šídák correction for multiple comparisons. * denotes direct comparison of groups (****p < 0.0001, df = 13.82, t = 5.956). Data are means ± SEM.
Figure 4.
Figure 4.. Radio-HPLC analysis of plasma and brain of anesthetized and awake mice.
A) Representative radio-HPLC traces of plasma (orange) and brain (green) samples of anesthetized and awake mice. [18F]3F4AP parent peak signal is shown in yellow shaded box. Radioactive metabolites signals are shown in blue shaded box. B) Quantification of remaining percent parent fraction in plasma (%PFiso-pl 74.8 ± 1.6 %, n = 10; %PFawk-pl 17.7 ± 1.7 %, n = 11) and brain (%PFiso-br 98.4 ± 0.2 %, n = 5; %PFawk-br 80.3 ± 2.7 %, n = 8) after 35 min of [18F]3F4AP administration. Statistical analysis was performed using two-tailed unpaired t test with Welch correction and Holm-Šídák correction for multiple comparisons. * denotes direct comparison of groups (***p = 0.0004, df = 7.098, t = 6.181; ****p < 0.0001 df =18.98, t = 24.10). n = number of plasma or brain samples. Data are means ± SEM.
Figure 5.
Figure 5.. Inhibition of [18F]3F4AP metabolism in vivo with disulfiram treatment.
A) Brain-blood ratio normalization of tracer uptake in whole blood and brain of anesthetized (Iso, n = 4), awake (Awk, n = 11), disulfiram-treated (Awk DSF, n = 6) and vehicle control (Awk Vhcl, n = 4) mice. n = number of mice. Statistical analysis was performed using a one-way ANOVA (F = 55.78, degrees of freedom in the numerator, DFn = 3, degrees of freedom in the denominator, DFd = 21, p < 0.0001) and Tukey’s multiple comparison test. * denotes direct comparison of groups (***p = 0.0001, ****p < 0.0001) B) Representative radio-HPLC traces of plasma (orange) and brain (green) samples of anesthetized, awake, and disulfiram-treated and vehicle control mice. [18F]3F4AP parent peak signal is shown in yellow shaded box. Radioactive metabolites signals are shown in blue shaded box. C) Quantification of remaining percent parent fraction in anesthetized, awake, disulfiram-treated and vehicle control mice in plasma (%PFiso-pl 74.8 ± 1.6 %, n = 10; %PFawk-pl 17.7 ± 1.7 %, n = 11; %PFawk DSF-pl 50.0 ± 2.8 %, n = 6; %PFawk Vhcl-pl 15.0 ± 1.5 %, n = 4) and brain (%PFiso-br 98.4 ± 0.2 %, n = 5; %PFawk-br 80.3 ± 2.7 %, n = 8; %PFawk DSF-br 95.0 ± 0.5 %, n = 6; %PFawk Vhcl-br 71.3 ± 5.2 %, n = 3) after 35 min of [18F]3F4AP administration. n = number of plasma or brain samples. Statistical analysis was performed using a one-way ANOVA (plasma: F = 208.1, DFn = 3, DFd = 27, p < 0.001; brain: F = 17.46, DFn = 3, DFd = 18, p < 0.001) and Tukey’s multiple comparison test. # denotes direct comparison of groups (##p = 0.002, ###p < 0.001). Data are means ± SEM.

Update of

Similar articles

Cited by

References

    1. Phelps ME. Positron emission tomography provides molecular imaging of biological processes. Proc Natl Acad Sci U S A. 2000;97(16):9226–33. - PMC - PubMed
    1. Bomanji JB, Costa DC, Ell PJ. Clinical role of positron emission tomography in oncology. Lancet Oncol. 2001;2(3):157–64. - PubMed
    1. Politis M, Piccini P. Positron emission tomography imaging in neurological disorders. J Neurol. 2012;259(9):1769–80. - PubMed
    1. Bengel FM, Higuchi T, Javadi MS, Lautamaki R. Cardiac positron emission tomography. J Am Coll Cardiol. 2009;54(1):1–15. - PubMed
    1. Matthews PM, Rabiner EA, Passchier J, Gunn RN. Positron emission tomography molecular imaging for drug development. Br J Clin Pharmacol. 2012;73(2):175–86. - PMC - PubMed

Publication types

Associated data

LinkOut - more resources