. 2024 Mar 12;134(9):e177771.
doi: 10.1172/JCI177771.

BAP1 is required prenatally for differentiation and maintenance of postnatal murine enteric nervous system

Affiliations

BAP1 is required prenatally for differentiation and maintenance of postnatal murine enteric nervous system

Sabine Schneider et al. J Clin Invest. .

Abstract

Epigenetic regulatory mechanisms are underappreciated, yet are critical for enteric nervous system (ENS) development and maintenance. We discovered that fetal loss of the epigenetic regulator Bap1 in the ENS lineage caused severe postnatal bowel dysfunction and early death in Tyrosinase-Cre Bap1fl/fl mice. Bap1-depleted ENS appeared normal in neonates; however, by P15, Bap1-deficient enteric neurons were largely absent from the small and large intestine of Tyrosinase-Cre Bap1fl/fl mice. Bowel motility became markedly abnormal with disproportionate loss of cholinergic neurons. Single-cell RNA sequencing at P5 showed that fetal Bap1 loss in Tyrosinase-Cre Bap1fl/fl mice markedly altered the composition and relative proportions of enteric neuron subtypes. In contrast, postnatal deletion of Bap1 did not cause enteric neuron loss or impaired bowel motility. These findings suggest that BAP1 is critical for postnatal enteric neuron differentiation and for early enteric neuron survival, a finding that may be relevant to the recently described human BAP1-associated neurodevelopmental disorder.

Keywords: Development; Gastroenterology; Neurodegeneration.


Conflict of interest statement

Conflict of interest: ROH was a consultant for BlueRock Therapeutics and served on a Scientific Advisory Board for Takeda. JWH is a consultant for Castle Biosciences, Aura Biosciences, IDEAYA Biosciences, and Immunocore and has a patent related to BAP1 (US 9,809,856 and US 9,441,277).

Figures

Figure 1
Figure 1. TyrBap1+ mice fail to thrive and die with massively dilated bowel.
(A) TyrBap1 KO (KO) mice gained weight more slowly than Bap1fl/wt Tyr-Cre+ heterozygous (Het) and WT littermates. Points indicate mean weight. Linear regression and 95% confidence interval are shown. (B) TyrBap1 KO mice (right) were smaller than WT (left) or heterozygous (not shown) littermates. A representative P20 TyrBap1 KO mouse had visible abdominal distention (white arrows). (C) TyrBap1 KO died early (median survival 20 days, n = 37). Only mice left with parents and soft moist food lived beyond P25. (D) Most TyrBap1 KO had an abnormal colon by P15, with increased severity as age increased. (E) P15 WT typically had well-formed stool pellets in mid- and distal colon (arrows). (F) P15 TyrBap1 KO colon was often deformed in ways never seen in controls. Black arrowhead highlights twisted and stiff mid-colon. The more proximal colon (white arrowhead) and distal small intestine (black arrow) accumulated loose feces. (G) TyrBap1 KO colon and distal small intestine became severely distended owing to aggregated feces later in life. Representative P27 TyrBap1 KO bowel. (H) Feces accumulated in the distal small intestine (DSI) of TyrBap1 KO, increasing with age (30.4% at P15 and 88.9% at >P20). (I) White fur spots were common on TyrBap1 KO abdomen (white arrow) indicating incomplete melanocyte colonization (P10 mouse). (J) Quantitative analysis of incomplete skin colonization by melanocytes. (AJ) KO refers to Bap1fl/fl Tyr-Cre+, Het refers to Bap1fl/wt Tyr-Cre+, and WT refers to Bap1wt/wt Tyr-Cre+ genotype, except in A, where WT includes Bap1wt/wt Tyr-Cre+ and mice lacking Cre. ****P < 0.0001. (A) Repeated-measures 1-way ANOVA. (C) Log-rank (Mantel-Cox) test. (J) Two-tailed binomial test.
Figure 2
Figure 2. Proximal small intestine and colon motility are significantly impaired in P15 TyrBap1 KO mice.
(A) TyrBap1 KO have slow transit of FITC-dextran through proximal small bowel. Mean FITC fluorescence distribution ± SEM 90 minutes after gavage. Numbered segments of bowel from stomach (segment 1) to distal rectum (segment 19) are arranged along the x axis. (B) Geometric center of FITC fluorescence was more proximal for TyrBap1 KO than for Het and WT. Numbered bowel segments are indicated on the y axis. SI, small intestine. (C) P15 TyrBap1 KO passed few stool pellets over 8 hours compared with Het or WT. (D) Most P15 TyrBap1 KO had abnormal stool (diarrhea or no feces at all). (E and F) Representative kymographs depicting bowel width as a function of time and distance along proximal-distal axis of cannulated colon for P15 WT (E) and TyrBap1 KO (F). (G) Fewer colonic motor complexes were recorded for TyrBap1 KO as compared with Het and WT colons. (AG) Het refers to Bap1fl/wt Tyr-Cre+ genotype, and KO refers to TyrBap1 KO. (A and B) WT includes Bap1wt/wt Tyr-Cre+ genotype and mice lacking Cre. (CG) WT refers to Bap1wt/wt; Tyr-Cre+ genotype. (B, C, and G) Data are shown as mean ± SD. Data not significant unless otherwise indicated. *P < 0.05, **P < 0.01, ***P < 0.001, ****P < 0.0001. (B) Welch’s ANOVA test with multiple comparisons. (C and EG) Kruskal-Wallis test with Dunn’s multiple comparison. (D) Two-sided binomial test.
Figure 3
Figure 3. Neonatal Wnt1Bap1+ mice have normal enteric neuron density and proximal small intestinal motility.
(AC) Enteric neuron density is similar to WT in most bowel regions in P0 Wnt1Bap1 KO (KO). (A) Representative maximal-intensity projection Z-stacks of WT (top) and KO (bottom) along the bowel. Purple, HuC/D; green, TuJ1. Scale bar: 100 μm. (B) Quantification of P0 myenteric neuron density. (C) Quantification of P0 submucosal enteric neuron density. (D, E, G, and H) Representative kymographs depicting bowel width as a function of time and distance along proximal-distal axis proximal small intestine for P0 control (Ctrl; D and E) and KO (G and H). Low-frequency (LF) contractions (neurogenic) could be recorded for a subset of P0 Ctrl and KO pups (D and G, white arrows), while no LF contractions were detected for other Ctrl and KO (E and H). (F) Proportion of bowels where any LF contractions were recorded did not differ between P0 Ctrl and P0 KO. (I) Frequency of LF contractions did not differ between Ctrl and KO neonates if any LF contractions could be recorded. Data points from Hets are red. (AC) WT refers to Bap1wt/wt Wnt1-Cre+ or any genotype without the Wnt1-Cre transgene. Het refers to Bap1fl/wt Wnt1-Cre+ genotype. KO refers to Bap1fl/fl Wnt1-Cre+ genotype. Data not significant unless otherwise indicated. (DI) Ctrl refers to any genotype without the Wnt1-Cre transgene, or Bap1wt/wt Wnt1-Cre+ or Bap1fl/wt Wnt1-Cre+ genotype. KO refers to Wnt1Bap1 KO genotype. (B and C) PSI, proximal small intestine; DSI, distal small intestine; PCO, proximal colon; DCO, distal colon. (B, C, and I) Data are shown as mean ± SD. (B and C) Welch’s ANOVA test with Dunnett’s T3 multiple-comparison test. (I) Two-sided Student’s t test.
Figure 4
Figure 4. P0 mice have normal enteric neuron density with subtle differences in ENS anatomy, but neuron density declines with age.
(A) Representative maximal-intensity Z-stacks of myenteric plexus from P0 WT and TyrBap1 KO. Scale bar: 50 μm. (B) P0 TyrBap1 KO enteric neuron density was similar to WT. (C) Representative maximal-intensity Z-stack of P0 myenteric plexus neurons (green, HuC/D+) and Tyr-Cre lineage (magenta, TdTomato+). Arrows highlight TdTomato-negative neurons. Scale bars: 25 μm. (D) Proportion of Tyr-Cre–lineage neurons is reduced in proximal colon of P0 TyrBap1 KO versus WT. (E) Representative maximal-intensity projection Z-stacks illustrate subtle differences in P0 ENS of TyrBap1 KO versus WT. Three images are enlarged from A. White arrows highlight fine neurite bundles connecting ganglia of some TyrBap1 KO, whereas WT have fewer thicker fasciculated neurite bundles. Regional variation in distal colon ENS occurred in neonatal KO. Some regions had increased loosely connected neurons and/or small ganglia (bottom right) versus WT (top right). Scale bars: 25 μm. (F) Total neuron density in P5 TyrBap1 KO is reduced in PCO myenteric and DSI submucosal plexus versus WT. (G) Neuron density in P10 TyrBap1 KO is low in many myenteric and submucosal plexus regions versus WT. (AG) WT, Bap1wt/wt Tyr-Cre+. PSI, proximal small intestine; DSI, distal small intestine; PCO, proximal colon; DCO, distal colon. All data represent mean ± SD. *P < 0.05, **P < 0.01, ***P < 0.001. (B) Myenteric and submucosal PSI: Welch’s 2-tailed t test. Submucosal DSI: Mann-Whitney test. (D) Myenteric PSI: Welch’s 2-tailed t test. Myenteric DSI: Mann-Whitney test. (F and G) Welch’s 2-tailed t test except for (G) submucosal PSI, which used Mann-Whitney test.
Figure 5
Figure 5. P15 TyrBap1 KO enteric neuron density is low in all regions with disproportionate Tyr-Cre–lineage and cholinergic neuron loss.
(A and B) P15 TyrBap1 KO neuron density is lower than WT in myenteric (A) and submucosal plexus (B) in all regions. (C) P15 Tyr-Cre–lineage (TdTomato+) myenteric plexus neurons are disproportionately reduced in all regions of TyrBap1 KO. Tyr-Cre–lineage submucosal neurons are disproportionately reduced only in PSI. (D and E) P15 TyrBap1 KO cholinergic neuron density is reduced in myenteric (D) and submucosal plexus (E) in all regions. (F) Cholinergic neurons are disproportionately reduced for P15 TyrBap1 KO in all myenteric plexus regions but not in submucosal plexus. (G and H) P15 TyrBap1 KO nitrergic neuron (NOS1-expressing neuron) density is reduced in all myenteric (G) and submucosal plexus (H) regions evaluated. (I) Proportion of nitrergic neurons is similar in TyrBap1 KO and WT in all regions. (DF) Cholinergic neurons are defined as GFP+ using TyrBap1 Chat-GFP interbred lines. (AI) WT is Bap1wt/wt Tyr-Cre+. PSI, proximal small intestine; DSI, distal small intestine; PCO, proximal colon; DCO, distal colon. Data are represented as mean ± SD. *P < 0.05, **P < 0.01, ***P < 0.001, ****P < 0.0001. (A and B, PSI, DSI, and PCO): Unpaired 2-tailed t test with Welch’s correction. (B, DCO, and E): Two-tailed Mann-Whitney test. (C) Two-tailed unpaired t test with Welch’s correction. (D and G) Welch’s 2-tailed unpaired t test. (F) Welch’s 2-tailed unpaired t test, except for PCO, which used 2-tailed Mann-Whitney test. (H) Welch’s 2-tailed unpaired t test, except PSI, which used Mann-Whitney test. (I) Welch’s 2-tailed unpaired t test, except DSI, which used 2-tailed Mann-Whitney test.
Figure 6
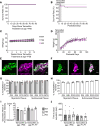
Figure 6. No evidence of increased apoptotic neuron loss, reduced neurogenesis, or increased DNA damage in distal colon of TyrBap1 KO; no change in TyrBap1 KO Hdac4–/– survival.
(A) Cleaved caspase-3+ intraganglionic cell density is similar in P5 TyrBap1 KO and WT. (B) Percentage cleaved caspase-3+ intraganglionic neurons is similar in P5 TyrBap1 KO and WT. (CG) Representative maximal-intensity Z-stacks show a cleaved caspase-3+ intraganglionic cell. (C) Purple, cleaved caspase-3. (D) Green, HuC/D. (E) Blue, Hoechst. (F) Merged. (G) Enlargement of region marked with dashed line in F. Arrow identifies intraganglionic cleaved caspase-3–expressing cell. Scale bars: 50 μm. (H) EdU+ neuron density is similar in P7 TyrBap1 KO and WT that received daily EdU injections from P4 to P6. (I) Percentage EdU+ neurons. (JN) Representative maximal-intensity Z-stacks show an EdU+ neuron at P7. (J) Purple, EdU. (K) Green, HuC/D. (L) Blue, Hoechst. (M) Merged. (N) Enlarged region marked with dashed line in M. Arrow points to EdU+ neuron. Scale bars: 50 μm, 25 μm in N. (OU) DNA damage was not detectable in P5 TyrBap1 KO or WT ENS by γH2AX staining. (O) γH2AX+ neuron density. (P) Percentage γH2AX+ neurons. (QU) Maximal-intensity Z-stack of P5 distal colon myenteric plexus shows one γH2AX+ neuron (arrowheads, arrow). (Q) Purple, γH2AX. (R) Green, HuC/D. (S) Blue, Hoechst. (T) Merged. (U) Enlarged region marked with dashed line in T. Arrow points to γH2AX+ neuron. Scale bars: 50 μm. (V) Hdac4 loss did not rescue TyrBap1 KO phenotype. TyrBap1 Hdac4fl/fl mice die early with massively dilated bowel. Tyr-Cre+ Bap1wt/wt Hdac4fl/fl mice have shortened faces and malocclusion and may survive into old age with tooth trims. (AP) Data are shown as mean ± SD. (A, B, H, I, O, and P) Unpaired 2-tailed t test. (V) Log-rank (Mantel-Cox) test.
Figure 7
Figure 7. Enteric neuron subtype ratios and gene expression are abnormal at P5 in Tyr-Cre–lineage neurons of TyrBap1 KO mice.
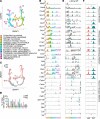
(A) UMAP projection of 14 enteric neuron subtypes identified in P5 colon myenteric plexus using unsupervised clustering (Seurat single-cell sequencing analysis pipeline). Each dot represents a single cell, and color indicates neuron subtype (cluster) identity. (B) Violin plots show expression levels of select neuron subtype and precursor markers in each cluster. (C) UMAP projection shown in A. Blue color denotes cells from Bap1wt/wt Tyr-Cre+ (WT) tissue. Red color denotes cells derived from TyrBap1 KO tissue. (D) Percentage of total cells in each individual cluster for WT or TyrBap1 KO. (E) Expression levels of selected genes in individual WT or TyrBap1 KO clusters color-coded by genotype (blue, WT; red, TyrBap1 KO). (F) Expression levels of selected genes across all WT or TyrBap1 KO neurons (blue, WT; red, TyrBap1 KO). (B, E, and F) Expression level represents ln(normalized and scaled expression level) where mean expression level for each gene across all cells in data set is defined as ln(1). (E and F) Bonferroni-corrected statistical significance (defined as P < 0.05) is indicated by asterisks (exact P values are accessible in the Supplemental Data file).
Figure 8
Figure 8. Tamoxifen-induced postnatal Bap1 loss in RetCreERT2Bap1 KO ENS did not affect survival, weight, bowel motility, or Ret-CreERT2–lineage neuron density.
(A and B) Bap1 loss after P56–P63 (A) or P1–P7 (B) tamoxifen did not cause death in RetCreERT2Bap1 KO observed ≥90 days. (C) P56–P63 tamoxifen-treated RetCreERT2Bap1 KO maintained weight like WT. (D) P1–P7 tamoxifen-treated RetCreERT2Bap1 KO gained weight normally. (E and F) Representative single confocal planes from 9-week-old RetCreERT2Bap1 KO proximal colon myenteric (E) and submucosal (F) plexus (1 week after tamoxifen). Green, HuC/D; magenta, TdTomato. Scale bars: 20 μm. Arrowheads highlight neurons without TdTomato. (G) P56–P63 tamoxifen induced Cre-mediated recombination in most neurons. Black dots, >90 days after tamoxifen; red dots, 1 week after tamoxifen. Similar proportions of Ret-CreERT2–lineage neurons in WT and RetCreERT2Bap1 KO suggest that Bap1-deficient neurons are maintained when Bap1 loss occurs in adults. (H) Cre-mediated DNA recombination occurred within 3 days of completion of P1–P7 tamoxifen in KO (filled circles), Het (open circles), and WT (open diamonds). Analysis at P8 or P9. (I) FITC-dextran transit through proximal small intestine was normal after Bap1 loss in tamoxifen-treated RetCreERT2Bap1 KO at >P56 or P1–P7. Y axis is numbered from proximal small intestine (segment 2) to mid-colon (segment 16). Analysis >90 days after tamoxifen, 90 minutes after FITC-dextran. (J) Colon bead expulsion latency was normal for RetCreERT2Bap1 KO after adult (>P56) or P1–P7 tamoxifen. Testing was >90 days after tamoxifen. (AJ) WT, Bap1wt/wt Retwt/CreERT2, or any genotype without CreERT2. Het, Bap1fl/wt Retwt/CreERT2. KO, RetCreERT2Bap1. Data are shown as mean ± SD. (A) Unable to calculate log-rank (Mantel-Cox) test due to zero deaths. (B) Log-rank (Mantel-Cox) test. (C) Simple linear regression. (D) Repeated-measures 1-way ANOVA mixed-effects model with multiple comparisons. (G) Ordinary 1-way ANOVA. (I and J, P1–P7 tamoxifen): Brown-Forsythe ANOVA test. (J, adult tamoxifen): Kruskal-Wallis test.

References

    1. Boesmans W, et al. Heterogeneity and phenotypic plasticity of glial cells in the mammalian enteric nervous system. Glia. 2015;63(2):229–241. doi: 10.1002/glia.22746. - DOI - PubMed
    1. Fung C, Vanden Berghe P. Functional circuits and signal processing in the enteric nervous system. Cell Mol Life Sci. 2020;77(22):4505–4522. doi: 10.1007/s00018-020-03543-6. - DOI - PMC - PubMed
    1. Schneider S, et al. Unexpected roles for the second brain: enteric nervous system as master regulator of bowel function. Annu Rev Physiol. 2019;81:235–259. doi: 10.1146/annurev-physiol-021317-121515. - DOI - PubMed
    1. Heuckeroth RO. Hirschsprung disease — integrating basic science and clinical medicine to improve outcomes. Nat Rev Gastroenterol Hepatol. 2018;15(3):152–167. doi: 10.1038/nrgastro.2017.149. - DOI - PubMed
    1. Le TL, et al. Dysregulation of the NRG1/ERBB pathway causes a developmental disorder with gastrointestinal dysmotility in humans. J Clin Invest. 2021;131(6):e145837. doi: 10.1172/JCI145837. - DOI - PMC - PubMed

Publication types