. 2024 Mar 19;134(9):e176474.
doi: 10.1172/JCI176474.

Induction of antiviral interferon-stimulated genes by neuronal STING promotes the resolution of pain in mice

Affiliations

Induction of antiviral interferon-stimulated genes by neuronal STING promotes the resolution of pain in mice

Manon Defaye et al. J Clin Invest. .

Abstract

Inflammation and pain are intertwined responses to injury, infection, or chronic diseases. While acute inflammation is essential in determining pain resolution and opioid analgesia, maladaptive processes occurring during resolution can lead to the transition to chronic pain. Here we found that inflammation activates the cytosolic DNA-sensing protein stimulator of IFN genes (STING) in dorsal root ganglion nociceptors. Neuronal activation of STING promotes signaling through TANK-binding kinase 1 (TBK1) and triggers an IFN-β response that mediates pain resolution. Notably, we found that mice expressing a nociceptor-specific gain-of-function mutation in STING exhibited an IFN gene signature that reduced nociceptor excitability and inflammatory hyperalgesia through a KChIP1-Kv4.3 regulation. Our findings reveal a role of IFN-regulated genes and KChIP1 downstream of STING in the resolution of inflammatory pain.

Keywords: Inflammation; Innate immunity; Ion channels; Neuroscience; Pain.


Figures

Figure 1
Figure 1. Transcriptional changes in Nav1.8 and TRPV1 neurons after CFA inflammation.
(A) Measurement of thermal withdrawal latency in the ipsilateral (i.l.) and contralateral (c.l.) hind paws of C57BL/6J mice treated with CFA (n = 6). (B) Measurement of mechanical withdrawal threshold in the ipsilateral and contralateral hind paws of C57BL/6J mice treated with CFA (n = 8). (C) Experimental approach used to isolate Nav1.8 Tg-TdTomato neurons for microarray analysis, 24 hours after intraplantar CFA. (D) FACS plots are shown as representative example of the gating strategy used for Nav1.8-Cre Tg-TdTomato lumbar DRG neuron isolation from contralateral and ipsilateral sides following CFA injection. Lumbar DRGs were pooled from 3 mice per sample. (E) Volcano plot showing transcriptional changes induced by CFA inflammation in Nav1.8 Tg-TdT neurons (n = 3 mice). P value line cutoff is P < 0.01, and fold change of 2. Select transcripts of interest are highlighted in distinct colors (inset legend). (F) Experimental approach used to isolate TRPV1-pHluorin neurons for microarray analysis, 72 hours after intraplantar CFA. (G) FACS plots are shown as representative example of the gating strategy used for WT and TRPV1-pHluorin DRG neuron isolation from ipsilateral side following CFA injection. Lumbar DRGs were pooled from 3 mice per sample. (H) Volcano plot showing transcriptional changes induced by CFA inflammation in TRPV1 neurons. P value line cutoff is P < 0.05, and fold change of 1.5. Select transcript of interest is highlighted in red (inset legend). Statistical analysis was performed using 2-way ANOVA followed by Šidák’s post hoc test (A and B; *P < 0.05, **P < 0.01, ****P < 0.0001).
Figure 2
Figure 2. Neuronal type I IFNs promote resolution of inflammatory pain.
(A) Phospho-TBK1 protein level was determined by Western blot in lumbar DRG culture (L4–L6) treated with vehicle or ADU-S100 (10 or 30 μg/mL) for 1, 3, or 6 hours, from WT (n = 4) and STING–/– (n = 3) mice. Three independent experiments were performed. (B) Phospho-TBK1 quantification at 3 hours in response to 10 μg/mL of ADU-S100. Data are normalized to TBK1 signal. (C and D) IFN-α (C) and IFN-β (D) levels were determined in the DRG culture of WT (n = 5–8) and STING–/– (n = 8) mice treated with vehicle or ADU-S100 (10 μg/mL). (E) IFN-β levels in vehicle-pretreated (n = 4) and RTX-pretreated (n = 3) DRG culture, stimulated with ADU-S100. Two vehicle samples from WT mice were used for both D and E, as these conditions were run simultaneously. (F and G) Measurement of thermal withdrawal latency in hind paws of female (F) or male (G) CFA-treated C57BL/6J mice that received either an IgG control (n = 5–6) or an IFN-β neutralizing antibody at days 3 and 8 after CFA injection (n = 5–6). (H and I) Oasl2 (H) and Isg15 (I) mRNA expression in ipsilateral and contralateral lumbar DRGs of naive C57BL/6J mice (D0, n = 6) and mice 3 days (D3, n = 7–8) and 12 days after CFA injection (D12, n = 8). (J and K) Oasl2 (J) and Isg15 (K) expression at day 9 of CFA-treated mice that received either an IgG control (n = 6) or an IFN-β neutralizing antibody (n = 6). Statistical analysis was performed using 1-way ANOVA followed by Tukey’s post hoc test (B, D, and E; *P < 0.05, ***P < 0.001, ****P < 0.0001), Kruskal-Wallis followed by Dunn’s post hoc test (C), and 2-way ANOVA followed by Tukey’s post hoc test (F and G: *P < 0.05, **P < 0.01, ***P < 0.001, ****P < 0.0001 vs. IgG i.l.; $P < 0.05 vs. IgG c.l.; H and I: *P < 0.05, **P < 0.01, ***P < 0.001) or by Bonferroni’s post hoc test (J and K; *P < 0.05).
Figure 3
Figure 3. Nociceptor-specific STING-N154S gain of function reduces thermal sensitivity and heat hyperalgesia in an IFNAR1-dependent manner.
(A) Schematic representation of transgenic TRPV1cre-GOF cKI mouse design. (B and C) IFN-α (B) and IFN-β (C) levels in DRG cultures of GOF (n = 4) and TRPV1cre-GOF (n = 6) mice stimulated with ADU-S100 (1 μg/mL). (D and E) Measurement of thermal sensitivity of naive TRPV1cre-GOF (n = 15–16) and GOF (n = 7–12) mice using the hot plate (D) or Hargreaves test (E). (F) Measurement of thermal withdrawal latency in hind paws of CFA-treated GOF (n = 9) and TRPV1cre-GOF (n = 8) mice. (G) Measurement of thermal withdrawal latency in hind paws of CFA-treated TRPV1cre-GOF mice that received either IgG control (n = 5) or IFNAR1 neutralizing antibody (MAR1) before and 3 days after CFA injection (n = 6). (H) Newly born TRPV1cre-GOF pups (P5) were given 10 μL of AAV-PHP.S-DIO-IFNAR1-shRNA or AAV-PHP.S-DIO-scrambled-shRNA intraperitoneally. (I) Measurement of thermal sensitivity of mice injected with IFNAR1-Scr (n = 9) or IFNAR1-shRNA (n = 16) AAV using the hot plate. (J) Measurement of thermal withdrawal latency of CFA-treated mice infected with IFNAR1-Scr (n = 7) or IFNAR1-shRNA (n = 9) AAV. (K) Adult TRPV1cre-GOF mice received 10 μL of AAV-DIO-IFNAR1-shRNA or AAV-DIO-scrambled-shRNA intrathecally. (L) Measurement of thermal withdrawal latency in hind paws of CFA-treated mice injected with IFNAR1-Scr (n = 7) or IFNAR1-shRNA (n = 8) AAV. Statistical analysis was performed using 1-way ANOVA followed by Tukey’s post hoc test (B and C; *P < 0.05, **P < 0.01, ***P < 0.001, ****P < 0.0001); t test (E and I) or Mann-Whitney test (D; **P < 0.01, ****P < 0.0001); and 2-way ANOVA followed by Tukey’s post hoc test (F: **P < 0.01, ***P < 0.001, ****P < 0.0001 vs. TRPV1cre-GOF i.l.; G: *P < 0.05, **P < 0.01, ***P < 0.001, ****P < 0.0001 vs. TRPV1cre-GOF+IgG i.l.; J and L: *P < 0.05, **P < 0.01, ***P < 0.001, ****P < 0.0001 vs. IFNAR1-Scr i.l.; $P < 0.05, $$P < 0.01, $$$P < 0.001, $$$$P < 0.0001 vs. IFNAR1-Scr c.l.).
Figure 4
Figure 4. Nociceptor-specific STING-N154S gain of function induces IFN-I production and expression of IFN-stimulated genes in DRGs.
(A) Volcano plot representation of genes regulated in naive TRPV1cre-GOF cKI mice. Genes that pass a threshold of log1.5 fold change in differential expression analysis are colored green when they are downregulated and red when they are upregulated. (B) Oasl2 expression in lumbar DRG neurons of naive GOF (n = 6) and TRPV1cre-GOF (n = 9) mice. (C) Isg15 expression in lumbar DRG neurons of naive GOF (n = 6) and TRPV1cre-GOF (n = 9) mice. (D) Kchip1 expression in lumbar DRG neurons of naive GOF (n = 7) and TRPV1cre-GOF (n = 13) mice. (E) Trpv1 expression in lumbar DRG neurons of naive GOF (n = 6) and TRPV1cre-GOF (n = 8) mice. Statistical analysis was performed using t test (B, D, and E; *P < 0.05, ****P < 0.0001) or Mann-Whitney (C; ***P < 0.001).
Figure 5
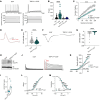
Figure 5. ISGs alter nociceptor properties through TRPV1 downregulation and KChIP1 expression.
(A) Representative current clamp recording of evoked action potentials (APs) recorded in TRPV1 neurons (top). Cells were injected with a 500-millisecond current pulse with an increment of 10 pA and an interval of 5 seconds (protocol, bottom). The highlighted black line indicates the current amplitude that induces the first AP. Scale bars: 20 mV/50 ms. (B) Rheobase data recorded in TRPV1 and non-peptidergic (IB4+) neurons from GOF (n = 61 and n = 16, respectively) and TRPV1cre-GOF mice (n = 101 and n = 22, respectively). (C) Number of spikes as a function of injected current in TRPV1 neurons. (D) Representative APs recorded in TRPV1 neurons from GOF (n = 61) and TRPV1cre-GOF (n = 101) mice. Scale bars: 20 mV/50 ms. (E) AP half-width recorded in D. (F) Representative currents induced by capsaicin (100 nM) in TRPV1 neurons. Scale bars: 200 pA/10 s. (G) Current density evoked by capsaicin in TRPV1 neurons from GOF (n = 25) and TRPV1cre-GOF (n = 70) mice. (H) Representative Western blot of KChIP1 protein level. Three independent experiments were performed. (I) Quantification of KChIP1 protein level in lumbar DRG from naive GOF (n = 5) and TRPV1cre-GOF (n = 5) mice. (J) Representative outward potassium currents recorded in response to voltage steps in TRPV1 neurons. Scale bars: 1 nA/100 ms. (K) Average current-voltage relationship from neurons recorded in J (GOF, n = 10; TRPV1cre-GOF, n = 17). (L and M) Steady-state activation (L) and inactivation (M) from neurons recorded in J (activation: GOF, n = 17; TRPV1cre-GOF, n = 17; inactivation: GOF, n = 18; TRPV1cre-GOF, n = 25). All steady-state plots were fitted with Boltzmann functions to derive V½ and k values. Statistical analysis was performed using Kruskal-Wallis followed by Dunn’s post hoc test (B; ****P < 0.0001), 2-way ANOVA followed by Tukey’s post hoc test (C and KM; *P < 0.05, **P < 0.01, ***P < 0.001, ****P < 0.0001), and Mann-Whitney test (E and G) or t test (I; *P < 0.05, ****P < 0.0001).
Figure 6
Figure 6. IFNAR1 depletion in nociceptors restores electrophysiological properties.
(A) Confocal image of TRPV1 neurons from TRPV1Cre-GOF mice injected with DIO-Scr-shRNA (n = 5) or DIO-IFNAR1-shRNA AAVs (n = 5). Images represent DAPI staining, AAV-GFP expression (green), and Kchip1 transcripts (red) by RNAscope. Scale bars: 25 μm, and 10 μm on cropped images. (B) Quantification of Kchip1 density measured by the number of transcripts represented by dots per surface unit in AAV-infected TRPV1 neurons. (C) Representative current clamp recording of TdTomato+/GFP+ TRPV1 neurons from TRPV1Cre-GOF mice infected with DIO-Scr-shRNA or DIO-IFNAR1-shRNA AAVs (top). Cells were injected with 500-millisecond current pulses with an increment of 10 pA and an interval of 5 seconds (protocol, bottom). The highlighted black line indicates the current amplitude that induces the first AP. Scale bars: 20 mV/50 ms. (D) Measurement of rheobase in infected (GFP+) and non-infected (GFP) TRPV1 neurons (TdTomato+) recorded in C. Data are presented as dot plots with mean values (IFNAR1-Scr neurons, n = 89; IFNAR1-shRNA–infected neurons, n = 80; IFNAR1-Scr neurons, n = 18; IFNAR1-shRNA–non-infected neurons, n = 18). (E) Number of spikes evoked by injected current in TRPV1 (TdTomato+) and AAV-infected (GFP+) neurons. (F) Representative capsaicin-evoked current (100 nM) in TdTomato+/GFP+ TRPV1 neurons from TRPV1Cre-GOF mice infected with IFNAR1-Scr and IFNAR1-shRNA AAVs. Scale bars: 200 pA/20 s. (G) Current density evoked by capsaicin in cells represented in F (IFNAR1-Scr neurons, n = 41; IFNAR1-shRNA neurons, n = 28). (H) Representative outward potassium currents recorded in response to voltage steps in TRPV1Cre-GOF neurons infected with IFNAR1-Scr and IFNAR1-shRNA AAVs. Scale bars: 1 nA/100 ms. (I) Average current-voltage relationship in TRPV1 neurons from TRPV1Cre-GOF mice infected with IFNAR1-Scr (n = 31) or IFNAR1-shRNA AAVs (n = 25). Statistical analysis was performed using t test (B) or Mann-Whitney test (D and G; ****P < 0.0001) and 2-way ANOVA with Tukey’s post hoc test (E and I; **P < 0.01, ****P < 0.0001).
Figure 7
Figure 7. KChIP1/Kv4 interaction promotes the anti-nociceptive effect of ISGs.
(A) Representative current clamp recording of TRPV1cre-GOF neurons, in control condition and after AmmTx3 (1 μM) application (top). Cells were injected with 500-millisecond current pulses with an increment of 10 pA and an interval of 5 seconds (protocol, bottom). The highlighted black line indicates the current amplitude that induces the first AP. Scale bars: 20 mV/50 ms. (B and C) Measurement of rheobase (B) and AP half-width (C) induced by AmmTx3 application in TRPV1cre-GOF neurons (n = 29 neurons). (D) Representative outward potassium currents recorded in response to voltage steps in TRPV1cre-GOF, in control condition and after AmmTx3 application. Scale bars: 1 nA/100 ms. (E) Average current-voltage relationship obtained from the cells recorded in D (n = 9). (F) Representative current clamp recording of TRPV1cre-GOF neurons treated with a TAT-conjugated KChIP1 peptide for 40 minutes (top). Cells were injected with 500-millisecond current pulses with an increment of 10 pA and an interval of 5 seconds (protocol, bottom). The highlighted black line indicates the current amplitude that induces the first AP. Scale bars: 20 mV/50 ms. (G) Time-dependent effect of TAT-conjugated KChIP1 versus denatured control peptide on the rheobase of TRPV1Cre-GOF neurons (n = 15 and 17, respectively) and GOF control neurons (n = 10 and 11, respectively). (H) Measurement of rheobase at t = 0 and 45 minutes after KChIP1 exposure or denatured peptide in TRPV1cre-GOF neurons (TAT-Denat, n = 15; TAT-KChIP1, n = 17) or GOF neurons (TAT-Denat, n = 10; TAT-KChIP1, n = 12). (I) Measurement of thermal withdrawal latency in hind paws of both CFA-treated GOF and TRPV1cre-GOF mice treated with 5 μg (n = 7, 7) or 10 μg (n = 6, 7) KChIP1 blocking peptide or its denatured control (n = 6, 7) at day 3 after CFA injection. Statistical analysis was performed using paired t test (B, C, and H) and 2-way ANOVA followed by Tukey’s post hoc test (E and I; *P < 0.05, **P < 0.01, ***P < 0.001, ****P < 0.0001).
Figure 8
Figure 8. Schematic representation of pain-resolving effects of the STING/IFN-I pathway in inflammatory pain models.
Upregulation of nociceptor STING during inflammation stimulates TANK-binding kinase 1 (TBK1). TBK1 phosphorylates IFN regulatory factor 3 (IRF3), which controls the production of type I IFN, including IFN-β. Type I IFNs (IFN-I) bind to IFN-α/β receptor (IFNAR) on TRPV1 nociceptors to initiate the transcriptional regulation of hundreds of IFN-regulated genes (IRGs), which reduces heat hyperalgesia (TRPV1 downregulation) and nociceptor excitability (KChIP1 upregulation), promoting pain resolution.

Comment in

  • STINGing away the pain: the role of interferon-stimulated genes

References

    1. Chapman CR, Vierck CJ. The transition of acute postoperative pain to chronic pain: an integrative overview of research on mechanisms. J Pain. 2017;18(4):359.e1–359.e38. doi: 10.1016/j.jpain.2016.11.004. - DOI - PubMed
    1. Mifflin KA, Kerr BJ. The transition from acute to chronic pain: understanding how different biological systems interact. Can J Anaesth. 2014;61(2):112–122. doi: 10.1007/s12630-013-0087-4. - DOI - PubMed
    1. Parisien M, et al. Acute inflammatory response via neutrophil activation protects against the development of chronic pain. Sci Transl Med. 2022;14(644):eabj9954. doi: 10.1126/scitranslmed.abj9954. - DOI - PMC - PubMed
    1. Ji RR, et al. Pain regulation by non-neuronal cells and inflammation. Science. 2016;354(6312):572–577. doi: 10.1126/science.aaf8924. - DOI - PMC - PubMed
    1. Callaway E. Scientists deliberately gave people COVID — here’s what they learnt. Nature. 2022;602(7896):191–192. doi: 10.1038/d41586-022-00319-9. - DOI - PubMed

Publication types