

Favorable Antiviral Effect of Metformin on SARS-CoV-2 Viral Load in a Randomized, Placebo-Controlled Clinical Trial of COVID-19
- PMID: 38690892
- PMCID: PMC11327787
- DOI: 10.1093/cid/ciae159
Favorable Antiviral Effect of Metformin on SARS-CoV-2 Viral Load in a Randomized, Placebo-Controlled Clinical Trial of COVID-19
Abstract
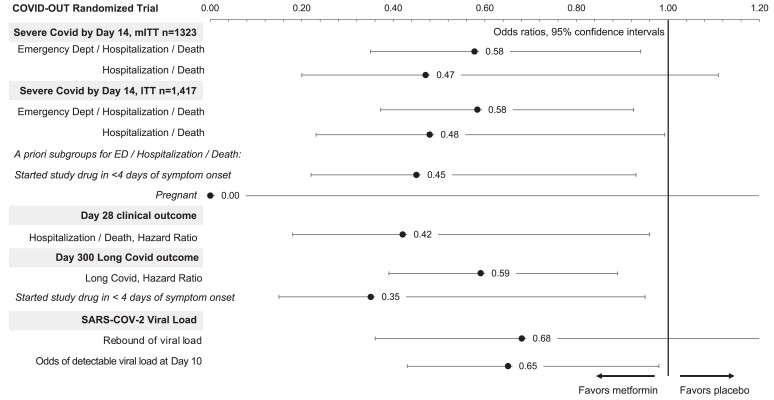
Background: Metformin has antiviral activity against RNA viruses including severe acute respiratory syndrome coronavirus 2 (SARS-CoV-2). The mechanism appears to be suppression of protein translation via targeting the host mechanistic target of rapamycin pathway. In the COVID-OUT randomized trial for outpatient coronavirus disease 2019 (COVID-19), metformin reduced the odds of hospitalizations/death through 28 days by 58%, of emergency department visits/hospitalizations/death through 14 days by 42%, and of long COVID through 10 months by 42%.
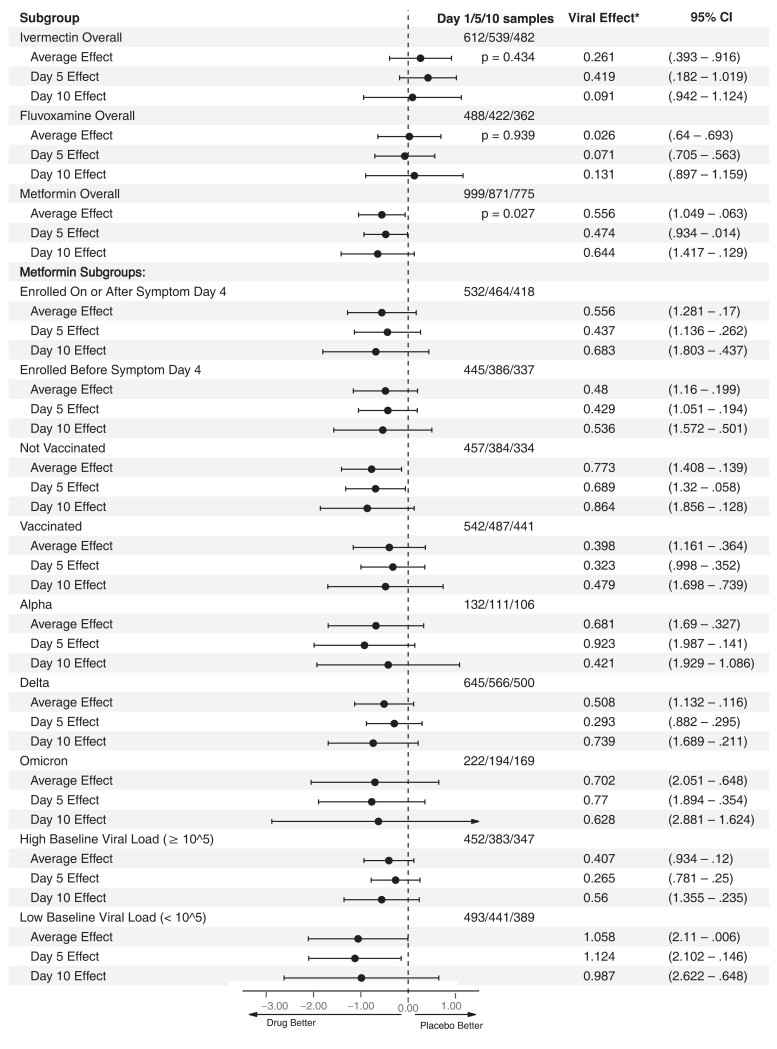
Methods: COVID-OUT was a 2 × 3 randomized, placebo-controlled, double-blind trial that assessed metformin, fluvoxamine, and ivermectin; 999 participants self-collected anterior nasal swabs on day 1 (n = 945), day 5 (n = 871), and day 10 (n = 775). Viral load was quantified using reverse-transcription quantitative polymerase chain reaction.
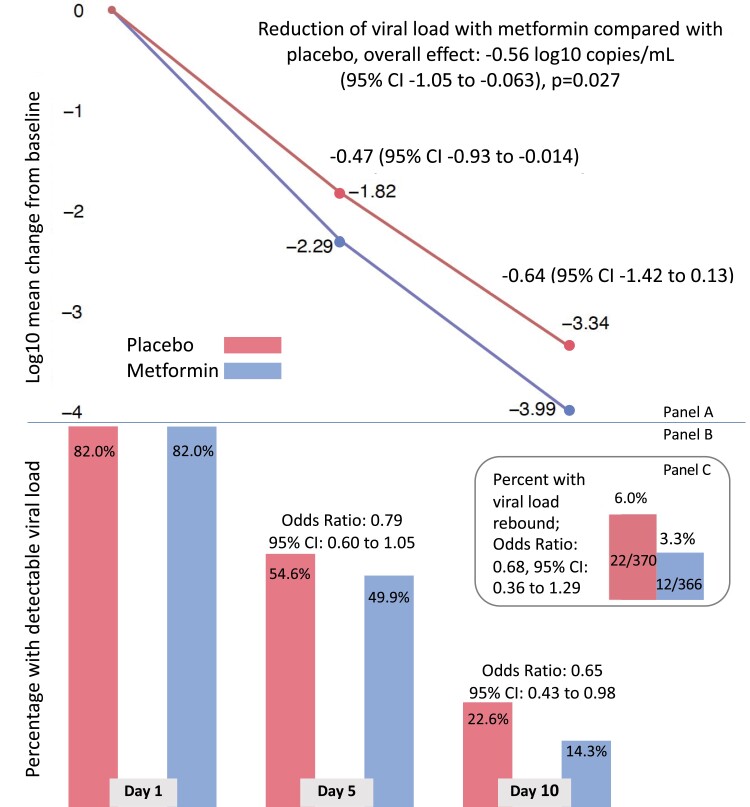
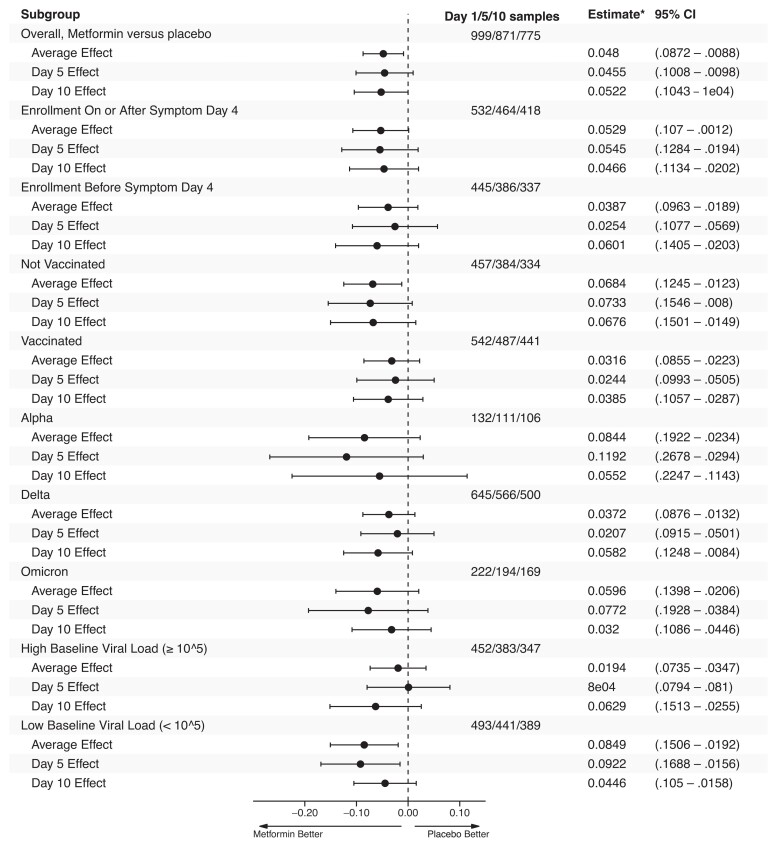
Results: The mean SARS-CoV-2 viral load was reduced 3.6-fold with metformin relative to placebo (-0.56 log10 copies/mL; 95% confidence interval [CI], -1.05 to -.06; P = .027). Those who received metformin were less likely to have a detectable viral load than placebo at day 5 or day 10 (odds ratio [OR], 0.72; 95% CI, .55 to .94). Viral rebound, defined as a higher viral load at day 10 than day 5, was less frequent with metformin (3.28%) than placebo (5.95%; OR, 0.68; 95% CI, .36 to 1.29). The metformin effect was consistent across subgroups and increased over time. Neither ivermectin nor fluvoxamine showed effect over placebo.
Conclusions: In this randomized, placebo-controlled trial of outpatient treatment of SARS-CoV-2, metformin significantly reduced SARS-CoV-2 viral load, which may explain the clinical benefits in this trial. Metformin is pleiotropic with other actions that are relevant to COVID-19 pathophysiology.
Clinical trials registration: NCT04510194.
Keywords: long COVID; mTOR; metformin; outpatient COVID-19 treatment; viral load.
© The Author(s) 2024. Published by Oxford University Press on behalf of Infectious Diseases Society of America. All rights reserved. For commercial re-use, please contact reprints@oup.com for reprints and translation rights for reprints. All other permissions can be obtained through our RightsLink service via the Permissions link on the article page on our site—for further information please contact journals.permissions@oup.com.
Conflict of interest statement
Potential conflicts of interest. J. B. B. reports contracted fees and travel support for contracted activities for consulting work paid to the University of North Carolina by Novo Nordisk; grant support by NIH, PCORI, Bayer, Boehringer-Ingelheim, Carmot, Corcept, Dexcom, Eli Lilly, Insulet, MannKind, Novo Nordisk, and vTv Therapeutics; personal compensation for consultation from Alkahest, Altimmune, Anji, Aqua Medical Inc, AstraZeneca, Boehringer-Ingelheim, CeQur, Corcept Therapeutics, Eli Lilly, embecta, GentiBio, Glyscend, Insulet, Mellitus Health, Metsera, Moderna, Novo Nordisk, Pendulum Therapeutics, Praetego, Stability Health, Tandem, Terns Inc, and Vertex.; personal compensation for expert testimony from Medtronic MiniMed; participation on advisory boards for Altimmune, AstraZeneca, and Insulet; a leadership role for the Association of Clinical and Translational Science; and stock/options in Glyscend, Mellitus Health, Pendulum Therapeutics, Praetego, and Stability Health. M. A. P. receives consulting fees from Opticyte and Cytovale. A. B. K. has served as an external consultant for Roche Diagnostics; received speaker honoraria from Siemens Healthcare Diagnostics, the American Kidney Fund, the National Kidney Foundation, the American Society of Nephrology, and Yale University Department of Laboratory Medicine; research support unrelated to this work from Siemens Healthcare Diagnostics, Kyowa Kirin Pharmaceutical Development, the Juvenile Diabetes Research Foundation, and the NIH; support for travel from College of American Pathologists Point-Of-Care Testing Committee; participation on an advisory board for the Minnesota Newborn Screening Advisory Committee; grants from NIH and JDRF for multiple unrelated clinical research projects and Kyowa Kirin Pharmaceutical Development and Siemens Healthcare Diagnostics for unrelated clinical research studies; and leadership roles for the American Board of Clinical Chemistry, Association for Diagnostics and Laboratory Medicine (ADLM) Evidence-Based Laboratory Medicine Subcommittee, and ADLM Academy Test Utilization Committee. M. R. R. reports consulting fees from 20/20 Gene Systems for coronavirus disease 2019 testing. D. B. R. reports grants from the NIH NCATS ACTIV-6 Steering Committee Chair. K. C. reports stock or stock options for United Health Group. C. T. B. reports consulting fees from NCATS/DCRI and the ACTIV-6 Executive Committee and support for travel from Academic Medical Education. All other authors report no potential conflicts. All authors have submitted the ICMJE Form for Disclosure of Potential Conflicts of Interest. Conflicts that the editors consider relevant to the content of the manuscript have been disclosed.
Figures
Comment in
-
Repurposing Revisited: Exploring the Role of Metformin for Treatment of COVID-19.Clin Infect Dis. 2024 Aug 16;79(2):292-294. doi: 10.1093/cid/ciae154. Clin Infect Dis. 2024. PMID: 38690870 No abstract available.
References
-
- Castle BT, Dock C, Hemmat M, et al. Biophysical modeling of the SARS-CoV-2 viral cycle reveals ideal antiviral targets. bioRxiv 111237 [Preprint]. June 16, 2020. Available from: 10.1101/2020.05.22.111237. - DOI
Publication types
MeSH terms
Substances
Associated data
Grants and funding
- K23 HL166783/HL/NHLBI NIH HHS/United States
- K23 DK124654/DK/NIDDK NIH HHS/United States
- K23 DK124654-01-A1/NH/NIH HHS/United States
- OT2HL156812/National Heart, Lung, and Blood Institute of the NIH
- UL1 TR002494/TR/NCATS NIH HHS/United States
- Institute for Engineering in Medicine
- Minnesota's Rainwater Foundation Grant
- OT2 HL161847/HL/NHLBI NIH HHS/United States
- UL1 TR002489/TR/NCATS NIH HHS/United States
- Fast Grants
- Olive View-
- U54 CA210190/CA/NCI NIH HHS/United States
- Edenbridge Pharmacy
- Education and Research Institute
- OT2 HL156812/HL/NHLBI NIH HHS/United States
- R01 LM012982/LM/NLM NIH HHS/United States
- K23 HL133604/HL/NHLBI NIH HHS/United States
- KL2 TR002492/TR/NCATS NIH HHS/United States
- P01 CA254849/CA/NCI NIH HHS/United States
- OT2HL161847/NIH RECOVER
- National Cancer Institute of the NIH
- Subaward of the University
- Rainwater Charitable Foundation
- T32 HL129956/HL/NHLBI NIH HHS/United States
- T32HL129956/National Heart, Lung, and Blood Institute of the NIH
- Leidos Biomedical
- Apotex Pharmacy
- 00086722/Minnesota Partnership for Biotechnology and Medical Genomics
- KL2TR002492/UnitedHealth Group Foundation
- Parsemus Foundation
- R21 LM012744/LM/NLM NIH HHS/United States
LinkOut - more resources
Full Text Sources
Medical
Miscellaneous
