. 2024 May 1;326(5):C1462-C1481.
doi: 10.1152/ajpcell.00654.2023. Epub 2024 Mar 4.

IGF1 promotes human myotube differentiation toward a mature metabolic and contractile phenotype

Affiliations

IGF1 promotes human myotube differentiation toward a mature metabolic and contractile phenotype

Simon I Dreher et al. Am J Physiol Cell Physiol. .

Abstract

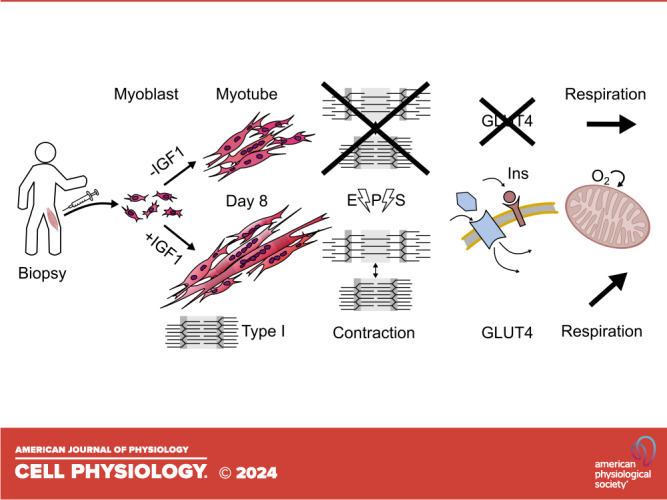
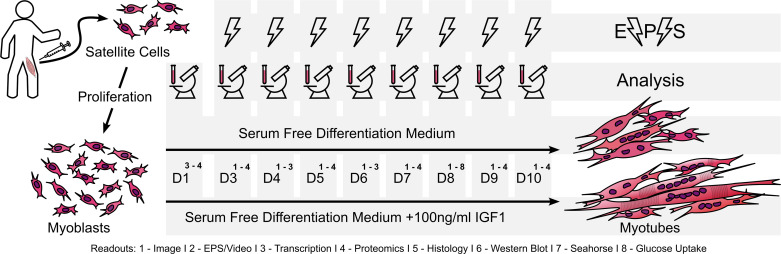
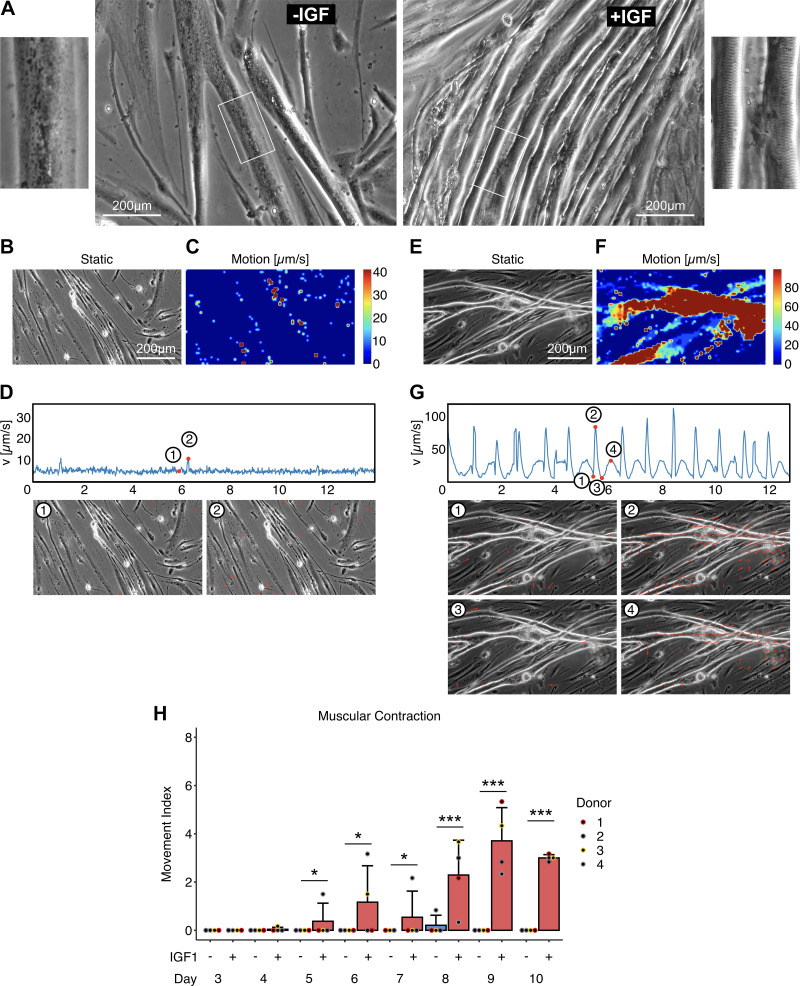
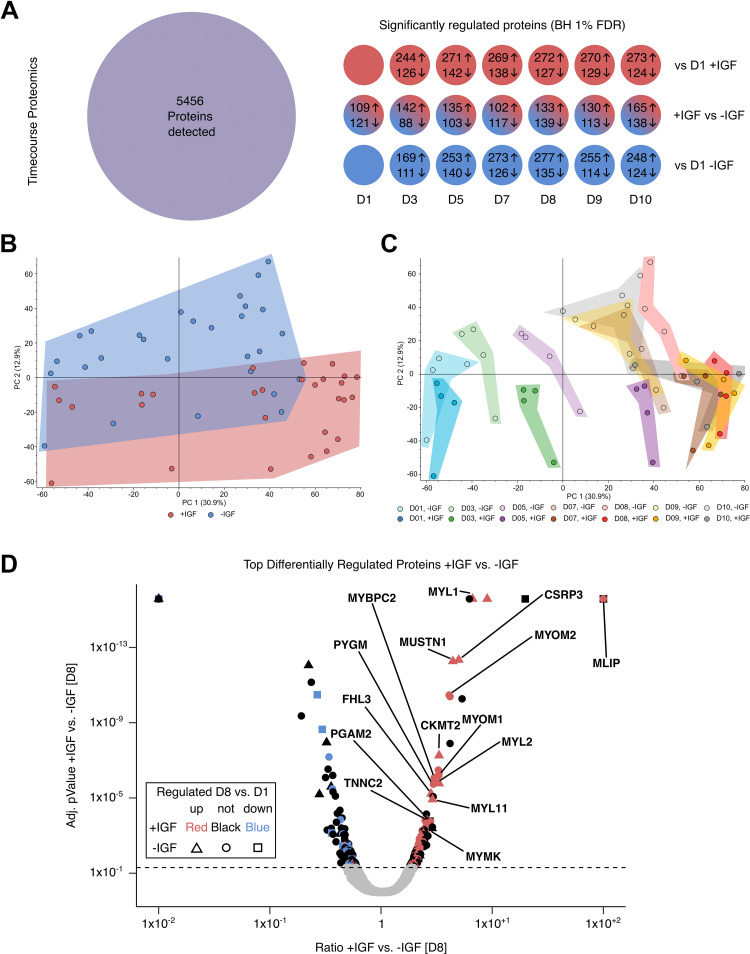
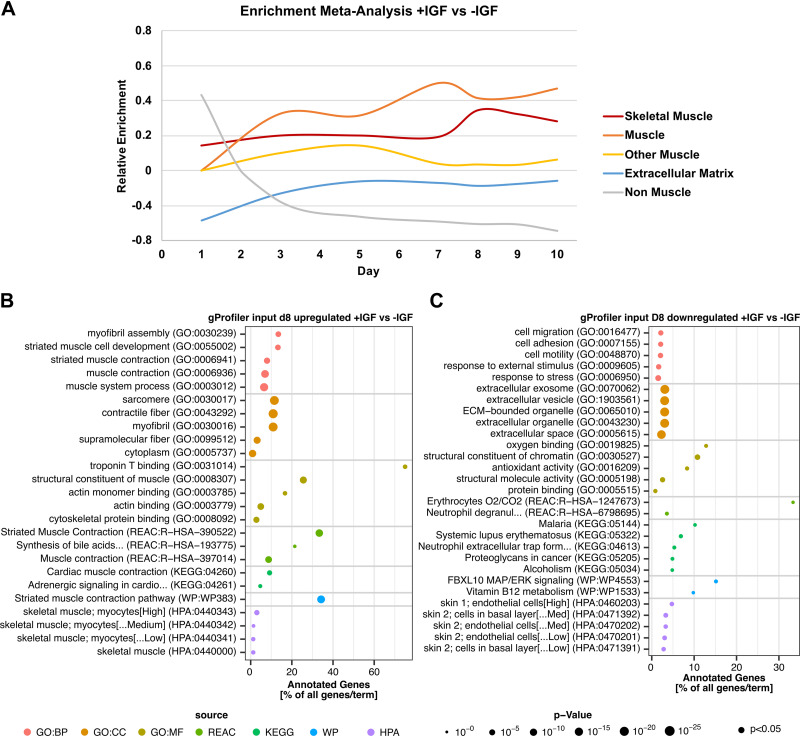
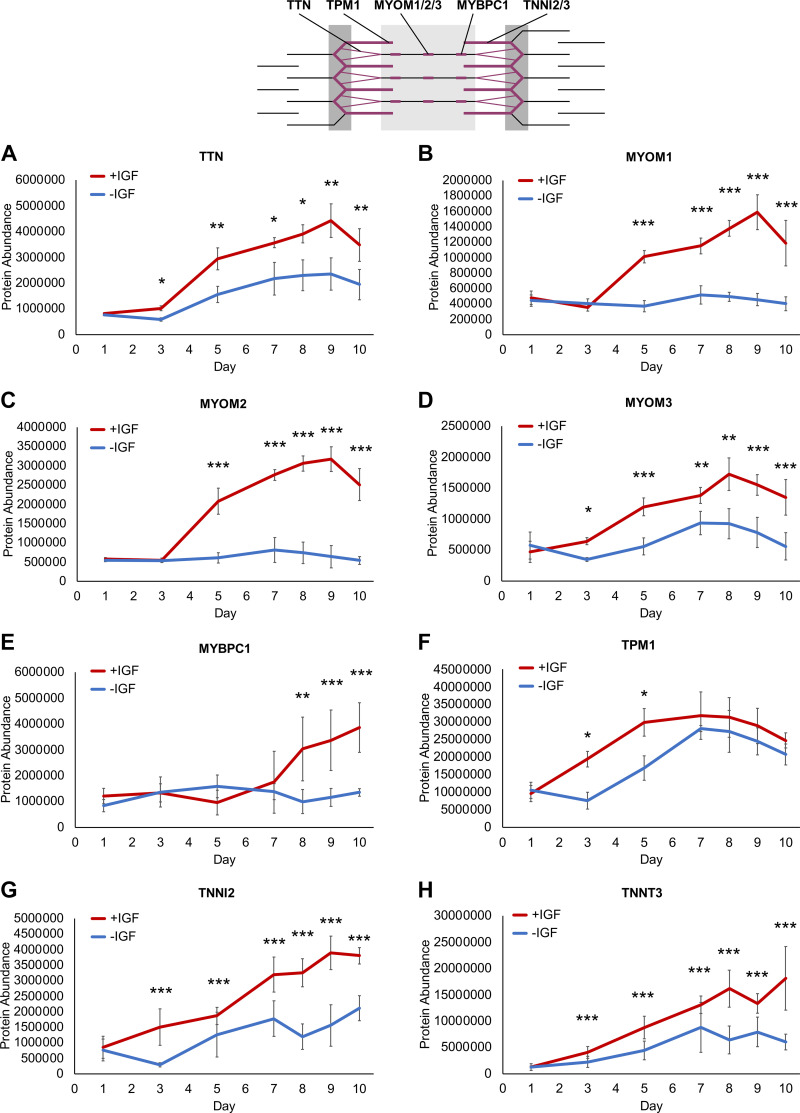
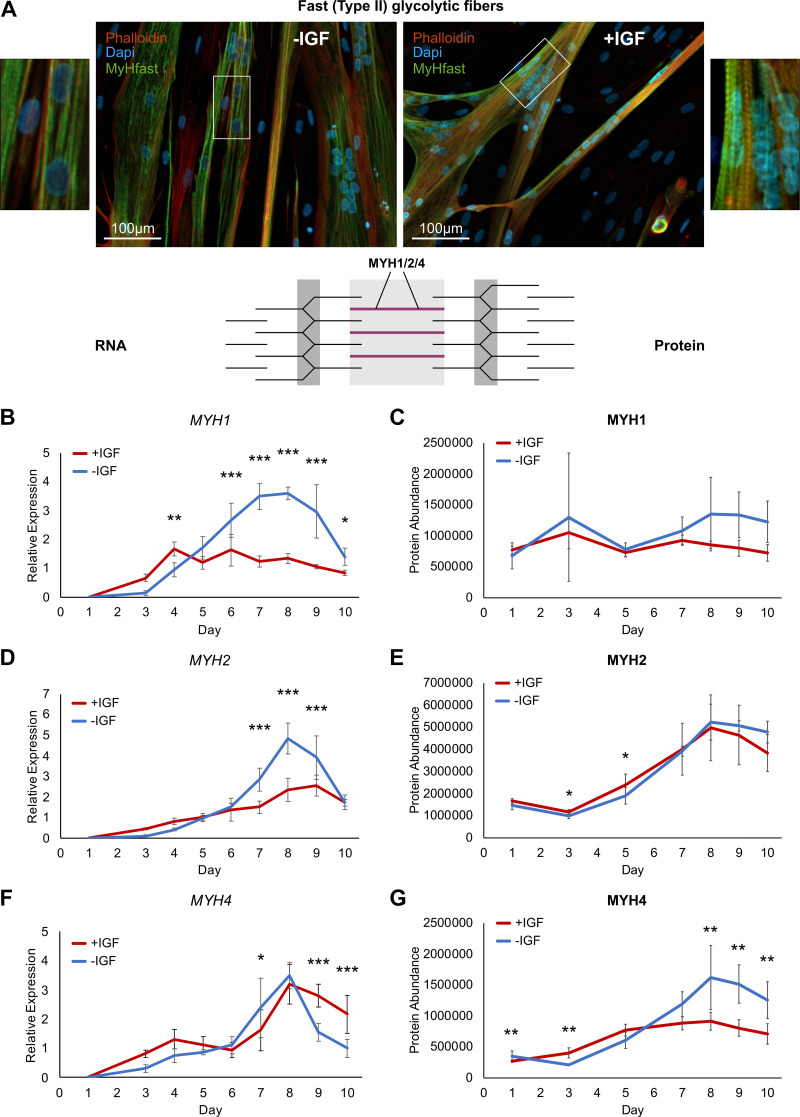
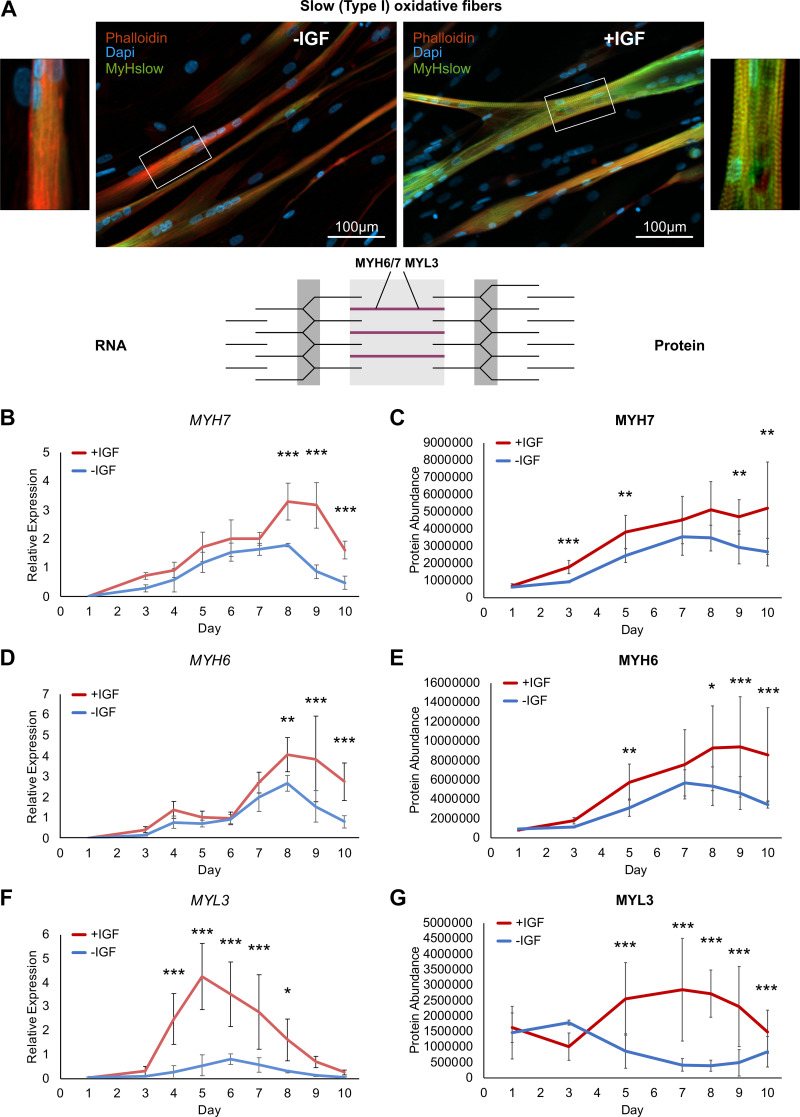
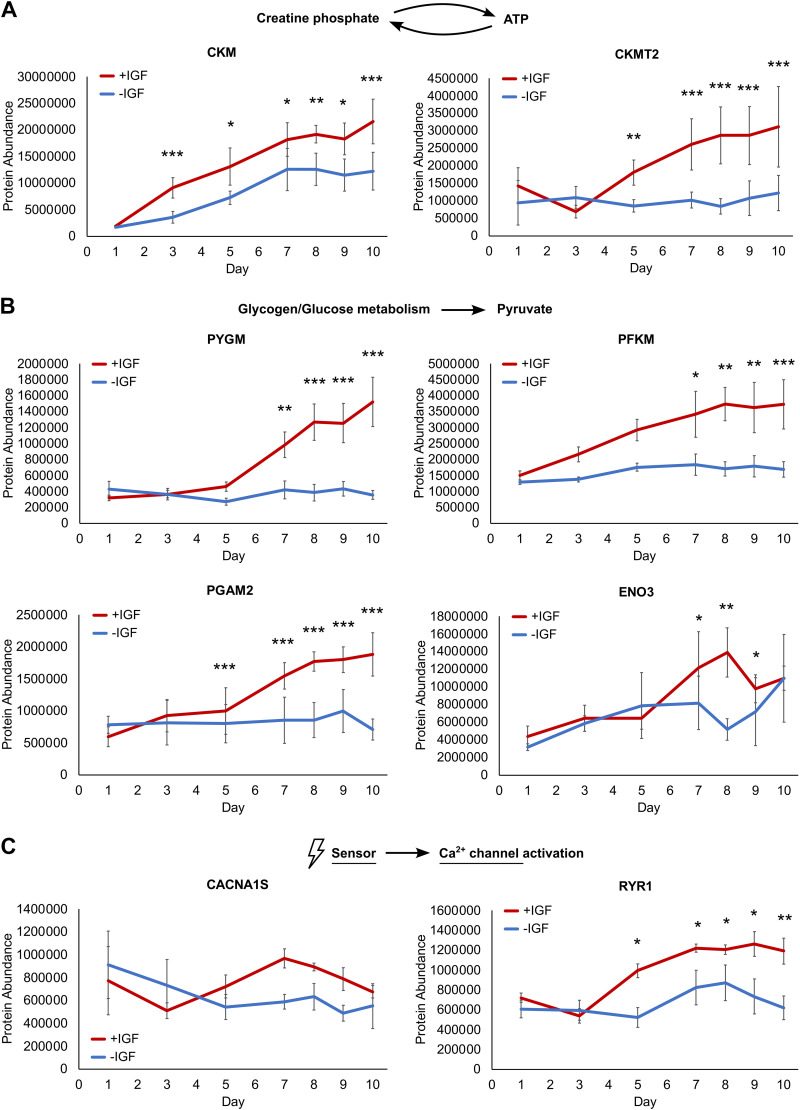
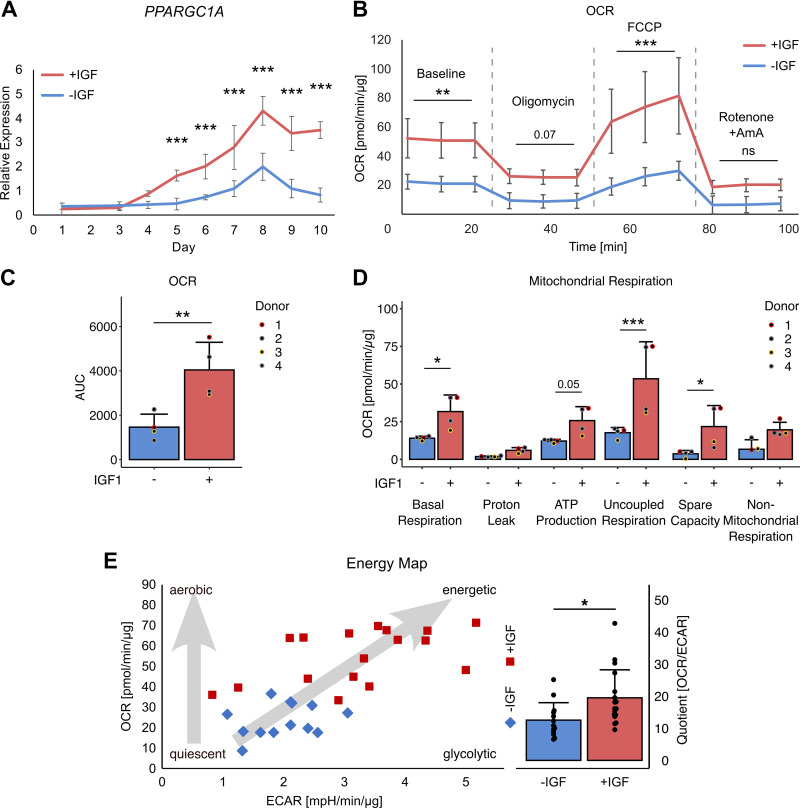
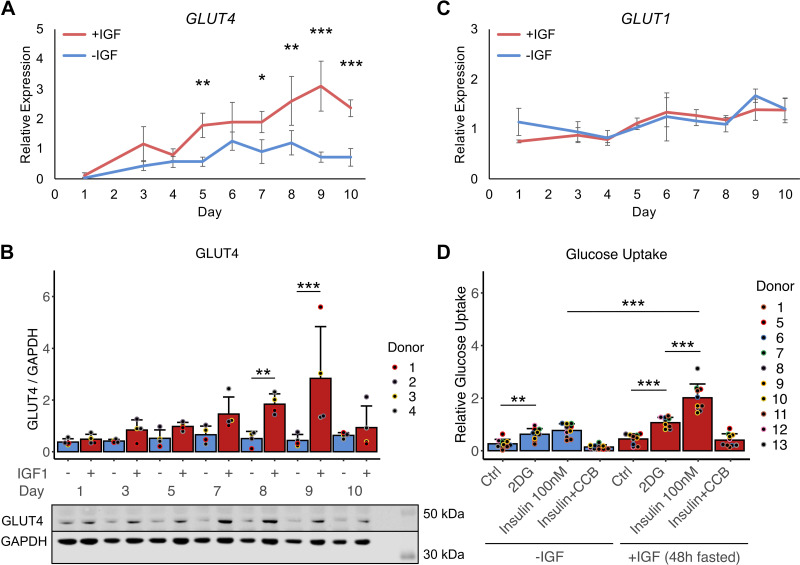
Skeletal muscle mediates the beneficial effects of exercise, thereby improving insulin sensitivity and reducing the risk for type 2 diabetes. Current human skeletal muscle models in vitro are incapable of fully recapitulating its physiological functions especially muscle contractility. By supplementation of insulin-like growth factor 1 (IGF1), a growth factor secreted by myofibers in vivo, we aimed to overcome these limitations. We monitored the differentiation process starting from primary human CD56-positive myoblasts in the presence/absence of IGF1 in serum-free medium in daily collected samples for 10 days. IGF1-supported differentiation formed thicker multinucleated myotubes showing physiological contraction upon electrical pulse stimulation (EPS) following day 6. Myotubes without IGF1 were almost incapable of contraction. IGF1 treatment shifted the proteome toward skeletal muscle-specific proteins that contribute to myofibril and sarcomere assembly, striated muscle contraction, and ATP production. Elevated PPARGC1A, MYH7, and reduced MYH1/2 suggest a more oxidative phenotype further demonstrated by higher abundance of proteins of the respiratory chain and elevated mitochondrial respiration. IGF1-treatment also upregulated glucose transporter (GLUT)4 and increased insulin-dependent glucose uptake compared with myotubes differentiated without IGF1. To conclude, addition of IGF1 to serum-free medium significantly improves the differentiation of human myotubes that showed enhanced myofibril formation, response to electrical pulse stimulation, oxidative respiratory capacity, and glucose metabolism overcoming limitations of previous standards. This novel protocol enables investigation of muscular exercise on a molecular level.NEW & NOTEWORTHY Human skeletal muscle models are highly valuable to study how exercise prevents type 2 diabetes without invasive biopsies. Current models did not fully recapitulate the function of skeletal muscle especially during exercise. By supplementing insulin-like growth factor 1 (IGF1), the authors developed a functional human skeletal muscle model characterized by inducible contractility and increased oxidative and insulin-sensitive metabolism. The novel protocol overcomes the limitations of previous standards and enables investigation of exercise on a molecular level.

Keywords: EPS; GLUT4; contraction; human myotubes; proteomics.


Conflict of interest statement

No conflicts of interest, financial or otherwise, are declared by the authors.

Figures

None
Graphical abstract
Figure 1.
Figure 1.
Experimental design. Primary human satellite cells isolated from vastus lateralis muscle biopsies were proliferated to myoblasts and differentiated into myotubes for 10 days in serum-free differentiation medium in the presence or absence of 100 ng/mL insulin-like growth factor 1 (IGF1). On day 1 and daily from day 3 myotubes were sampled and analyzed. Cells were imaged, electrical-pulse-stimulation (EPS) was performed, and transcription was analyzed daily from day 3 to day 10. From samples obtained on day 1 proteomic analysis were performed and transcription was analyzed. From samples obtained on days 3, 5, and 7–10 proteomic analyses were performed. Functional analysis including immunostaining, phospho-Western-blotting, respiratory measurement by Seahorse and glucose uptake was conducted on day 8.
Figure 2.
Figure 2.
Human myotube morphology and contraction. Primary human myotubes differentiated in the presence or absence of insulin-like growth factor 1 (IGF1) to analyze morphology and capability for contraction in response to electrical-pulse-stimulation (EPS). A: microscopic images of differentiated myotubes from a representative donor on day 8 of differentiation. BG: representative output of the video analysis with the open heart wave (OHW) program for myotubes differentiated without (BD) or with IGF1 (EG). Static frame of the video (B and E); heatmap representing degree and area of movement (C and F); movement over time curve with static frames and arrow plots visualizing contraction in response to EPS at 1 Hz (D and G). H: contractability by EPS was quantified by calculating the movement index (0–9) based on randomly taken videos between day 3 and day 10 in myotubes differentiated without (blue bars) or with IGF1 (red bars). Bars represent means ± SD, individual data points are depicted. Scale bars represent 200 µm. Significant differences were assessed using one-way ANOVA with Fisher’s least-significant differece (LSD) post hoc test, *P < 0.05, ***P < 0.001, n = 4 individual donors.
Figure 3.
Figure 3.
Proteomic analysis of human myotube differentiation. Primary human myotubes differentiated in the presence or absence of insulin-like growth factor 1 (IGF1) were subjected to proteomic analysis on days 1, 3, 5, and 710 of differentiation. A: number of detected and significantly regulated proteins for every timepoint comparing myotubes differentiated with (red) or without (blue) IGF1 at days 110 (+IGF vs. −IGF) or the regulation vs. day 1 in +IGF or −IGF. B: principal component analysis (PCA) for each sample in the proteomic analysis stratified by myotubes differentiated with (red) or without (blue) IGF1. C: PCA stratified by timepoint (colors) and myotubes differentiated without (light dot and color) and with (dark dot and color) IGF1. D: volcano plot depicting significantly different proteins between myotubes differentiated with or without IGF1 on day 8 of differentiation. Colors additionally indicate significant regulation vs. day 1 in +IGF (red = up; blue = down) and shapes indicate significant regulation vs. day 1 in −IGF (triangle = up; square = down). The color black and shape circle indicate no regulation vs. day 1. Significant differences were defined by a Benjamini–Hochberg corrected P value below 0.05, n = 4 individual donors.
Figure 4.
Figure 4.
Pathway analysis during human myotube differentiation. Primary human myotubes differentiated in the presence or absence of insulin-like growth factor 1 (IGF1) were subjected to proteomic analysis over 10 days of differentiation. Pathway enrichment analysis was performed comparing myotubes +IGF vs. −IGF (n = 4 individual donors). A: enrichment meta-analysis, each top five enriched terms based on the up- or downregulated proteins comparing +IGF vs −IGF on each day was assigned to one of the preambles “Skeletal Muscle,” “Muscle,” “Other Muscle,” “Extracellular Matrix,” or “Non-Muscle” showing the quotient over the time of differentiation. B: gProfiler analysis based on significantly upregulated proteins on day 8 +IGF vs −IGF. C: gProfiler analysis based on significantly downregulated proteins on day 8 +IGF vs −IGF. Significant differences were defined by a Benjamini–Hochberg corrected P value below 0.05 and detection. GO:BP, gene ontology biological process; GO:CC, gene ontology cellular components; GO:MF, gene ontology molecular functions; HPA, human protein atlas; REAC, reactome; KEGG, Kyoto Encyclopedia of Genes and Genomes; WP, Wikipathways.
Figure 5.
Figure 5.
Contractile apparatus proteins during human myotube differentiation. Primary human myotubes differentiated in the presence or absence of insulin-like growth factor 1 (IGF1) were subjected to proteomic analysis over 10 days of differentiation. Schematic representation of the contractile apparatus generated with InkScape (v.1.0) highlights the location of analyzed proteins in purple. Regulation of contractile apparatus proteins titin (TTN; A), myomesin 1 (MYOM1; B), MYOM2 (C), MYOM3 (D), myosin binding protein C (MYBPC1; E), tropomyosin (TPM1; F), skeletal muscle troponin 2 (TNNI2; G), TNNT3 (H) was analyzed on days 1, 3, 5, 710 comparing protein levels between myotubes differentiated with or without IGF1. Curves represent means ± SD, based on median values over all detected peptides. Significant differences were defined by a Benjamini–Hochberg corrected P value below 0.05, *P < 0.05, **P < 0.01, ***P < 0.001, n = 4 individual donors.
Figure 6.
Figure 6.
Fast (type II) glycolytic fiber markers during human myotube differentiation. Primary human myotubes differentiated in the presence or absence of insulin-like growth factor 1 (IGF1) were subjected to transcriptional and proteomic analysis over 10 days of differentiation. Schematic representation of the contractile apparatus generated with InkScape (v.1.0) highlights the location of analyzed proteins in purple. A: fixed slides of myotubes from a representative donor, differentiated with or without IGF1 on day 8 of differentiation were stained against a myosin heavy chain fast (MyHfast, directed against MYH1 and MYH2) antibody (green), phalloidin (red) and DAPI (blue). Scale bars represent 100 µm. Regulation of fast (type II) glycolytic fiber markers MYH1 (B), MYH2 (D), MYH4 (F) RNA expression was analyzed on days 110 comparing expression between myotubes differentiated with or without IGF1. Curves represent means ± SD. Significant differences were assessed using one-way ANOVA with Fisher’s LSD post hoc test, *P < 0.05, **P < 0.01, ***P < 0.001, n = 4 individual donors. Regulation of fast (type II) glycolytic fiber marker proteins MYH1 (C), MYH2 (E), MYH4 (G) was analyzed on days 1, 3, 5, 710 comparing protein levels between myotubes differentiated with or without IGF1. Curves represent means ± SD, based on median values over all detected peptides. Significant differences were defined by a Benjamini–Hochberg corrected P value below 0.05, *P < 0.05, **P < 0.01, ***P < 0.001, n = 4 individual donors.
Figure 7.
Figure 7.
Slow (type I) oxidative fiber markers during human myotube differentiation. Primary human myotubes differentiated in the presence or absence of insulin-like growth factor 1 (IGF1) were subjected to transcriptional and proteomic analysis over 10 days of differentiation. Schematic representation of the contractile apparatus generated with InkScape (v.1.0) highlights the location of analyzed proteins in purple. A: fixed slides of myotubes from a representative donor, differentiated with or without IGF1 on day 8 of differentiation were stained against a myosin heavy chain slow (MyHslow, directed against MYH7) antibody (green), phalloidin (red), and DAPI (blue). Scale bars represent 100 µm. Regulation of slow (type I) oxidative fiber markers MYH7 (B), MYH6 (D), MYL3 (F) RNA expression was analyzed on days 110 comparing expression between myotubes differentiated with or without IGF1. Curves represent means ± SD. Significant differences were assessed using one-way ANOVA with Fisher’s LSD post hoc test, *P < 0.05, **P < 0.01, ***P < 0.001, n = 4 individual donors. Regulation of slow (type I) oxidative fiber marker proteins MYH7 (C), MYH6 (E), MYL3 (G) was analyzed on days 1, 3, 5, 710 comparing protein levels between myotubes differentiated with or without IGF1. Curves represent means ± SD, based on median values over all detected peptides. Significant differences were defined by a Benjamini–Hochberg corrected P value below 0.05, *P < 0.05, **P < 0.01, ***P < 0.001, n = 4 individual donors.
Figure 8.
Figure 8.
Energy metabolism and sarcoplasmic Ca2+ release proteins during human myotube differentiation. Primary human myotubes differentiated in the presence or absence of insulin-like growth factor 1 (IGF1) were subjected to proteomic analysis over 10 days of differentiation. Regulation of proteins relevant for ATP supply (CKM, CKMT2) (A), glycogenolysis and glycolysis (PYGM, PFKM, PGAM2, ENO3) (B), and voltage dependent Ca2+ release (CACNA1S, RYR1) (C) was analyzed on days 1, 3, 5, 710 comparing protein levels between myotubes differentiated with or without IGF1. Curves represent means ± SD, based on median values over all detected peptides. Significant differences were defined by a Benjamini–Hochberg corrected P value below 0.05, *P < 0.05, **P < 0.01, ***P < 0.001, n = 4 individual donors.
Figure 9.
Figure 9.
Mitochondrial respiration of human myotubes. Primary human myotubes were differentiated in the presence or absence of insulin-like growth factor 1 (IGF1) over 10 days. A: RNA expression of PPARGC1A was analyzed on days 110 comparing expression between myotubes differentiated with or without IGF1. Curves represent means ± SD. B: respiration was measured in myotubes differentiated with and without IGF1 on day 8 of differentiation in response to indicated substrates using seahorse analysis. Lines represent means ± SD of all analysis, labels describe oxygen consumption rate (OCR) measurements after single injections indicated by the dashed lines. For statistical analysis all measurements between injections were compared. Area under the curve was calculated for the complete measurements (C) and individual parameters of mitochondrial respiration calculated (D). E: using baseline measurement at the third timepoint, the energy map was drawn relating OCR and extracellular acidification rate (ECAR). The quotient was calculated and compared +IGF vs. −IGF. Significant differences were assessed using one-way ANOVA with Fisher’s LSD post hoc test, *P < 0.05, **P < 0.01, ***P < 0.001, n = 4 individual donors.
Figure 10.
Figure 10.
Glucose uptake of human myotubes. Primary human myotubes were differentiated in the presence or absence of insulin-like growth factor 1 (IGF1) over 10 days. RNA expression of GLUT4 (A) and GLUT4 protein levels (B) by Western blotting were analyzed on days 110 comparing myotubes differentiated with or without IGF1. C: GLUT1 RNA expression was analyzed +IGF vs. −IGF over 10 days. Curves and bars represent means ± SD, n = 4 individual donors. D: glucose uptake, utilizing 2-deoxyglucose, was measured at baseline and in response to insulin stimulation in myotubes differentiated in the presence or absence of IGF1 on day 8. Bars represent means ± SD, individual data points are depicted, n = 10 individual donors. Significant differences were assessed using one-way ANOVA with Fisher’s LSD post hoc test, *P < 0.05, **P < 0.01, ***P < 0.001.

Similar articles

Cited by

References

    1. Hawley JA, Lessard SJ. Exercise training-induced improvements in insulin action. Acta Physiol (Oxf) 192: 127–135, 2008. doi:10.1111/j.1748-1716.2007.01783.x. - DOI - PubMed
    1. Praet SF, van Loon LJ. Exercise: the brittle cornerstone of type 2 diabetes treatment. Diabetologia 51: 398–401, 2008. doi:10.1007/s00125-007-0910-y. - DOI - PMC - PubMed
    1. Boulé NG, Weisnagel SJ, Lakka TA, Tremblay A, Bergman RN, Rankinen T, Leon AS, Skinner JS, Wilmore JH, Rao DC, Bouchard C; HERITAGE Family Study. Effects of exercise training on glucose homeostasis: the HERITAGE Family Study. Diabetes Care 28: 108–114, 2005. doi:10.2337/diacare.28.1.108. - DOI - PubMed
    1. Egan B, Zierath JR. Exercise metabolism and the molecular regulation of skeletal muscle adaptation. Cell Metab 17: 162–184, 2013. doi:10.1016/j.cmet.2012.12.012. - DOI - PubMed
    1. Richter EA, Hargreaves M. Exercise, GLUT4, and skeletal muscle glucose uptake. Physiol Rev 93: 993–1017, 2013. doi:10.1152/physrev.00038.2012. - DOI - PubMed

Publication types

MeSH terms