. 2024 May 28;43(5):114176.
doi: 10.1016/j.celrep.2024.114176. Epub 2024 Apr 30.

PRMT1 promotes epigenetic reprogramming associated with acquired chemoresistance in pancreatic cancer

Affiliations

PRMT1 promotes epigenetic reprogramming associated with acquired chemoresistance in pancreatic cancer

Chan D K Nguyen et al. Cell Rep. .

Abstract

Pancreatic ductal adenocarcinoma (PDAC) carries a dismal prognosis due to therapeutic resistance. We show that PDAC cells undergo global epigenetic reprogramming to acquire chemoresistance, a process that is driven at least in part by protein arginine methyltransferase 1 (PRMT1). Genetic or pharmacological PRMT1 inhibition impairs adaptive epigenetic reprogramming and delays acquired resistance to gemcitabine and other common chemo drugs. Mechanistically, gemcitabine treatment induces translocation of PRMT1 into the nucleus, where its enzymatic activity limits the assembly of chromatin-bound MAFF/BACH1 transcriptional complexes. Cut&Tag chromatin profiling of H3K27Ac, MAFF, and BACH1 suggests a pivotal role for MAFF/BACH1 in global epigenetic response to gemcitabine, which is confirmed by genetically silencing MAFF. PRMT1 and MAFF/BACH1 signature genes identified by Cut&Tag analysis distinguish gemcitabine-resistant from gemcitabine-sensitive patient-derived xenografts of PDAC, supporting the PRMT1-MAFF/BACH1 epigenetic regulatory axis as a potential therapeutic avenue for improving the efficacy and durability of chemotherapies in patients of PDAC.

Keywords: BACH1; CP: Cancer; MAFF; PRMT1; chemoresistance; epigenetic reprogramming; pancreatic cancer.


Conflict of interest statement

Declaration of interests The authors declare no competing interests.

Figures

Figure 1.
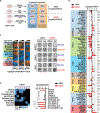
Figure 1.. Gemcitabine treatment induces progressive epigenetic reprogramming in PDAC cells
(A) Cell proliferation assay of mT4 PDAC cells in the presence of vehicle control (+Veh, black) or gemcitabine (+GEM, green) over 10 days. Data are presented as mean values ± standard error (SE) of three independent experiments. (B) Multidimensional-scaling (MDS) plot showing progressive changes in the overall H3K27Ac profiles in mT4 cells after indicated days of GEM treatment. Dissimilarity matrix is calculated using differential H3K27Ac peak signals between all time points (D0–D10) as determined by Cut&Tag (N = 14,029) and plotted using R limma package. (C) Pie graph summarizing the overlap frequencies of differential H3K27Ac peaks among all time points (D0–D10) with the indicated genomic features. TSS, transcription start site; UTR, untranslated region; TTS, transcription termination site. (D) Fuzzy c-mean clustering (top left), corresponding heatmaps (top right), and representative genomic tracks (bottom) of differential H3K27Ac peaks between all time points (D0–D10). Differential peaks are segregated into three distinct profiles (C1–3) based on the relative signal changes from D0 to D10. Heatmaps depict H3K27Ac signals within ±3 kb of peak centers from all three clusters (top). (E) Heatmaps showing −log10 adjusted p values (Padj) of significantly upregulated (top) or downregulated (bottom) gene sets in at least one GEM-treated time point (D2–D10) relative to baseline (D0) from gene set enrichment analysis (GSEA) of gene promoters with differential H3K27Ac signals (FC ≥ 2; adjusted p ≤0.05).
Figure 2.
Figure 2.. Epigenetic inhibitor screen identified PRMT1 as a potential driver of acquired gemcitabine resistance in PDAC cells
(A) Design of the epigenetic inhibitor (Epi) screen. mT4 PDAC cells were treated with DMSO control or sub-lethal doses of Epi in the presence (+GEM) or absence (−GEM) of GEM, then stained with crystal violet when DMSO controls reached ~70% confluence. Effects of Epi on cell growth were normalized to their respective DMSO controls in −GEM or +GEM conditions. (B) Log2FC in cell densities of mT4 cells treated with indicated Epi compared to DMSO in the presence (+GEM, red bars) or absence (−GEM, black bars) of GEM as determined by crystal violet assays. Data presented are mean values ±SE of three independent experiments. *p < 0.05, **p < 0.005, ***p < 0.0005. (C) Heatmaps showing log2 relative cell densities (left) and representative images (right) from crystal violet assays of AsPC1, Panc1, and MiaPaCa2 human PDAC cell lines treated with increasing concentrations of indicated Epi compared to DMSO in the presence of GEM (N = 3). (D) Heatmap (left) showing reported half maximal inhibitory concentration (IC50) values for inhibitors of PRMT class I (PRMT1, 3, 4, 6, 8, highlighted in purple), class II (PRMT5), and class III (PRMT7), and bar graph (right) showing log2FC in cell densities of mT4 cells treated with indicated Epi or combinations in the presence (+GEM, red bars) or absence (−GEM, black bars) of GEM as determined by crystal violet assays. Data presented are mean values ±SE of three independent experiments. *p < 0.05, **p < 0.005, ***p < 0.0005.
Figure 3.
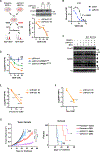
Figure 3.. PRMT1 promotes the development of gemcitabine resistance in PDAC both in vitro and in vivo
(A) Experimental schematic (left), western blot (WB) confirmation (top right), and flow cytometry (FC) analysis of the log2 ratios (bottom right) of RFP-labeled (RFP+) mT4 cells expressing two different doxycycline (Dox)-inducible Prmt1 shRNAs (shPrmt1 #1 and #2) and unlabeled (RFP−) parental mT4 cells after co-culturing in the presence of indicated GEM concentrations. Vinc was used as loading control in WB. Blots shown in WB are representatives of at least three independent experiments; FC data presented are mean values ±SE of three independent experiments. ***p < 0.0005. (B) Normalized optical density (OD) of mT4 cells expressing shCtrl (black) and shPrmt1 (red) treated with increasing GEM concentrations as indicated. Fitted lines and statistical significance were determined by two-way ANOVA analysis (mixed model). Data shown are mean values ±SE of three independent experiments. (C and D) WB analysis with indicated antibodies of total cell lysates (C) and FC analysis of the log2 ratios (D) of RFP-labeled (RFP+) mT4 cells expressing a Dox-inducible Prmt1 shRNA with or without reconstitution with wild-type (WT) or enzymatically dead mutant (E171Q) human PRMT1 relative to unlabeled (RFP−) parental mT4 cells. Histone 3 (H3) was used as loading control in (B). Arrows indicate ADMA-modified proteins downregulated by Prmt1 knockdown. Blots shown in WB are representatives of at least three independent experiments; FC data presented are mean values ±SE of three independent experiments. ***p < 0.0005. NS, not significant. (E and F) FC analysis of the ratios of RFP-labeled (RFP+) mT4 cells expressing Dox-inducible shPrmt1 (#1 or #2) and unlabeled (RFP−) parental mT4 cells after co-culturing in the presence of indicated concentrations of irinotecan (E) or Taxol (F). Data presented are mean values ±SE of three replicates. (G) Tumor growth rates (left) and Kaplan-Meier survival curve (right) of C57BL/6 mice subcutaneously injected with parental or shPrmt1-expressing mT4 cells after indicated days of treatment with saline control or GEM. Tumor volume was measured every 2 days and a mouse was randomly assigned to GEM or saline treatment once tumor volume reached 100 mm3. Parental + saline (black line, N = 5), parental + GEM (red line, N = 4), shPrmt1 + saline (blue line, N = 5), and shPrmt1 + GEM (purple line, N = 5). Two-way ANOVA comparison for repeated measures was performed between each arm and log rank (Mantel-Cox) test was used to determine significant difference in survival relative to baseline control (parental + saline). *p < 0.05; **p < 0.01; ***p < 0.001; ***p < 0.0001; NS, not significant. Error bars indicate SE.
Figure 4.
Figure 4.. PRMT1 modulates gemcitabine-induced epigenetic reprogramming and dynamic changes in TF chromatin binding in PDAC cells
(A) Hue-saturation-value (HSV) transformation plot depicting differential H3K27Ac Cut&Tag peaks across untreated parental (P), GEM-treated parental (P + GEM), and GEM-treated shP1-expressing (shP1 + GEM) mT4 cells. Each data point represents a genomic region with significantly changed H3K27Ac signals and is colored and positioned based on the change pattern it displays from comparing the normalized Z scores across P → P + GEM → shP1 + GEM. The distance of each point from the center of the circle represents maximum absolute log2FC among the three conditions, and the color transparency represents the relative number of reads for that position. Outer histograms represent the densities of differential H3K27Ac peaks overlapping TSS or core-regulatory enhancer (CRE) across all angular positions. (B) Principal-component analysis (PCA) based on RNA-seq analysis by Yang et al. of GEM-resistant (pink; N = 13) and GEM-sensitive (cyan; N = 12) human PDAC patient-derived xenografts (PDXs) stratified by fold change in mRNA expression prior to (pre) and after 3 weeks (post) of GEM treatment of genes whose TSS overlap with Prmt1-regulated, differential H3K27Ac peaks as determined by Cut&Tag. (C) Schematic illustrating distance-signal (DS) score calculation for each transcription factor (TF) family: the sum of log10 transformed signals (S) of differential H3K27Ac CRE peaks that overlap the canonical motif of the TF family in question divided by their distances, D, to adjacent differential H3K27Ac TSS peaks as shown in (A). Sj represents the signal of a given differential H3K27Ac CRE peak overlapping a given motif j (red bar); Di,j represents the distance between a given differential H3K27Ac CRE peak overlapping the motif j and a given adjacent differential H3K27Ac TSS peak i. (D) Heatmap showing cumulative DS scores of TFs with most differential cumulative DS scores in GEM-treated relative to untreated parental mT4 cells (P + GEM versus P) and between GEM-treated parental mT4 cells relative to GEM-treated mT4 cells expressing shPrmt1 (shP1 + GEM versus P + GEM). (E) WB analysis with indicated antibodies of chromatin-enriched fractions from parental and shPrmt1-expressing mT4 cells following GEM treatment for indicated number of days (d). H3 was used as loading control. Blots shown are representatives of at least three independent experiments.
Figure 5.
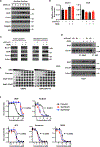
Figure 5.. PRMT1 promotes acquired GEM resistance in part by inhibiting the nuclear accumulation of small MAF proteins and the assembly of MAF/BACH1 transcriptional complexes
(A) WB analysis with indicated antibodies of nuclear enriched fractions from mT4 cells subjected to indicated durations of GEM treatment. Hdac1 was used as overall loading control. Gapdh and H3 were used as markers for the cytoplasmic and chromatin fractions, respectively. Blots shown are representatives of at least three independent experiments. (B) Real-time quantitative reverse transcription PCR (qRT-PCR) analysis of relative MafF and Bach1 mRNA levels from parental or shPrmt1-expressing mT4 cells after 6 days of culturing with or without GEM. Data presented are mean values ±SE of three replicates. (C) WB analysis with indicated antibodies of total cell lysates (left) and nuclear enriched fractions (right) from parental or shPrmt1-expressing mT4 cells after 6 days of culturing with or without GEM. Hdac1 was used as loading control. Blots shown are representatives of at least three independent experiments. (D) WB analysis with indicated antibodies of immunoprecipitation (IP) with MafF or immunoglobulin (Ig) G antibody (top) and the corresponding inputs (bottom) from parental mT4 cells or mT4 cells expressing two different shPrmt1 shRNAs (shPrmt1 #1 and #2) after 6 days of culturing with or without GEM. Hdac1 was used as loading control. Blots shown are representatives of at least three independent experiments. (E and F) Representative images (E) and normalized OD (F) of parental (black) or MafF-KO (#1, red; #2, blue) mT4 cells treated with increasing concentration GEM, paclitaxel, 5-FU, irinotecan, or SN38 as indicated. Fitted lines and statistical significance were determined by two-way ANOVA analysis (mixed model). Shown is mean value ±SD of two independent experiments.
Figure 6.
Figure 6.. MAFF and BACH1 may play a major role in gemcitabine-induced epigenetic reprogramming
(A) Summary of the numbers of H3K27Ac+ or H3K27Ac− genomic loci bound by both MafF and Bach1 (MafF+Bach1+, purple), MafF alone (MafF+, blue), or Bach1 alone (Bach1+, orange) in mT4 cells at indicated time points (D0, 2, 4, 6, 8, 10) of GEM treatment, as detected by Cut&Tag. (B) Summary of the total numbers of genomic loci in mT4 cells that overlap with H3K27Ac, MafF, and/or Bach1 Cut&Tag peaks at one or more time points of GEM treatment (bottom) and their frequencies of overlap with the indicated genome features (top). Black and gray dots indicate positive and negative overlaps, respectively. (C) Aggregated Bach1, MafF, and H3K27Ac Cut&Tag signals within ±3 kb from of all known gene bodies (TSS-TTS) in mT4 cells at indicated time points of GEM treatment. (D) Aggregated Tn5-bias-corrected footprint (left) and signal (right) profiles within ±60 bp from the centers of the genomic sites matching the MAFK_MA0496.3 JASPAR motif from Bach1 (top) and MafF (bottom) Cut&Tag peaks grouped according to the statuses of overlap with each other and H3K27Ac at indicated time points of GEM treatment. Black and gray dots indicate positive and negative overlaps, respectively. (E) A working model of cooperative binding between MAFF and BACH1 that drives transcription activation or repression.
Figure 7.
Figure 7.. PRMT1 prevents the chromatin overloading of the MAFF/BACH1 transcriptional complexes in response to gemcitabine
(A) HSV transformation plot depicting differential MafF (left) and Bach1 (right) peaks across untreated parental (P), GEM-treated parental (P + GEM), and GEM-treated shP1-expressing (shP1 + GEM) mT4 cells. Each data point represents a significantly changed peak and is colored based on the pattern it displays comparing the normalized Z scores across P / P + GEM / shP1 + GEM. The distance of each point from the center of the circle represents maximum log2FC among the three conditions, and the color transparency represents the relative number of reads for that data point. Outer histograms represent the densities of differential MafF or Bach1 peaks overlapping TSS or CRE across all angular positions. (B) Aggregated signal (top) and Tn5-bias-corrected footprint (bottom) profiles within ±60 bp from the centers of the genomic sites matching the Bach1-Mafk_MA0591.1 JASPAR motif from MafF (left) and Bach1 (right) Cut&Tag peaks grouped according to the statuses of overlap with each other and H3K27Ac in untreated parental (P, gray line), GEM-treated parental (P + GEM, blue line), and GEM-treated shP1-expressing (shP1 + GEM, red line) mT4 cells. Black and gray dots indicate positive and negative overlaps, respectively.

Similar articles

Cited by

References

    1. Siegel RL, Miller KD, Fuchs HE, and Jemal A (2021). Cancer Statistics, 2021. CA. Cancer J. Clin. 71, 7–33. 10.3322/CAAC.21654. - DOI - PubMed
    1. von Hoff DD, Ervin T, Arena FP, Chiorean EG, Infante J, Moore M, Seay T, Tjulandin SA, Wee Ma W, Saleh N, et al. (2013). Increased Survival in Pancreatic Cancer with nab-Paclitaxel plus Gemcitabine. NEJM.org. N. Engl. J. Med. 18, 1691–1703. 10.1056/NEJMoa1304369. - DOI - PMC - PubMed
    1. Tsujimoto A, Sudo K, Nakamura K, Kita E, Hara R, Takayama W, Ishii H, and Yamaguchi T (2019). Gemcitabine plus nab-paclitaxel for locally advanced or borderline resectable pancreatic cancer. Sci. Rep, 16187–16188. 10.1038/s41598-019-52486-x. - DOI - PMC - PubMed
    1. Miranda Furtado CL, Dos Santos Luciano MC, Silva Santos RD, Furtado GP, Moraes MO, and Pessoa C (2019). Epidrugs: targeting epigenetic marks in cancer treatment. Epigenetics 14, 1164–1176. 10.1080/15592294.2019.1640546. - DOI - PMC - PubMed
    1. Barth TK, and Imhof A (2010). Fast signals and slow marks: the dynamics of histone modifications. Trends Biochem. Sci. 35, 618–626. 10.1016/J.TIBS.2010.05.006. - DOI - PubMed

Publication types

MeSH terms