. 2024 May 7;121(19):e2318003121.
doi: 10.1073/pnas.2318003121. Epub 2024 May 1.

An HLA-E-targeted TCR bispecific molecule redirects T cell immunity against Mycobacterium tuberculosis

Affiliations

An HLA-E-targeted TCR bispecific molecule redirects T cell immunity against Mycobacterium tuberculosis

Rachel L Paterson et al. Proc Natl Acad Sci U S A. .

Abstract

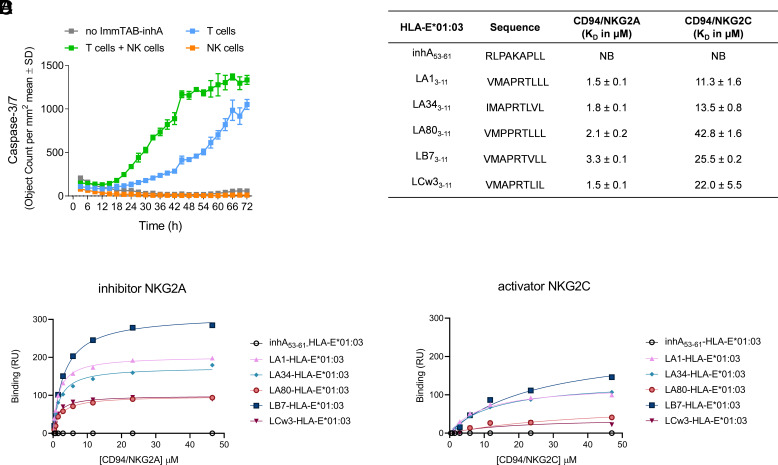
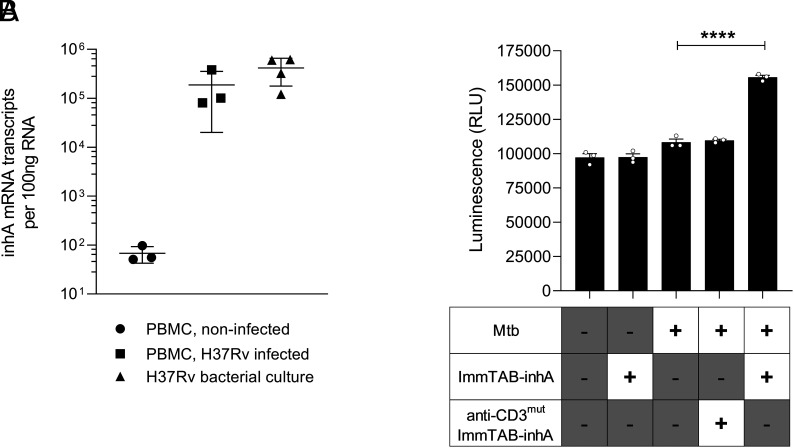
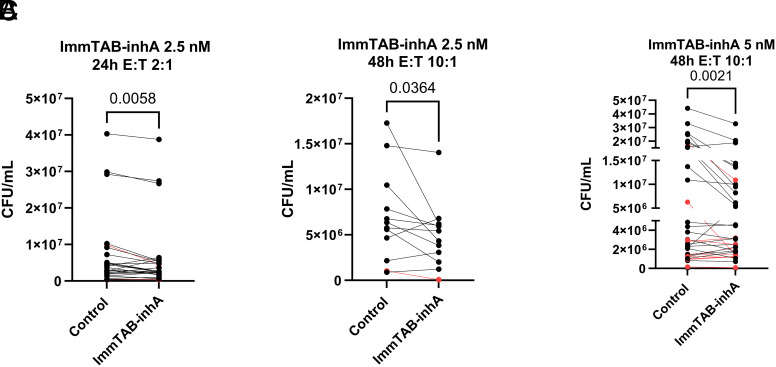
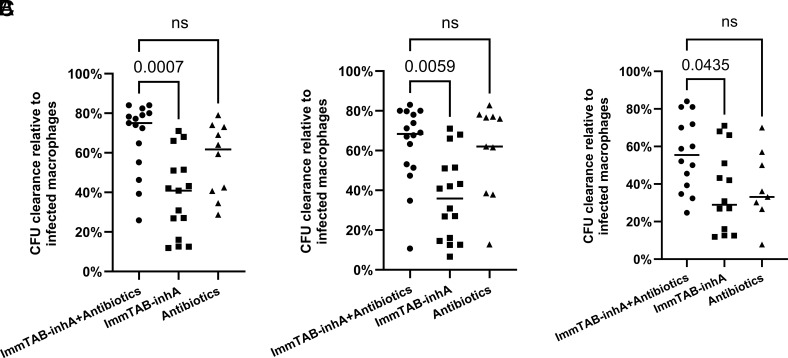
Peptides presented by HLA-E, a molecule with very limited polymorphism, represent attractive targets for T cell receptor (TCR)-based immunotherapies to circumvent the limitations imposed by the high polymorphism of classical HLA genes in the human population. Here, we describe a TCR-based bispecific molecule that potently and selectively binds HLA-E in complex with a peptide encoded by the inhA gene of Mycobacterium tuberculosis (Mtb), the causative agent of tuberculosis in humans. We reveal the biophysical and structural bases underpinning the potency and specificity of this molecule and demonstrate its ability to redirect polyclonal T cells to target HLA-E-expressing cells transduced with mycobacterial inhA as well as primary cells infected with virulent Mtb. Additionally, we demonstrate elimination of Mtb-infected cells and reduction of intracellular Mtb growth. Our study suggests an approach to enhance host T cell immunity against Mtb and provides proof of principle for an innovative TCR-based therapeutic strategy overcoming HLA polymorphism and therefore applicable to a broader patient population.

Keywords: HLA-E; T cell receptor; immunotherapy; tuberculosis.


Conflict of interest statement

Competing interests statement:R.L.P., V.A.D.S., A.W., D.G.-H., R.K., J.R.F., N.C.M., M.M., W.B., M.D., M.M.-U., T.G., C.B., D.L., C.B.-R., R.P., N. Chepisiuk, P.K.S., A.P.W., A.S.P., M.L.M., M.S., L.D., A.K., R.R., M.L., S.L., and L.F.G. are or were employees of Immunocore Ltd. A patent has been filed on the sequence and utility of the ImmTAB-inhA molecules described in this study. The authors have no additional financial interests.

Figures

Fig. 1.
Fig. 1.
Identification and validation of a stable Mtb peptide in HLA-E. (A) Mtb gene expression distributions generated from microarray data. Violin plots of Mtb complex gene expression in 15 clinical samples including 3 strains of each of 5 genotypes and 2 reference strains in activated (Left) or resting (Right) macrophages. The expression value of inhA in each sample is denoted by a black cross. (B) Half-life stability for a range of pHLA complexes containing leader and Mtb peptides, measured by SPR time course analysis. (C) Flow cytometry analysis of HLA-E surface expression of K562-E*01:01 and K562-E*01:03 cells either unpulsed or pulsed with the indicated peptide, normalized to leader peptide Cw33-11. (D) LC–MS quantitation of inhA53-61 in HLA-E and HLA-A*02:01 complexes immunopurified from THP-1 (Left) and U937 cells (Right). Extracted ion chromatograms for native (Top chromatograms) and spiked in synthetic isotopically labeled inhA53-61 peptides (Bottom chromatograms; marked with*) are shown. (E) Absolute quantities of indicated peptides (inhA53-61 and derived from HLA-leader) within immunopurified HLA-E.
Fig. 2.
Fig. 2.
Binding of wild-type and affinity-enhanced TCRs to HLA-E*01:03-inhA53-61. (A) Steady-state analysis was used to measure affinity (KD) of the wild-type TCR to HLA-E*01:03-inhA53-61 complex using a serial dilution of TCR; t1/2 was calculated using the dissociation rate constant. Binding of the wild-type TCR to HLA-A*02:01-inhA53-61 complex was also assessed. (B) Single-cycle kinetics was used to assess binding (KD and t1/2) of the affinity-enhanced a42b20 TCR to HLA-E*01:03-inhA53-61 complex. (C) Summary of KD and t1/2 values of the TCRs, representative of two independent measurements.
Fig. 3.
Fig. 3.
Structural overview of the affinity-enhanced a42b20 TCR in complex with HLA-E-inhA53-61 (A) Overall ribbon representation of TCR a42b20 in complex with HLA-E-inhA53-61; TCR alpha chain is colored gray, beta chain is blue, HLA chain is cream, the β2m is brown, and the peptide in olive stick representation. (B) Top–down view showing the pHLA surface; for orientation, HLA helices 1 and 2 are drawn as cylinders. pHLA surface is colored as in (A); residues that interact with the TCR alpha chain are colored gray, residues that interact with the TCR beta chain are in blue, and residues that interact with both the alpha and beta chains are in white. Gray and blue spheres show the position of the conserved disulfide bond in the alpha and beta variable domains, respectively; the vector joining them shows the crossing angle (79.2°). (C) Close-up view of the TCR-pHLA interface with residues introduced through affinity enhancement drawn as sticks and labeled in bold, hydrogen bonds and salt-bridges represented by yellow dashes. (D) TCR-pHLA interactions mapped onto sequence with truncated a42b20 and wild-type sequences provided to show sites modified by affinity enhancement. TCR alpha CDR loops are colored gray, whereas the beta CDR loops are colored blue. Peptide residues in gray or in blue font indicate that they are within 4.1 Å of TCR alpha chain or beta chain, respectively. Peptide residues 4 and 5 are highlighted in blue or in gray since they are also within 4.1 Å TCR of beta and alpha chain, respectively. TCR sequence annotation: positions in yellow or green font indicate that they are within 4.1 Å of HLA helix 2 or helix 1, respectively. Residues in bold indicate that they are within 4.1 Å of a peptide residue, with numbering above residues indicating the relevant peptide position/s.
Fig. 4.
Fig. 4.
ImmTAB-inhA elicit T cell responses against cells displaying the cognate pHLA-E complexes. (A) ELISPOT of dose-dependent IFN-γ release induced by ImmTAB-inhA in cocultures of PBMC from three healthy donors and THP-1-E cells pulsed with inhA53-61 (10 μM). (B) IFN-γ ELISPOT assays showing titratable activation of PBMC from three healthy donors by ImmTAB-inhA (2 nM) in the presence of THP-1-E cells pulsed with titrated levels of peptide. Controls (A and B) include: PBMC+ImmTAB-inhA (no target), PBMC+target cells (no ImmTAB), and PBMC+ImmTAB-inhA+target cells (unpulsed). Data are plotted as mean ± SD of triplicates. (C) IFN-γ release from healthy donor PBMC in the presence of indicated cell lines transduced with full-length inhA (+) or untransduced controls (–). ImmTAB-inhA was added at concentrations of 1 nM (white bars) or 0.1 nM (black bars). No target, a CD3 nonbinding ImmTAB-inhA (anti-CD3mut ImmTAB-inhA), and no ImmTAB-inhA were included as controls. (D) IFN-γ responses induced by 1 nM ImmTAB with PBMC cocultured with THP-1-E*01:03 pulsed with inhA53-61 (10 μg/mL) in the presence or absence of blocking mAbs against HLA-E, HLA-A2, or HLA-B7 (10 μg/mL). *, too numerous to count. (C and D) are representative of one of three donors tested in triplicate.
Fig. 5.
Fig. 5.
ImmTAB-inhA redirects multiple T cell subsets to elicit polyfunctional responses. (A) Gating strategy for identification of T cell subsets. T cell subsets were identified by gating first on singlets (FSC-A vs. FSC-H) and then lymphocytes (FSC-A vs. SSC-A). Live lymphocytes were then gated as cells excluding the fixable viability dye. From this negative gate, γδ T cells were identified as CD3+TCRγδ+. From the CD3+ TCRγδ gate, MAIT cells were identified as CD161+TRAV1-2+. The remaining cells were divided into CD4+CD8 (CD4+ T cells) or CD4CD8+ (CD8+ T cells). (B and C) Flow cytometry analysis of (B) CTV dilution and (C) CD107a+ surface levels induced by 1 nM ImmTAB-inhA in indicated T cell subsets identified by specific gating within PBMC cocultured with inhA-transduced HEK293T cells. The same analysis was performed within parallel control cocultures not treated with ImmTAB-inhA (no ImmTAB-inhA) or supplemented with ImmTAB-inhA and the cognate peptide (ImmTAB-inhA + cognate peptide). Left panels show representative histogram plots. Right panels depict cumulative results from four donors. Data in the Right panels are plotted as mean ± SD. (D) ImmTAB-inhA induces production of proinflammatory cytokines. PBMC effectors (E) were incubated with Ag+ HEK 293T target cells (T) at a 10:1 ratio in the absence or presence of 1 nM ImmTAB-inhA (I) for 5 d. Production of cytokines (proinflammatory and anti-inflammatory), GF, and chemokines was assessed in culture supernatants by the Luminex assay. The concentration of each cytokine is plotted for cultures without (E+T; open diamonds) and with ImmTAB-inhA (E+T+I; black circles) for each donor tested (n = 2).
Fig. 6.
Fig. 6.
ImmTAB-inhA mediates antigen-dependent T cell killing of target cells. (A) Apoptosis of Ag+ HEK293T cells cocultured with PBMC and a titration of ImmTAB-inhA measured by IncuCyte. Controls include Ag+ HEK 293T in the presence of ImmTAB-inhA with or without cognate peptide and Ag- HEK 293T in the presence of a CD3 nonbinding version of ImmTAB-inhA (anti-CD3mut ImmTAB-inhA). Data are representative from one of three donors tested in triplicate. (B) Confocal imaging of PBMC (blue) cocultured with a mixture of Ag+ (red; transduced with full-length inhA) and Ag− (yellow; nontransduced) A549 cells in the presence or absence of ImmTAB-inhA corresponding to Movies S1 and S2, respectively. Arrows indicate apoptosis of Ag+ target cells.
Fig. 7.
Fig. 7.
ImmTAB-inhA does not directly engage NK cells. (A) ImmTAB-inhA-mediated apoptosis of Ag+ HEK293T cells cultured with purified T cells, NK cells, or a mixture of the two populations measured by IncuCyte. Data represent mean ± SD of triplicates and are representative of four independent experiments. (BD) Determination of affinities parameters for CD94/NKG2A/C–pHLA-E complex interactions by SPR. (B) Binding affinity KD of CD94/NKG2A/C receptors for the panel of pHLA-E complexes analyzed; NB = no binding. Steady-state analysis was used to measure KD affinity of CD94/NKG2A (C) and CD94/NKG2C (D) to pHLA-E complexes (inhA53-61 and leader peptides) using a serial dilution of CD94/NKG2A/C receptors.
Fig. 8.
Fig. 8.
ImmTAB-inhA redirects T cells to kill Mtb-infected primary human cells. (A) Quantification of inhA mRNA in Mtb-infected PBMC by quantitative reverse transcription PCR plotting the average transcript number per 100 ng RNA from three PBMC donors. Mtb H37Rv cultured in broth and noninfected PBMC were included as positive and negative controls, respectively. (B) ImmTAB-inhA-mediated cell death of Mtb-infected primary cells in coculture with autologous healthy donor PBMC and 10 nM ImmTAB-inhA was determined by measuring luminescence using the ToxiLight assay. Controls included uninfected PBMC with and without ImmTAB-inhA, and Mtb-infected PBMC cocultured with or without a CD3 nonbinding version of ImmTAB-inhA (anti-CD3mut ImmTAB-inhA). Data represent mean ± SD of triplicates and are representative of three healthy donor PBMC assayed. ****p < 0.01.
Fig. 9.
Fig. 9.
ImmTAB-inhA redirects PBMC to inhibit the viability of intracellular Mtb. Reduction of Mtb CFUs in three different experimental coculture conditions: (A) 2 × 10⁵ PBMC, 2.5 nM ImmTAB-inhA, 24 h incubation (n = 28); (B) 1 × 10⁶ PBMC, 2.5 nM ImmTAB-inhA, 48 h incubation (n = 12); (C) 5 × 10⁵ PBMC, 5 nM ImmTAB-inhA, 48 h incubation (n = 33). Responses from IGRA positive donors are shown in red. Paired t- test was used to assess whether the differences between experimental conditions were statistically significant.
Fig. 10.
Fig. 10.
Combination of ImmTAB-inhA with isoniazid and ethambutol to inhibit the viability of intracellular Mtb. Mtb CFU measurements in Mtb-infected THP1 macrophages cocultured with PBMC (2 × 10⁵) and ImmTAB-inhA (2.5 nM) in the presence or absence of isoniazid and ethambutol at three different concentrations: (A) Isoniazid 0.1 µg/mL, ethambutol 5 µg/mL (n = 15); (B) Isoniazid 0.05 µg/mL, ethambutol 1 µg/mL (n = 16); (C) Isoniazid 0.01 µg/mL and ethambutol 0.5 µg/mL (n = 14). ImmTAB-inhA plus antibiotics (●), ImmTAB-inhA alone (■) and antibiotics alone (▲). Lines in each group represent the median. Kruskal-Wallis test was used to assess whether the differences between groups were statistically significant: ns, not significant.

Comment in

References

    1. Chakaya J., et al. , Global Tuberculosis Report 2020–Reflections on the Global TB burden, treatment and prevention efforts. Int. J. Infect. Dis. 113 (suppl. 1), S7–S12 (2021). - PMC - PubMed
    1. O’Garra A., et al. , The immune response in tuberculosis. Annu. Rev. Immunol. 31, 475–527 (2013). - PubMed
    1. de Martino M., Lodi L., Galli L., Chiappini E., Immune response to Mycobacterium tuberculosis: A narrative review. Front. Pediatr. 7, 350 (2019). - PMC - PubMed
    1. Jasenosky L. D., Scriba T. J., Hanekom W. A., Goldfeld A. E., T cells and adaptive immunity to Mycobacterium tuberculosis in humans. Immunol. Rev. 264, 74–87 (2015). - PubMed
    1. Roberts T., Beyers N., Aguirre A., Walzl G., Immunosuppression during active tuberculosis is characterized by decreased interferon-gamma production and CD25 expression with elevated forkhead box P3, transforming growth factor-beta, and interleukin-4 mRNA levels. J. Infect. Dis. 195, 870–878 (2007). - PubMed

Publication types

MeSH terms